Free Statistics

of Irreproducible Research!

Author's title

Author*Unverified author*
R Software Modulerwasp_smp.wasp
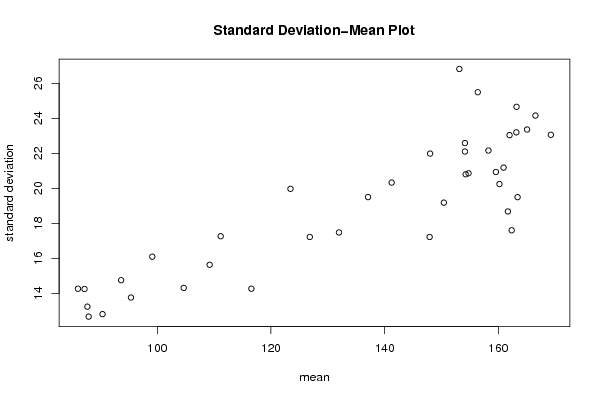
Title produced by softwareStandard Deviation-Mean Plot
Date of computationMon, 07 Jun 2010 06:35:41 +0000
Cite this page as followsStatistical Computations at FreeStatistics.org, Office for Research Development and Education, URL https://freestatistics.org/blog/index.php?v=date/2010/Jun/07/t12758925712g6bjik3zx8klyi.htm/, Retrieved Thu, 28 Mar 2024 21:11:15 +0000
Statistical Computations at FreeStatistics.org, Office for Research Development and Education, URL https://freestatistics.org/blog/index.php?pk=77842, Retrieved Thu, 28 Mar 2024 21:11:15 +0000
QR Codes:

Original text written by user:
IsPrivate?No (this computation is public)
User-defined keywords
Estimated Impact194
Family? (F = Feedback message, R = changed R code, M = changed R Module, P = changed Parameters, D = changed Data)
-     [Univariate Data Series] [Datareeks - Maand...] [2010-02-10 10:03:07] [718fc9b3d403b712b51e1f070e50e17e]
- RMPD  [Quartiles] [] [2010-03-03 14:47:39] [8c48e27933b6e9b9039434b966f024a4]
- RM      [Variability] [] [2010-05-26 19:41:23] [8c48e27933b6e9b9039434b966f024a4]
- RMP       [Standard Deviation-Mean Plot] [] [2010-05-26 19:49:59] [8c48e27933b6e9b9039434b966f024a4]
-   P           [Standard Deviation-Mean Plot] [] [2010-06-07 06:35:41] [abee0efc8e8d52b36c60065f2f882b43] [Current]
Feedback Forum

Post a new message
Dataseries X:
93.2
96
95.2
77.1
70.9
64.8
70.1
77.3
79.5
100.6
100.7
107.1
95.9
82.8
83.3
80
80.4
67.5
75.7
71.1
89.3
101.1
105.2
114.1
96.3
84.4
91.2
81.9
80.5
70.4
74.8
75.9
86.3
98.7
100.9
113.8
89.8
84.4
87.2
85.6
72
69.2
77.5
78.1
94.3
97.7
100.2
116.4
97.1
93
96
80.5
76.1
69.9
73.6
92.6
94.2
93.5
108.5
109.4
105.1
92.5
97.1
81.4
79.1
72.1
78.7
87.1
91.4
109.9
116.3
113
100
84.8
94.3
87.1
90.3
72.4
84.9
92.7
92.2
114.9
112.5
118.3
106
91.2
96.6
96.3
88.2
70.2
86.5
88.2
102.8
119.1
119.2
125.1
106.1
102.1
105.2
101
84.3
87.5
92.7
94.4
113
113.9
122.9
132.7
106.9
96.6
127.3
98.2
100.2
89.4
95.3
104.2
106.4
116.2
135.9
134
104.6
107.1
123.5
98.8
98.6
90.6
89.1
105.2
114
122.1
138
142.2
116.4
112.6
123.8
103.6
113.9
98.6
95
116
113.9
127.5
131.4
145.9
131.5
131
130.5
118.9
114.3
85.7
104.6
105.1
117.3
142.5
140
159.8
131.2
125.4
126.5
119.4
113.5
98.7
114.5
113.8
133.1
143.4
137.3
165.2
126.9
124
135.7
130
109.4
117.8
120.3
121
132.3
142.9
147.4
175.9
132.6
123.7
153.3
134
119.6
116.2
118.6
130.7
129.3
144.4
163.2
179.4
128.1
138.4
152.7
120
140.5
116.2
121.4
127.8
143.6
157.6
166.2
182.3
153.1
147.6
157.7
137.2
151.5
98.7
145.8
151.7
129.4
174.1
197
193.9
164.1
142.8
157.9
159.2
162.2
123.1
130
150.1
169.4
179.7
182.1
194.3
161.4
169.4
168.8
158.1
158.5
135.3
149.3
143.4
142.2
188.4
166.2
199.2
182.7
145.2
182.1
158.7
141.6
132.6
139.6
147
166.6
157
180.4
210.2
159.8
157.8
168.2
158.4
152
142.2
137.2
152.6
166.8
165.6
198.6
201.5
170.7
164.4
179.7
157
168
139.3
138.6
153.4
138.9
172.1
198.4
217.8
173.7
153.8
175.6
147.1
160.3
135.2
148.8
151
148.2
182.2
189.2
183.1
170
158.4
176.1
156.2
153.2
117.9
149.8
156.6
166.7
156.8
158.6
210.8
203.6
175.2
168.7
155.9
147.3
137
141.1
167.4
160.2
191.9
174.4
208.2
159.4
161.1
172.1
158.4
114.6
159.6
159.7
159.4
160.7
165.5
205
205.2
141.6
148.1
184.9
132.5
137.3
135.5
121.7
166.1
146.8
162.8
186.8
185.5
151.5
158.1
143
151.2
147.6
130.7
137.5
146.1
133.6
167.9
181.9
202
166.5
151.3
146.2
148.3
144.7
123.6
151.6
133.9
137.4
181.6
182
190
161.2
155.5
141.9
164.6
136.2
126.8
152.5
126.6
150.1
186.3
147.5
200.4
177.2
127.4
177.1
154.4
135.2
126.4
147.3
140.6
152.3
151.2
172.2
215.3
154.1
159.3
160.4
151.9
148.4
139.6
148.2
153.5
145.1
183.7
210.5
203.3
153.3
144.3
169.6
143.7
160.1
135.6
141.8
159.9
145.7
183.5
198.2
186.8
172
150.6
163.3
153.7
152.9
135.5
148.5
148.4
133.6
194.1
208.6
197.3
164.4
148.1
152
144.1
155
124.5
153
146
138
190
192
192
147
133
163
150
129
131
145
137
138
168
176
188
139
143
150
154
137
129
128
140
143
151
177
184
151
134
164
126
131
125
127
143
143
160
190
182
138
136
152
127
151
130
119
153


Summary of computational transaction
Raw Inputview raw input (R code)
Raw Outputview raw output of R engine
Computing time1 seconds
R Server'Gwilym Jenkins' @ 72.249.127.135

\begin{tabular}{lllllllll}
\hline
Summary of computational transaction \tabularnewline
Raw Input & view raw input (R code)  \tabularnewline
Raw Output & view raw output of R engine  \tabularnewline
Computing time & 1 seconds \tabularnewline
R Server & 'Gwilym Jenkins' @ 72.249.127.135 \tabularnewline
\hline
\end{tabular}
%Source: https://freestatistics.org/blog/index.php?pk=77842&T=0

[TABLE]
[ROW][C]Summary of computational transaction[/C][/ROW]
[ROW][C]Raw Input[/C][C]view raw input (R code) [/C][/ROW]
[ROW][C]Raw Output[/C][C]view raw output of R engine [/C][/ROW]
[ROW][C]Computing time[/C][C]1 seconds[/C][/ROW]
[ROW][C]R Server[/C][C]'Gwilym Jenkins' @ 72.249.127.135[/C][/ROW]
[/TABLE]
Source: https://freestatistics.org/blog/index.php?pk=77842&T=0

Globally Unique Identifier (entire table): ba.freestatistics.org/blog/index.php?pk=77842&T=0

As an alternative you can also use a QR Code:  

The GUIDs for individual cells are displayed in the table below:

Summary of computational transaction
Raw Inputview raw input (R code)
Raw Outputview raw output of R engine
Computing time1 seconds
R Server'Gwilym Jenkins' @ 72.249.127.135


Standard Deviation-Mean Plot
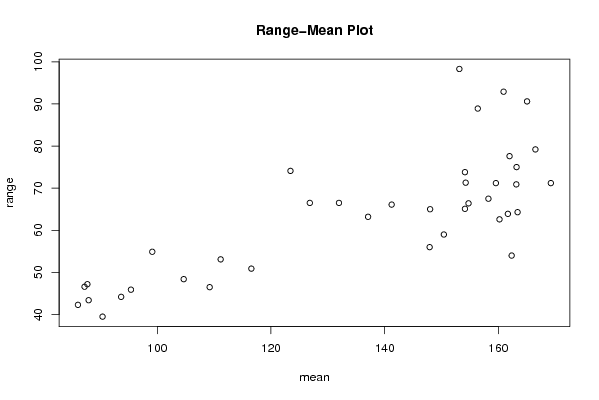
SectionMeanStandard DeviationRange
186.041666666666714.264798270461842.3
287.214.248189677671746.6
387.92512.668222591838443.4
487.713.240433939606847.2
590.366666666666712.811524168308539.5
693.641666666666714.750867976516044.2
795.366666666666713.762487442539645.9
899.116666666666716.094597248954754.9
9104.6514.313026488927048.4
10109.21666666666715.63410219728546.5
11111.1517.264809189899453.1
12116.5514.265948013618850.9
13123.43333333333319.974954014434974.1
14126.83333333333317.223152141723966.5
15131.96666666666717.480499958178566.5
16137.08333333333319.500015540009463.2
17141.23333333333320.331674050529466.1
18153.14166666666726.825885000510398.3
19159.57520.93570786088671.2
20161.68333333333318.679684313729963.9
21161.97523.043166015111777.6
22163.39166666666719.497993292240264.3
23166.52524.160566105649479.2
24162.3517.605603446836854
25160.92521.187308593933092.9
26169.24166666666723.061398614581271.2
27165.05833333333323.362847675639990.6
28154.13333333333322.590478015520165.1
29154.25833333333320.805133035048471.3
30154.75833333333320.862557079102066.4
31154.13333333333322.107272901728973.8
32156.38333333333325.496375262282988.9
33163.16666666666723.202246495204870.9
34160.20833333333320.247444657326962.6
35163.20833333333324.661175166768975
36158.25833333333322.163912451359267.5
37150.41666666666719.185497995447859
38147.91666666666717.222914616254456
3914821.987599811133265

\begin{tabular}{lllllllll}
\hline
Standard Deviation-Mean Plot \tabularnewline
Section & Mean & Standard Deviation & Range \tabularnewline
1 & 86.0416666666667 & 14.2647982704618 & 42.3 \tabularnewline
2 & 87.2 & 14.2481896776717 & 46.6 \tabularnewline
3 & 87.925 & 12.6682225918384 & 43.4 \tabularnewline
4 & 87.7 & 13.2404339396068 & 47.2 \tabularnewline
5 & 90.3666666666667 & 12.8115241683085 & 39.5 \tabularnewline
6 & 93.6416666666667 & 14.7508679765160 & 44.2 \tabularnewline
7 & 95.3666666666667 & 13.7624874425396 & 45.9 \tabularnewline
8 & 99.1166666666667 & 16.0945972489547 & 54.9 \tabularnewline
9 & 104.65 & 14.3130264889270 & 48.4 \tabularnewline
10 & 109.216666666667 & 15.634102197285 & 46.5 \tabularnewline
11 & 111.15 & 17.2648091898994 & 53.1 \tabularnewline
12 & 116.55 & 14.2659480136188 & 50.9 \tabularnewline
13 & 123.433333333333 & 19.9749540144349 & 74.1 \tabularnewline
14 & 126.833333333333 & 17.2231521417239 & 66.5 \tabularnewline
15 & 131.966666666667 & 17.4804999581785 & 66.5 \tabularnewline
16 & 137.083333333333 & 19.5000155400094 & 63.2 \tabularnewline
17 & 141.233333333333 & 20.3316740505294 & 66.1 \tabularnewline
18 & 153.141666666667 & 26.8258850005103 & 98.3 \tabularnewline
19 & 159.575 & 20.935707860886 & 71.2 \tabularnewline
20 & 161.683333333333 & 18.6796843137299 & 63.9 \tabularnewline
21 & 161.975 & 23.0431660151117 & 77.6 \tabularnewline
22 & 163.391666666667 & 19.4979932922402 & 64.3 \tabularnewline
23 & 166.525 & 24.1605661056494 & 79.2 \tabularnewline
24 & 162.35 & 17.6056034468368 & 54 \tabularnewline
25 & 160.925 & 21.1873085939330 & 92.9 \tabularnewline
26 & 169.241666666667 & 23.0613986145812 & 71.2 \tabularnewline
27 & 165.058333333333 & 23.3628476756399 & 90.6 \tabularnewline
28 & 154.133333333333 & 22.5904780155201 & 65.1 \tabularnewline
29 & 154.258333333333 & 20.8051330350484 & 71.3 \tabularnewline
30 & 154.758333333333 & 20.8625570791020 & 66.4 \tabularnewline
31 & 154.133333333333 & 22.1072729017289 & 73.8 \tabularnewline
32 & 156.383333333333 & 25.4963752622829 & 88.9 \tabularnewline
33 & 163.166666666667 & 23.2022464952048 & 70.9 \tabularnewline
34 & 160.208333333333 & 20.2474446573269 & 62.6 \tabularnewline
35 & 163.208333333333 & 24.6611751667689 & 75 \tabularnewline
36 & 158.258333333333 & 22.1639124513592 & 67.5 \tabularnewline
37 & 150.416666666667 & 19.1854979954478 & 59 \tabularnewline
38 & 147.916666666667 & 17.2229146162544 & 56 \tabularnewline
39 & 148 & 21.9875998111332 & 65 \tabularnewline
\hline
\end{tabular}
%Source: https://freestatistics.org/blog/index.php?pk=77842&T=1

[TABLE]
[ROW][C]Standard Deviation-Mean Plot[/C][/ROW]
[ROW][C]Section[/C][C]Mean[/C][C]Standard Deviation[/C][C]Range[/C][/ROW]
[ROW][C]1[/C][C]86.0416666666667[/C][C]14.2647982704618[/C][C]42.3[/C][/ROW]
[ROW][C]2[/C][C]87.2[/C][C]14.2481896776717[/C][C]46.6[/C][/ROW]
[ROW][C]3[/C][C]87.925[/C][C]12.6682225918384[/C][C]43.4[/C][/ROW]
[ROW][C]4[/C][C]87.7[/C][C]13.2404339396068[/C][C]47.2[/C][/ROW]
[ROW][C]5[/C][C]90.3666666666667[/C][C]12.8115241683085[/C][C]39.5[/C][/ROW]
[ROW][C]6[/C][C]93.6416666666667[/C][C]14.7508679765160[/C][C]44.2[/C][/ROW]
[ROW][C]7[/C][C]95.3666666666667[/C][C]13.7624874425396[/C][C]45.9[/C][/ROW]
[ROW][C]8[/C][C]99.1166666666667[/C][C]16.0945972489547[/C][C]54.9[/C][/ROW]
[ROW][C]9[/C][C]104.65[/C][C]14.3130264889270[/C][C]48.4[/C][/ROW]
[ROW][C]10[/C][C]109.216666666667[/C][C]15.634102197285[/C][C]46.5[/C][/ROW]
[ROW][C]11[/C][C]111.15[/C][C]17.2648091898994[/C][C]53.1[/C][/ROW]
[ROW][C]12[/C][C]116.55[/C][C]14.2659480136188[/C][C]50.9[/C][/ROW]
[ROW][C]13[/C][C]123.433333333333[/C][C]19.9749540144349[/C][C]74.1[/C][/ROW]
[ROW][C]14[/C][C]126.833333333333[/C][C]17.2231521417239[/C][C]66.5[/C][/ROW]
[ROW][C]15[/C][C]131.966666666667[/C][C]17.4804999581785[/C][C]66.5[/C][/ROW]
[ROW][C]16[/C][C]137.083333333333[/C][C]19.5000155400094[/C][C]63.2[/C][/ROW]
[ROW][C]17[/C][C]141.233333333333[/C][C]20.3316740505294[/C][C]66.1[/C][/ROW]
[ROW][C]18[/C][C]153.141666666667[/C][C]26.8258850005103[/C][C]98.3[/C][/ROW]
[ROW][C]19[/C][C]159.575[/C][C]20.935707860886[/C][C]71.2[/C][/ROW]
[ROW][C]20[/C][C]161.683333333333[/C][C]18.6796843137299[/C][C]63.9[/C][/ROW]
[ROW][C]21[/C][C]161.975[/C][C]23.0431660151117[/C][C]77.6[/C][/ROW]
[ROW][C]22[/C][C]163.391666666667[/C][C]19.4979932922402[/C][C]64.3[/C][/ROW]
[ROW][C]23[/C][C]166.525[/C][C]24.1605661056494[/C][C]79.2[/C][/ROW]
[ROW][C]24[/C][C]162.35[/C][C]17.6056034468368[/C][C]54[/C][/ROW]
[ROW][C]25[/C][C]160.925[/C][C]21.1873085939330[/C][C]92.9[/C][/ROW]
[ROW][C]26[/C][C]169.241666666667[/C][C]23.0613986145812[/C][C]71.2[/C][/ROW]
[ROW][C]27[/C][C]165.058333333333[/C][C]23.3628476756399[/C][C]90.6[/C][/ROW]
[ROW][C]28[/C][C]154.133333333333[/C][C]22.5904780155201[/C][C]65.1[/C][/ROW]
[ROW][C]29[/C][C]154.258333333333[/C][C]20.8051330350484[/C][C]71.3[/C][/ROW]
[ROW][C]30[/C][C]154.758333333333[/C][C]20.8625570791020[/C][C]66.4[/C][/ROW]
[ROW][C]31[/C][C]154.133333333333[/C][C]22.1072729017289[/C][C]73.8[/C][/ROW]
[ROW][C]32[/C][C]156.383333333333[/C][C]25.4963752622829[/C][C]88.9[/C][/ROW]
[ROW][C]33[/C][C]163.166666666667[/C][C]23.2022464952048[/C][C]70.9[/C][/ROW]
[ROW][C]34[/C][C]160.208333333333[/C][C]20.2474446573269[/C][C]62.6[/C][/ROW]
[ROW][C]35[/C][C]163.208333333333[/C][C]24.6611751667689[/C][C]75[/C][/ROW]
[ROW][C]36[/C][C]158.258333333333[/C][C]22.1639124513592[/C][C]67.5[/C][/ROW]
[ROW][C]37[/C][C]150.416666666667[/C][C]19.1854979954478[/C][C]59[/C][/ROW]
[ROW][C]38[/C][C]147.916666666667[/C][C]17.2229146162544[/C][C]56[/C][/ROW]
[ROW][C]39[/C][C]148[/C][C]21.9875998111332[/C][C]65[/C][/ROW]
[/TABLE]
Source: https://freestatistics.org/blog/index.php?pk=77842&T=1

Globally Unique Identifier (entire table): ba.freestatistics.org/blog/index.php?pk=77842&T=1

As an alternative you can also use a QR Code:  

The GUIDs for individual cells are displayed in the table below:

Standard Deviation-Mean Plot
SectionMeanStandard DeviationRange
186.041666666666714.264798270461842.3
287.214.248189677671746.6
387.92512.668222591838443.4
487.713.240433939606847.2
590.366666666666712.811524168308539.5
693.641666666666714.750867976516044.2
795.366666666666713.762487442539645.9
899.116666666666716.094597248954754.9
9104.6514.313026488927048.4
10109.21666666666715.63410219728546.5
11111.1517.264809189899453.1
12116.5514.265948013618850.9
13123.43333333333319.974954014434974.1
14126.83333333333317.223152141723966.5
15131.96666666666717.480499958178566.5
16137.08333333333319.500015540009463.2
17141.23333333333320.331674050529466.1
18153.14166666666726.825885000510398.3
19159.57520.93570786088671.2
20161.68333333333318.679684313729963.9
21161.97523.043166015111777.6
22163.39166666666719.497993292240264.3
23166.52524.160566105649479.2
24162.3517.605603446836854
25160.92521.187308593933092.9
26169.24166666666723.061398614581271.2
27165.05833333333323.362847675639990.6
28154.13333333333322.590478015520165.1
29154.25833333333320.805133035048471.3
30154.75833333333320.862557079102066.4
31154.13333333333322.107272901728973.8
32156.38333333333325.496375262282988.9
33163.16666666666723.202246495204870.9
34160.20833333333320.247444657326962.6
35163.20833333333324.661175166768975
36158.25833333333322.163912451359267.5
37150.41666666666719.185497995447859
38147.91666666666717.222914616254456
3914821.987599811133265


Regression: S.E.(k) = alpha + beta * Mean(k)
alpha3.23178050020992
beta0.116709521448479
S.D.0.0112037350160626
T-STAT10.4170190816862
p-value1.48891692052211e-12

\begin{tabular}{lllllllll}
\hline
Regression: S.E.(k) = alpha + beta * Mean(k) \tabularnewline
alpha & 3.23178050020992 \tabularnewline
beta & 0.116709521448479 \tabularnewline
S.D. & 0.0112037350160626 \tabularnewline
T-STAT & 10.4170190816862 \tabularnewline
p-value & 1.48891692052211e-12 \tabularnewline
\hline
\end{tabular}
%Source: https://freestatistics.org/blog/index.php?pk=77842&T=2

[TABLE]
[ROW][C]Regression: S.E.(k) = alpha + beta * Mean(k)[/C][/ROW]
[ROW][C]alpha[/C][C]3.23178050020992[/C][/ROW]
[ROW][C]beta[/C][C]0.116709521448479[/C][/ROW]
[ROW][C]S.D.[/C][C]0.0112037350160626[/C][/ROW]
[ROW][C]T-STAT[/C][C]10.4170190816862[/C][/ROW]
[ROW][C]p-value[/C][C]1.48891692052211e-12[/C][/ROW]
[/TABLE]
Source: https://freestatistics.org/blog/index.php?pk=77842&T=2

Globally Unique Identifier (entire table): ba.freestatistics.org/blog/index.php?pk=77842&T=2

As an alternative you can also use a QR Code:  

The GUIDs for individual cells are displayed in the table below:

Regression: S.E.(k) = alpha + beta * Mean(k)
alpha3.23178050020992
beta0.116709521448479
S.D.0.0112037350160626
T-STAT10.4170190816862
p-value1.48891692052211e-12


Regression: ln S.E.(k) = alpha + beta * ln Mean(k)
alpha-1.01252660216091
beta0.806351342795126
S.D.0.0683168082567998
T-STAT11.8031179056856
p-value4.15512890219667e-14
Lambda0.193648657204874

\begin{tabular}{lllllllll}
\hline
Regression: ln S.E.(k) = alpha + beta * ln Mean(k) \tabularnewline
alpha & -1.01252660216091 \tabularnewline
beta & 0.806351342795126 \tabularnewline
S.D. & 0.0683168082567998 \tabularnewline
T-STAT & 11.8031179056856 \tabularnewline
p-value & 4.15512890219667e-14 \tabularnewline
Lambda & 0.193648657204874 \tabularnewline
\hline
\end{tabular}
%Source: https://freestatistics.org/blog/index.php?pk=77842&T=3

[TABLE]
[ROW][C]Regression: ln S.E.(k) = alpha + beta * ln Mean(k)[/C][/ROW]
[ROW][C]alpha[/C][C]-1.01252660216091[/C][/ROW]
[ROW][C]beta[/C][C]0.806351342795126[/C][/ROW]
[ROW][C]S.D.[/C][C]0.0683168082567998[/C][/ROW]
[ROW][C]T-STAT[/C][C]11.8031179056856[/C][/ROW]
[ROW][C]p-value[/C][C]4.15512890219667e-14[/C][/ROW]
[ROW][C]Lambda[/C][C]0.193648657204874[/C][/ROW]
[/TABLE]
Source: https://freestatistics.org/blog/index.php?pk=77842&T=3

Globally Unique Identifier (entire table): ba.freestatistics.org/blog/index.php?pk=77842&T=3

As an alternative you can also use a QR Code:  

The GUIDs for individual cells are displayed in the table below:

Regression: ln S.E.(k) = alpha + beta * ln Mean(k)
alpha-1.01252660216091
beta0.806351342795126
S.D.0.0683168082567998
T-STAT11.8031179056856
p-value4.15512890219667e-14
Lambda0.193648657204874


Parameters (Session):
par1 = 12 ;
Parameters (R input):
par1 = 12 ;
R code (references can be found in the software module):
par1 <- as.numeric(par1)
(n <- length(x))
(np <- floor(n / par1))
arr <- array(NA,dim=c(par1,np))
j <- 0
k <- 1
for (i in 1:(np*par1))
{
j = j + 1
arr[j,k] <- x[i]
if (j == par1) {
j = 0
k=k+1
}
}
arr
arr.mean <- array(NA,dim=np)
arr.sd <- array(NA,dim=np)
arr.range <- array(NA,dim=np)
for (j in 1:np)
{
arr.mean[j] <- mean(arr[,j],na.rm=TRUE)
arr.sd[j] <- sd(arr[,j],na.rm=TRUE)
arr.range[j] <- max(arr[,j],na.rm=TRUE) - min(arr[,j],na.rm=TRUE)
}
arr.mean
arr.sd
arr.range
(lm1 <- lm(arr.sd~arr.mean))
(lnlm1 <- lm(log(arr.sd)~log(arr.mean)))
(lm2 <- lm(arr.range~arr.mean))
bitmap(file='test1.png')
plot(arr.mean,arr.sd,main='Standard Deviation-Mean Plot',xlab='mean',ylab='standard deviation')
dev.off()
bitmap(file='test2.png')
plot(arr.mean,arr.range,main='Range-Mean Plot',xlab='mean',ylab='range')
dev.off()
load(file='createtable')
a<-table.start()
a<-table.row.start(a)
a<-table.element(a,'Standard Deviation-Mean Plot',4,TRUE)
a<-table.row.end(a)
a<-table.row.start(a)
a<-table.element(a,'Section',header=TRUE)
a<-table.element(a,'Mean',header=TRUE)
a<-table.element(a,'Standard Deviation',header=TRUE)
a<-table.element(a,'Range',header=TRUE)
a<-table.row.end(a)
for (j in 1:np) {
a<-table.row.start(a)
a<-table.element(a,j,header=TRUE)
a<-table.element(a,arr.mean[j])
a<-table.element(a,arr.sd[j] )
a<-table.element(a,arr.range[j] )
a<-table.row.end(a)
}
a<-table.end(a)
table.save(a,file='mytable.tab')
a<-table.start()
a<-table.row.start(a)
a<-table.element(a,'Regression: S.E.(k) = alpha + beta * Mean(k)',2,TRUE)
a<-table.row.end(a)
a<-table.row.start(a)
a<-table.element(a,'alpha',header=TRUE)
a<-table.element(a,lm1$coefficients[[1]])
a<-table.row.end(a)
a<-table.row.start(a)
a<-table.element(a,'beta',header=TRUE)
a<-table.element(a,lm1$coefficients[[2]])
a<-table.row.end(a)
a<-table.row.start(a)
a<-table.element(a,'S.D.',header=TRUE)
a<-table.element(a,summary(lm1)$coefficients[2,2])
a<-table.row.end(a)
a<-table.row.start(a)
a<-table.element(a,'T-STAT',header=TRUE)
a<-table.element(a,summary(lm1)$coefficients[2,3])
a<-table.row.end(a)
a<-table.row.start(a)
a<-table.element(a,'p-value',header=TRUE)
a<-table.element(a,summary(lm1)$coefficients[2,4])
a<-table.row.end(a)
a<-table.end(a)
table.save(a,file='mytable1.tab')
a<-table.start()
a<-table.row.start(a)
a<-table.element(a,'Regression: ln S.E.(k) = alpha + beta * ln Mean(k)',2,TRUE)
a<-table.row.end(a)
a<-table.row.start(a)
a<-table.element(a,'alpha',header=TRUE)
a<-table.element(a,lnlm1$coefficients[[1]])
a<-table.row.end(a)
a<-table.row.start(a)
a<-table.element(a,'beta',header=TRUE)
a<-table.element(a,lnlm1$coefficients[[2]])
a<-table.row.end(a)
a<-table.row.start(a)
a<-table.element(a,'S.D.',header=TRUE)
a<-table.element(a,summary(lnlm1)$coefficients[2,2])
a<-table.row.end(a)
a<-table.row.start(a)
a<-table.element(a,'T-STAT',header=TRUE)
a<-table.element(a,summary(lnlm1)$coefficients[2,3])
a<-table.row.end(a)
a<-table.row.start(a)
a<-table.element(a,'p-value',header=TRUE)
a<-table.element(a,summary(lnlm1)$coefficients[2,4])
a<-table.row.end(a)
a<-table.row.start(a)
a<-table.element(a,'Lambda',header=TRUE)
a<-table.element(a,1-lnlm1$coefficients[[2]])
a<-table.row.end(a)
a<-table.end(a)
table.save(a,file='mytable2.tab')