Free Statistics

of Irreproducible Research!

Author's title

Author*Unverified author*
R Software Modulerwasp_autocorrelation.wasp
Title produced by software(Partial) Autocorrelation Function
Date of computationThu, 27 May 2010 13:16:12 +0000
Cite this page as followsStatistical Computations at FreeStatistics.org, Office for Research Development and Education, URL https://freestatistics.org/blog/index.php?v=date/2010/May/27/t1274966245kvp2z44i7aetnh5.htm/, Retrieved Sun, 28 Apr 2024 08:16:35 +0000
Statistical Computations at FreeStatistics.org, Office for Research Development and Education, URL https://freestatistics.org/blog/index.php?pk=76602, Retrieved Sun, 28 Apr 2024 08:16:35 +0000
QR Codes:

Original text written by user:
IsPrivate?No (this computation is public)
User-defined keywords
Estimated Impact175
Family? (F = Feedback message, R = changed R code, M = changed R Module, P = changed Parameters, D = changed Data)
-     [(Partial) Autocorrelation Function] [Autocorrelatie wi...] [2010-05-03 16:01:50] [05bbf10299dcd1da03eee55b39d86f8c]
-    D    [(Partial) Autocorrelation Function] [Autocorrelatie wi...] [2010-05-27 13:16:12] [d4eb12efc488666eba544481d350541e] [Current]
Feedback Forum

Post a new message
Dataseries X:
1.1591
1.1203
1.0886
1.0701
1.0630
1.0377
1.0370
1.0605
1.0497
1.0706
1.0328
1.0110
1.0131
0.9834
0.9643
0.9449
0.9059
0.9505
0.9386
0.9045
0.8695
0.8525
0.8552
0.8983
0.9376
0.9205
0.9083
0.8925
0.8753
0.8530
0.8615
0.9014
0.9114
0.9050
0.8883
0.8912
0.8832
0.8707
0.8766
0.8860
0.9170
0.9561
0.9935
0.9781
0.9806
0.9812
1.0013
1.0194
1.0622
1.0785
1.0797
1.0862
1.1556
1.1674
1.1365
1.1155
1.1267
1.1714
1.1710
1.2298
1.2638
1.2640
1.2261
1.1989
1.2000
1.2146
1.2266
1.2191
1.2224
1.2507
1.2997
1.3406
1.3123
1.3013
1.3185
1.2943
1.2697
1.2155
1.2041
1.2295
1.2234
1.2022
1.1789
1.1861
1.2126
1.1940
1.2028
1.2273
1.2767
1.2661
1.2681
1.2810
1.2722
1.2617
1.2888
1.3205
1.2993
1.3080
1.3246
1.3513
1.3518
1.3421
1.3726
1.3626
1.3910
1.4233
1.4683
1.4559
1.4728
1.4759
1.5520
1.5754
1.5554
1.5562
1.5759
1.4955
1.4342
1.3266
1.2744
1.3511
1.3244
1.2797
1.3050
1.3199
1.3646
1.4014
1.4092
1.4266
1.4575
1.4821
1.4908
1.4579


Summary of computational transaction
Raw Inputview raw input (R code)
Raw Outputview raw output of R engine
Computing time1 seconds
R Server'RServer@AstonUniversity' @ vre.aston.ac.uk

\begin{tabular}{lllllllll}
\hline
Summary of computational transaction \tabularnewline
Raw Input & view raw input (R code)  \tabularnewline
Raw Output & view raw output of R engine  \tabularnewline
Computing time & 1 seconds \tabularnewline
R Server & 'RServer@AstonUniversity' @ vre.aston.ac.uk \tabularnewline
\hline
\end{tabular}
%Source: https://freestatistics.org/blog/index.php?pk=76602&T=0

[TABLE]
[ROW][C]Summary of computational transaction[/C][/ROW]
[ROW][C]Raw Input[/C][C]view raw input (R code) [/C][/ROW]
[ROW][C]Raw Output[/C][C]view raw output of R engine [/C][/ROW]
[ROW][C]Computing time[/C][C]1 seconds[/C][/ROW]
[ROW][C]R Server[/C][C]'RServer@AstonUniversity' @ vre.aston.ac.uk[/C][/ROW]
[/TABLE]
Source: https://freestatistics.org/blog/index.php?pk=76602&T=0

Globally Unique Identifier (entire table): ba.freestatistics.org/blog/index.php?pk=76602&T=0

As an alternative you can also use a QR Code:  

The GUIDs for individual cells are displayed in the table below:

Summary of computational transaction
Raw Inputview raw input (R code)
Raw Outputview raw output of R engine
Computing time1 seconds
R Server'RServer@AstonUniversity' @ vre.aston.ac.uk


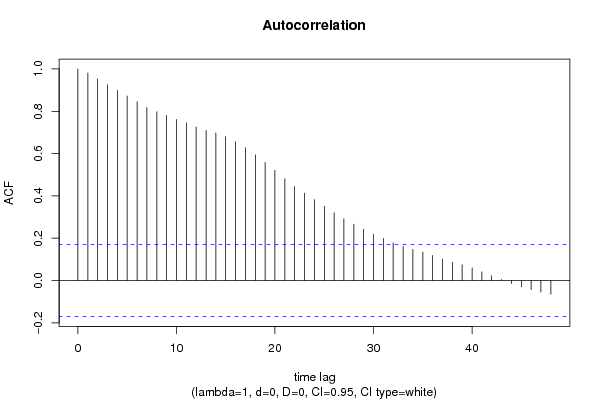
Autocorrelation Function
Time lag kACF(k)T-STATP-value
10.98089811.26970
20.95277510.94650
30.92519210.62970
40.89853310.32340
50.8720810.01940
60.8444169.70160
70.8182689.40120
80.7980169.16850
90.7797918.95910
100.7613818.74760
110.7446698.55560
120.7262028.34340
130.7090858.14680
140.6971578.00970
150.6800257.81290
160.6558367.5350
170.6281147.21650
180.593986.82430
190.5581466.41260
200.5199925.97430
210.4808025.5240
220.4446555.10871e-06
230.4131424.74663e-06
240.3824524.3941.1e-05
250.3515454.03894.5e-05
260.320263.67950.00017
270.2921983.35710.000515
280.2664353.06110.001336
290.242212.78280.00309
300.2187222.51290.006589
310.1988352.28440.011971
320.1788292.05460.020946
330.1608821.84840.033391
340.1472141.69140.046563
350.134531.54560.062294
360.1187551.36440.087384
370.100911.15940.124199
380.0867190.99630.160456
390.0742060.85260.197724
400.0596010.68480.247346
410.0412040.47340.318355
420.0232390.2670.394944
430.0050420.05790.476945
44-0.014102-0.1620.435768
45-0.029007-0.33330.36973
46-0.042491-0.48820.313114
47-0.054161-0.62230.26742
48-0.064294-0.73870.230705

\begin{tabular}{lllllllll}
\hline
Autocorrelation Function \tabularnewline
Time lag k & ACF(k) & T-STAT & P-value \tabularnewline
1 & 0.980898 & 11.2697 & 0 \tabularnewline
2 & 0.952775 & 10.9465 & 0 \tabularnewline
3 & 0.925192 & 10.6297 & 0 \tabularnewline
4 & 0.898533 & 10.3234 & 0 \tabularnewline
5 & 0.87208 & 10.0194 & 0 \tabularnewline
6 & 0.844416 & 9.7016 & 0 \tabularnewline
7 & 0.818268 & 9.4012 & 0 \tabularnewline
8 & 0.798016 & 9.1685 & 0 \tabularnewline
9 & 0.779791 & 8.9591 & 0 \tabularnewline
10 & 0.761381 & 8.7476 & 0 \tabularnewline
11 & 0.744669 & 8.5556 & 0 \tabularnewline
12 & 0.726202 & 8.3434 & 0 \tabularnewline
13 & 0.709085 & 8.1468 & 0 \tabularnewline
14 & 0.697157 & 8.0097 & 0 \tabularnewline
15 & 0.680025 & 7.8129 & 0 \tabularnewline
16 & 0.655836 & 7.535 & 0 \tabularnewline
17 & 0.628114 & 7.2165 & 0 \tabularnewline
18 & 0.59398 & 6.8243 & 0 \tabularnewline
19 & 0.558146 & 6.4126 & 0 \tabularnewline
20 & 0.519992 & 5.9743 & 0 \tabularnewline
21 & 0.480802 & 5.524 & 0 \tabularnewline
22 & 0.444655 & 5.1087 & 1e-06 \tabularnewline
23 & 0.413142 & 4.7466 & 3e-06 \tabularnewline
24 & 0.382452 & 4.394 & 1.1e-05 \tabularnewline
25 & 0.351545 & 4.0389 & 4.5e-05 \tabularnewline
26 & 0.32026 & 3.6795 & 0.00017 \tabularnewline
27 & 0.292198 & 3.3571 & 0.000515 \tabularnewline
28 & 0.266435 & 3.0611 & 0.001336 \tabularnewline
29 & 0.24221 & 2.7828 & 0.00309 \tabularnewline
30 & 0.218722 & 2.5129 & 0.006589 \tabularnewline
31 & 0.198835 & 2.2844 & 0.011971 \tabularnewline
32 & 0.178829 & 2.0546 & 0.020946 \tabularnewline
33 & 0.160882 & 1.8484 & 0.033391 \tabularnewline
34 & 0.147214 & 1.6914 & 0.046563 \tabularnewline
35 & 0.13453 & 1.5456 & 0.062294 \tabularnewline
36 & 0.118755 & 1.3644 & 0.087384 \tabularnewline
37 & 0.10091 & 1.1594 & 0.124199 \tabularnewline
38 & 0.086719 & 0.9963 & 0.160456 \tabularnewline
39 & 0.074206 & 0.8526 & 0.197724 \tabularnewline
40 & 0.059601 & 0.6848 & 0.247346 \tabularnewline
41 & 0.041204 & 0.4734 & 0.318355 \tabularnewline
42 & 0.023239 & 0.267 & 0.394944 \tabularnewline
43 & 0.005042 & 0.0579 & 0.476945 \tabularnewline
44 & -0.014102 & -0.162 & 0.435768 \tabularnewline
45 & -0.029007 & -0.3333 & 0.36973 \tabularnewline
46 & -0.042491 & -0.4882 & 0.313114 \tabularnewline
47 & -0.054161 & -0.6223 & 0.26742 \tabularnewline
48 & -0.064294 & -0.7387 & 0.230705 \tabularnewline
\hline
\end{tabular}
%Source: https://freestatistics.org/blog/index.php?pk=76602&T=1

[TABLE]
[ROW][C]Autocorrelation Function[/C][/ROW]
[ROW][C]Time lag k[/C][C]ACF(k)[/C][C]T-STAT[/C][C]P-value[/C][/ROW]
[ROW][C]1[/C][C]0.980898[/C][C]11.2697[/C][C]0[/C][/ROW]
[ROW][C]2[/C][C]0.952775[/C][C]10.9465[/C][C]0[/C][/ROW]
[ROW][C]3[/C][C]0.925192[/C][C]10.6297[/C][C]0[/C][/ROW]
[ROW][C]4[/C][C]0.898533[/C][C]10.3234[/C][C]0[/C][/ROW]
[ROW][C]5[/C][C]0.87208[/C][C]10.0194[/C][C]0[/C][/ROW]
[ROW][C]6[/C][C]0.844416[/C][C]9.7016[/C][C]0[/C][/ROW]
[ROW][C]7[/C][C]0.818268[/C][C]9.4012[/C][C]0[/C][/ROW]
[ROW][C]8[/C][C]0.798016[/C][C]9.1685[/C][C]0[/C][/ROW]
[ROW][C]9[/C][C]0.779791[/C][C]8.9591[/C][C]0[/C][/ROW]
[ROW][C]10[/C][C]0.761381[/C][C]8.7476[/C][C]0[/C][/ROW]
[ROW][C]11[/C][C]0.744669[/C][C]8.5556[/C][C]0[/C][/ROW]
[ROW][C]12[/C][C]0.726202[/C][C]8.3434[/C][C]0[/C][/ROW]
[ROW][C]13[/C][C]0.709085[/C][C]8.1468[/C][C]0[/C][/ROW]
[ROW][C]14[/C][C]0.697157[/C][C]8.0097[/C][C]0[/C][/ROW]
[ROW][C]15[/C][C]0.680025[/C][C]7.8129[/C][C]0[/C][/ROW]
[ROW][C]16[/C][C]0.655836[/C][C]7.535[/C][C]0[/C][/ROW]
[ROW][C]17[/C][C]0.628114[/C][C]7.2165[/C][C]0[/C][/ROW]
[ROW][C]18[/C][C]0.59398[/C][C]6.8243[/C][C]0[/C][/ROW]
[ROW][C]19[/C][C]0.558146[/C][C]6.4126[/C][C]0[/C][/ROW]
[ROW][C]20[/C][C]0.519992[/C][C]5.9743[/C][C]0[/C][/ROW]
[ROW][C]21[/C][C]0.480802[/C][C]5.524[/C][C]0[/C][/ROW]
[ROW][C]22[/C][C]0.444655[/C][C]5.1087[/C][C]1e-06[/C][/ROW]
[ROW][C]23[/C][C]0.413142[/C][C]4.7466[/C][C]3e-06[/C][/ROW]
[ROW][C]24[/C][C]0.382452[/C][C]4.394[/C][C]1.1e-05[/C][/ROW]
[ROW][C]25[/C][C]0.351545[/C][C]4.0389[/C][C]4.5e-05[/C][/ROW]
[ROW][C]26[/C][C]0.32026[/C][C]3.6795[/C][C]0.00017[/C][/ROW]
[ROW][C]27[/C][C]0.292198[/C][C]3.3571[/C][C]0.000515[/C][/ROW]
[ROW][C]28[/C][C]0.266435[/C][C]3.0611[/C][C]0.001336[/C][/ROW]
[ROW][C]29[/C][C]0.24221[/C][C]2.7828[/C][C]0.00309[/C][/ROW]
[ROW][C]30[/C][C]0.218722[/C][C]2.5129[/C][C]0.006589[/C][/ROW]
[ROW][C]31[/C][C]0.198835[/C][C]2.2844[/C][C]0.011971[/C][/ROW]
[ROW][C]32[/C][C]0.178829[/C][C]2.0546[/C][C]0.020946[/C][/ROW]
[ROW][C]33[/C][C]0.160882[/C][C]1.8484[/C][C]0.033391[/C][/ROW]
[ROW][C]34[/C][C]0.147214[/C][C]1.6914[/C][C]0.046563[/C][/ROW]
[ROW][C]35[/C][C]0.13453[/C][C]1.5456[/C][C]0.062294[/C][/ROW]
[ROW][C]36[/C][C]0.118755[/C][C]1.3644[/C][C]0.087384[/C][/ROW]
[ROW][C]37[/C][C]0.10091[/C][C]1.1594[/C][C]0.124199[/C][/ROW]
[ROW][C]38[/C][C]0.086719[/C][C]0.9963[/C][C]0.160456[/C][/ROW]
[ROW][C]39[/C][C]0.074206[/C][C]0.8526[/C][C]0.197724[/C][/ROW]
[ROW][C]40[/C][C]0.059601[/C][C]0.6848[/C][C]0.247346[/C][/ROW]
[ROW][C]41[/C][C]0.041204[/C][C]0.4734[/C][C]0.318355[/C][/ROW]
[ROW][C]42[/C][C]0.023239[/C][C]0.267[/C][C]0.394944[/C][/ROW]
[ROW][C]43[/C][C]0.005042[/C][C]0.0579[/C][C]0.476945[/C][/ROW]
[ROW][C]44[/C][C]-0.014102[/C][C]-0.162[/C][C]0.435768[/C][/ROW]
[ROW][C]45[/C][C]-0.029007[/C][C]-0.3333[/C][C]0.36973[/C][/ROW]
[ROW][C]46[/C][C]-0.042491[/C][C]-0.4882[/C][C]0.313114[/C][/ROW]
[ROW][C]47[/C][C]-0.054161[/C][C]-0.6223[/C][C]0.26742[/C][/ROW]
[ROW][C]48[/C][C]-0.064294[/C][C]-0.7387[/C][C]0.230705[/C][/ROW]
[/TABLE]
Source: https://freestatistics.org/blog/index.php?pk=76602&T=1

Globally Unique Identifier (entire table): ba.freestatistics.org/blog/index.php?pk=76602&T=1

As an alternative you can also use a QR Code:  

The GUIDs for individual cells are displayed in the table below:

Autocorrelation Function
Time lag kACF(k)T-STATP-value
10.98089811.26970
20.95277510.94650
30.92519210.62970
40.89853310.32340
50.8720810.01940
60.8444169.70160
70.8182689.40120
80.7980169.16850
90.7797918.95910
100.7613818.74760
110.7446698.55560
120.7262028.34340
130.7090858.14680
140.6971578.00970
150.6800257.81290
160.6558367.5350
170.6281147.21650
180.593986.82430
190.5581466.41260
200.5199925.97430
210.4808025.5240
220.4446555.10871e-06
230.4131424.74663e-06
240.3824524.3941.1e-05
250.3515454.03894.5e-05
260.320263.67950.00017
270.2921983.35710.000515
280.2664353.06110.001336
290.242212.78280.00309
300.2187222.51290.006589
310.1988352.28440.011971
320.1788292.05460.020946
330.1608821.84840.033391
340.1472141.69140.046563
350.134531.54560.062294
360.1187551.36440.087384
370.100911.15940.124199
380.0867190.99630.160456
390.0742060.85260.197724
400.0596010.68480.247346
410.0412040.47340.318355
420.0232390.2670.394944
430.0050420.05790.476945
44-0.014102-0.1620.435768
45-0.029007-0.33330.36973
46-0.042491-0.48820.313114
47-0.054161-0.62230.26742
48-0.064294-0.73870.230705


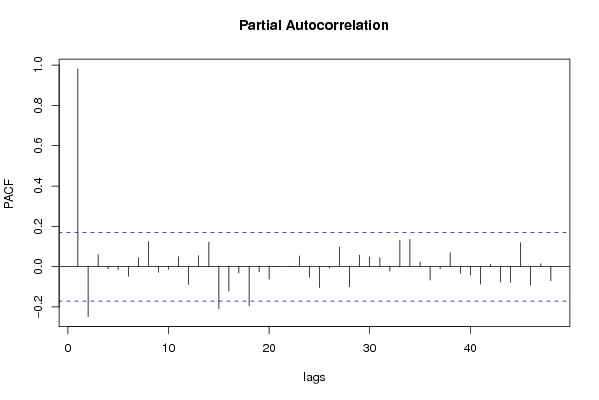
Partial Autocorrelation Function
Time lag kPACF(k)T-STATP-value
10.98089811.26970
2-0.248038-2.84970.002539
30.0593550.68190.248238
4-0.010526-0.12090.451961
5-0.014448-0.1660.434206
6-0.04781-0.54930.291865
70.0453510.5210.301603
80.1243111.42820.077795
9-0.027361-0.31440.376875
10-0.013112-0.15060.440243
110.0495520.56930.285056
12-0.088546-1.01730.155433
130.053860.61880.268555
140.1208951.3890.083589
15-0.208659-2.39730.008958
16-0.120487-1.38430.084302
17-0.031623-0.36330.358473
18-0.19433-2.23270.013627
19-0.025255-0.29020.386075
20-0.062065-0.71310.238529
210.0002940.00340.498653
220.0019280.02220.49118
230.0525270.60350.27361
24-0.051157-0.58770.278854
25-0.103939-1.19420.117277
26-0.006097-0.070.472132
270.0964951.10860.1348
28-0.099772-1.14630.126873
290.0571760.65690.256192
300.0473760.54430.293572
310.0446120.51260.304561
32-0.02144-0.24630.402906
330.130751.50220.067717
340.1346951.54750.062065
350.0231330.26580.395411
36-0.066606-0.76520.222747
37-0.009021-0.10360.458806
380.0692230.79530.213931
39-0.03311-0.38040.352128
40-0.041363-0.47520.317706
41-0.085843-0.98630.162906
420.0115770.1330.447195
43-0.076071-0.8740.191855
44-0.077462-0.890.187551
450.1191591.3690.086657
46-0.090523-1.040.150115
470.0143880.16530.434476
48-0.070509-0.81010.209674

\begin{tabular}{lllllllll}
\hline
Partial Autocorrelation Function \tabularnewline
Time lag k & PACF(k) & T-STAT & P-value \tabularnewline
1 & 0.980898 & 11.2697 & 0 \tabularnewline
2 & -0.248038 & -2.8497 & 0.002539 \tabularnewline
3 & 0.059355 & 0.6819 & 0.248238 \tabularnewline
4 & -0.010526 & -0.1209 & 0.451961 \tabularnewline
5 & -0.014448 & -0.166 & 0.434206 \tabularnewline
6 & -0.04781 & -0.5493 & 0.291865 \tabularnewline
7 & 0.045351 & 0.521 & 0.301603 \tabularnewline
8 & 0.124311 & 1.4282 & 0.077795 \tabularnewline
9 & -0.027361 & -0.3144 & 0.376875 \tabularnewline
10 & -0.013112 & -0.1506 & 0.440243 \tabularnewline
11 & 0.049552 & 0.5693 & 0.285056 \tabularnewline
12 & -0.088546 & -1.0173 & 0.155433 \tabularnewline
13 & 0.05386 & 0.6188 & 0.268555 \tabularnewline
14 & 0.120895 & 1.389 & 0.083589 \tabularnewline
15 & -0.208659 & -2.3973 & 0.008958 \tabularnewline
16 & -0.120487 & -1.3843 & 0.084302 \tabularnewline
17 & -0.031623 & -0.3633 & 0.358473 \tabularnewline
18 & -0.19433 & -2.2327 & 0.013627 \tabularnewline
19 & -0.025255 & -0.2902 & 0.386075 \tabularnewline
20 & -0.062065 & -0.7131 & 0.238529 \tabularnewline
21 & 0.000294 & 0.0034 & 0.498653 \tabularnewline
22 & 0.001928 & 0.0222 & 0.49118 \tabularnewline
23 & 0.052527 & 0.6035 & 0.27361 \tabularnewline
24 & -0.051157 & -0.5877 & 0.278854 \tabularnewline
25 & -0.103939 & -1.1942 & 0.117277 \tabularnewline
26 & -0.006097 & -0.07 & 0.472132 \tabularnewline
27 & 0.096495 & 1.1086 & 0.1348 \tabularnewline
28 & -0.099772 & -1.1463 & 0.126873 \tabularnewline
29 & 0.057176 & 0.6569 & 0.256192 \tabularnewline
30 & 0.047376 & 0.5443 & 0.293572 \tabularnewline
31 & 0.044612 & 0.5126 & 0.304561 \tabularnewline
32 & -0.02144 & -0.2463 & 0.402906 \tabularnewline
33 & 0.13075 & 1.5022 & 0.067717 \tabularnewline
34 & 0.134695 & 1.5475 & 0.062065 \tabularnewline
35 & 0.023133 & 0.2658 & 0.395411 \tabularnewline
36 & -0.066606 & -0.7652 & 0.222747 \tabularnewline
37 & -0.009021 & -0.1036 & 0.458806 \tabularnewline
38 & 0.069223 & 0.7953 & 0.213931 \tabularnewline
39 & -0.03311 & -0.3804 & 0.352128 \tabularnewline
40 & -0.041363 & -0.4752 & 0.317706 \tabularnewline
41 & -0.085843 & -0.9863 & 0.162906 \tabularnewline
42 & 0.011577 & 0.133 & 0.447195 \tabularnewline
43 & -0.076071 & -0.874 & 0.191855 \tabularnewline
44 & -0.077462 & -0.89 & 0.187551 \tabularnewline
45 & 0.119159 & 1.369 & 0.086657 \tabularnewline
46 & -0.090523 & -1.04 & 0.150115 \tabularnewline
47 & 0.014388 & 0.1653 & 0.434476 \tabularnewline
48 & -0.070509 & -0.8101 & 0.209674 \tabularnewline
\hline
\end{tabular}
%Source: https://freestatistics.org/blog/index.php?pk=76602&T=2

[TABLE]
[ROW][C]Partial Autocorrelation Function[/C][/ROW]
[ROW][C]Time lag k[/C][C]PACF(k)[/C][C]T-STAT[/C][C]P-value[/C][/ROW]
[ROW][C]1[/C][C]0.980898[/C][C]11.2697[/C][C]0[/C][/ROW]
[ROW][C]2[/C][C]-0.248038[/C][C]-2.8497[/C][C]0.002539[/C][/ROW]
[ROW][C]3[/C][C]0.059355[/C][C]0.6819[/C][C]0.248238[/C][/ROW]
[ROW][C]4[/C][C]-0.010526[/C][C]-0.1209[/C][C]0.451961[/C][/ROW]
[ROW][C]5[/C][C]-0.014448[/C][C]-0.166[/C][C]0.434206[/C][/ROW]
[ROW][C]6[/C][C]-0.04781[/C][C]-0.5493[/C][C]0.291865[/C][/ROW]
[ROW][C]7[/C][C]0.045351[/C][C]0.521[/C][C]0.301603[/C][/ROW]
[ROW][C]8[/C][C]0.124311[/C][C]1.4282[/C][C]0.077795[/C][/ROW]
[ROW][C]9[/C][C]-0.027361[/C][C]-0.3144[/C][C]0.376875[/C][/ROW]
[ROW][C]10[/C][C]-0.013112[/C][C]-0.1506[/C][C]0.440243[/C][/ROW]
[ROW][C]11[/C][C]0.049552[/C][C]0.5693[/C][C]0.285056[/C][/ROW]
[ROW][C]12[/C][C]-0.088546[/C][C]-1.0173[/C][C]0.155433[/C][/ROW]
[ROW][C]13[/C][C]0.05386[/C][C]0.6188[/C][C]0.268555[/C][/ROW]
[ROW][C]14[/C][C]0.120895[/C][C]1.389[/C][C]0.083589[/C][/ROW]
[ROW][C]15[/C][C]-0.208659[/C][C]-2.3973[/C][C]0.008958[/C][/ROW]
[ROW][C]16[/C][C]-0.120487[/C][C]-1.3843[/C][C]0.084302[/C][/ROW]
[ROW][C]17[/C][C]-0.031623[/C][C]-0.3633[/C][C]0.358473[/C][/ROW]
[ROW][C]18[/C][C]-0.19433[/C][C]-2.2327[/C][C]0.013627[/C][/ROW]
[ROW][C]19[/C][C]-0.025255[/C][C]-0.2902[/C][C]0.386075[/C][/ROW]
[ROW][C]20[/C][C]-0.062065[/C][C]-0.7131[/C][C]0.238529[/C][/ROW]
[ROW][C]21[/C][C]0.000294[/C][C]0.0034[/C][C]0.498653[/C][/ROW]
[ROW][C]22[/C][C]0.001928[/C][C]0.0222[/C][C]0.49118[/C][/ROW]
[ROW][C]23[/C][C]0.052527[/C][C]0.6035[/C][C]0.27361[/C][/ROW]
[ROW][C]24[/C][C]-0.051157[/C][C]-0.5877[/C][C]0.278854[/C][/ROW]
[ROW][C]25[/C][C]-0.103939[/C][C]-1.1942[/C][C]0.117277[/C][/ROW]
[ROW][C]26[/C][C]-0.006097[/C][C]-0.07[/C][C]0.472132[/C][/ROW]
[ROW][C]27[/C][C]0.096495[/C][C]1.1086[/C][C]0.1348[/C][/ROW]
[ROW][C]28[/C][C]-0.099772[/C][C]-1.1463[/C][C]0.126873[/C][/ROW]
[ROW][C]29[/C][C]0.057176[/C][C]0.6569[/C][C]0.256192[/C][/ROW]
[ROW][C]30[/C][C]0.047376[/C][C]0.5443[/C][C]0.293572[/C][/ROW]
[ROW][C]31[/C][C]0.044612[/C][C]0.5126[/C][C]0.304561[/C][/ROW]
[ROW][C]32[/C][C]-0.02144[/C][C]-0.2463[/C][C]0.402906[/C][/ROW]
[ROW][C]33[/C][C]0.13075[/C][C]1.5022[/C][C]0.067717[/C][/ROW]
[ROW][C]34[/C][C]0.134695[/C][C]1.5475[/C][C]0.062065[/C][/ROW]
[ROW][C]35[/C][C]0.023133[/C][C]0.2658[/C][C]0.395411[/C][/ROW]
[ROW][C]36[/C][C]-0.066606[/C][C]-0.7652[/C][C]0.222747[/C][/ROW]
[ROW][C]37[/C][C]-0.009021[/C][C]-0.1036[/C][C]0.458806[/C][/ROW]
[ROW][C]38[/C][C]0.069223[/C][C]0.7953[/C][C]0.213931[/C][/ROW]
[ROW][C]39[/C][C]-0.03311[/C][C]-0.3804[/C][C]0.352128[/C][/ROW]
[ROW][C]40[/C][C]-0.041363[/C][C]-0.4752[/C][C]0.317706[/C][/ROW]
[ROW][C]41[/C][C]-0.085843[/C][C]-0.9863[/C][C]0.162906[/C][/ROW]
[ROW][C]42[/C][C]0.011577[/C][C]0.133[/C][C]0.447195[/C][/ROW]
[ROW][C]43[/C][C]-0.076071[/C][C]-0.874[/C][C]0.191855[/C][/ROW]
[ROW][C]44[/C][C]-0.077462[/C][C]-0.89[/C][C]0.187551[/C][/ROW]
[ROW][C]45[/C][C]0.119159[/C][C]1.369[/C][C]0.086657[/C][/ROW]
[ROW][C]46[/C][C]-0.090523[/C][C]-1.04[/C][C]0.150115[/C][/ROW]
[ROW][C]47[/C][C]0.014388[/C][C]0.1653[/C][C]0.434476[/C][/ROW]
[ROW][C]48[/C][C]-0.070509[/C][C]-0.8101[/C][C]0.209674[/C][/ROW]
[/TABLE]
Source: https://freestatistics.org/blog/index.php?pk=76602&T=2

Globally Unique Identifier (entire table): ba.freestatistics.org/blog/index.php?pk=76602&T=2

As an alternative you can also use a QR Code:  

The GUIDs for individual cells are displayed in the table below:

Partial Autocorrelation Function
Time lag kPACF(k)T-STATP-value
10.98089811.26970
2-0.248038-2.84970.002539
30.0593550.68190.248238
4-0.010526-0.12090.451961
5-0.014448-0.1660.434206
6-0.04781-0.54930.291865
70.0453510.5210.301603
80.1243111.42820.077795
9-0.027361-0.31440.376875
10-0.013112-0.15060.440243
110.0495520.56930.285056
12-0.088546-1.01730.155433
130.053860.61880.268555
140.1208951.3890.083589
15-0.208659-2.39730.008958
16-0.120487-1.38430.084302
17-0.031623-0.36330.358473
18-0.19433-2.23270.013627
19-0.025255-0.29020.386075
20-0.062065-0.71310.238529
210.0002940.00340.498653
220.0019280.02220.49118
230.0525270.60350.27361
24-0.051157-0.58770.278854
25-0.103939-1.19420.117277
26-0.006097-0.070.472132
270.0964951.10860.1348
28-0.099772-1.14630.126873
290.0571760.65690.256192
300.0473760.54430.293572
310.0446120.51260.304561
32-0.02144-0.24630.402906
330.130751.50220.067717
340.1346951.54750.062065
350.0231330.26580.395411
36-0.066606-0.76520.222747
37-0.009021-0.10360.458806
380.0692230.79530.213931
39-0.03311-0.38040.352128
40-0.041363-0.47520.317706
41-0.085843-0.98630.162906
420.0115770.1330.447195
43-0.076071-0.8740.191855
44-0.077462-0.890.187551
450.1191591.3690.086657
46-0.090523-1.040.150115
470.0143880.16530.434476
48-0.070509-0.81010.209674


Parameters (Session):
par1 = Default ; par2 = 1 ; par3 = 1 ; par4 = 0 ; par5 = 12 ; par6 = White Noise ; par7 = 0.95 ;
Parameters (R input):
par1 = 48 ; par2 = 1 ; par3 = 0 ; par4 = 0 ; par5 = 12 ; par6 = White Noise ; par7 = 0.95 ;
R code (references can be found in the software module):
if (par1 == 'Default') {
par1 = 10*log10(length(x))
} else {
par1 <- as.numeric(par1)
}
par2 <- as.numeric(par2)
par3 <- as.numeric(par3)
par4 <- as.numeric(par4)
par5 <- as.numeric(par5)
if (par6 == 'White Noise') par6 <- 'white' else par6 <- 'ma'
par7 <- as.numeric(par7)
if (par2 == 0) {
x <- log(x)
} else {
x <- (x ^ par2 - 1) / par2
}
if (par3 > 0) x <- diff(x,lag=1,difference=par3)
if (par4 > 0) x <- diff(x,lag=par5,difference=par4)
bitmap(file='pic1.png')
racf <- acf(x, par1, main='Autocorrelation', xlab='time lag', ylab='ACF', ci.type=par6, ci=par7, sub=paste('(lambda=',par2,', d=',par3,', D=',par4,', CI=', par7, ', CI type=',par6,')',sep=''))
dev.off()
bitmap(file='pic2.png')
rpacf <- pacf(x,par1,main='Partial Autocorrelation',xlab='lags',ylab='PACF')
dev.off()
(myacf <- c(racf$acf))
(mypacf <- c(rpacf$acf))
lengthx <- length(x)
sqrtn <- sqrt(lengthx)
load(file='createtable')
a<-table.start()
a<-table.row.start(a)
a<-table.element(a,'Autocorrelation Function',4,TRUE)
a<-table.row.end(a)
a<-table.row.start(a)
a<-table.element(a,'Time lag k',header=TRUE)
a<-table.element(a,hyperlink('basics.htm','ACF(k)','click here for more information about the Autocorrelation Function'),header=TRUE)
a<-table.element(a,'T-STAT',header=TRUE)
a<-table.element(a,'P-value',header=TRUE)
a<-table.row.end(a)
for (i in 2:(par1+1)) {
a<-table.row.start(a)
a<-table.element(a,i-1,header=TRUE)
a<-table.element(a,round(myacf[i],6))
mytstat <- myacf[i]*sqrtn
a<-table.element(a,round(mytstat,4))
a<-table.element(a,round(1-pt(abs(mytstat),lengthx),6))
a<-table.row.end(a)
}
a<-table.end(a)
table.save(a,file='mytable.tab')
a<-table.start()
a<-table.row.start(a)
a<-table.element(a,'Partial Autocorrelation Function',4,TRUE)
a<-table.row.end(a)
a<-table.row.start(a)
a<-table.element(a,'Time lag k',header=TRUE)
a<-table.element(a,hyperlink('basics.htm','PACF(k)','click here for more information about the Partial Autocorrelation Function'),header=TRUE)
a<-table.element(a,'T-STAT',header=TRUE)
a<-table.element(a,'P-value',header=TRUE)
a<-table.row.end(a)
for (i in 1:par1) {
a<-table.row.start(a)
a<-table.element(a,i,header=TRUE)
a<-table.element(a,round(mypacf[i],6))
mytstat <- mypacf[i]*sqrtn
a<-table.element(a,round(mytstat,4))
a<-table.element(a,round(1-pt(abs(mytstat),lengthx),6))
a<-table.row.end(a)
}
a<-table.end(a)
table.save(a,file='mytable1.tab')