Free Statistics
of Irreproducible Research!
Description of Statistical Computation | |||||||||||||||||||||||||||||||||||||||||||||||||||||||||||||||||||||||||||||||||||||||||||||||||||||
|---|---|---|---|---|---|---|---|---|---|---|---|---|---|---|---|---|---|---|---|---|---|---|---|---|---|---|---|---|---|---|---|---|---|---|---|---|---|---|---|---|---|---|---|---|---|---|---|---|---|---|---|---|---|---|---|---|---|---|---|---|---|---|---|---|---|---|---|---|---|---|---|---|---|---|---|---|---|---|---|---|---|---|---|---|---|---|---|---|---|---|---|---|---|---|---|---|---|---|---|---|---|
| Author's title | |||||||||||||||||||||||||||||||||||||||||||||||||||||||||||||||||||||||||||||||||||||||||||||||||||||
| Author | *The author of this computation has been verified* | ||||||||||||||||||||||||||||||||||||||||||||||||||||||||||||||||||||||||||||||||||||||||||||||||||||
| R Software Module | rwasp_chi_squared_tests.wasp | ||||||||||||||||||||||||||||||||||||||||||||||||||||||||||||||||||||||||||||||||||||||||||||||||||||
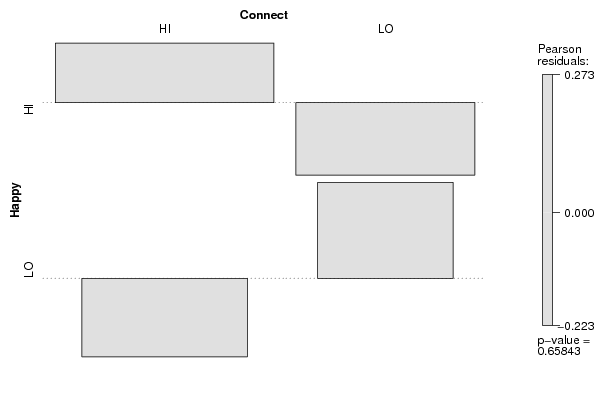
| Title produced by software | Chi-Squared and McNemar Tests | ||||||||||||||||||||||||||||||||||||||||||||||||||||||||||||||||||||||||||||||||||||||||||||||||||||
| Date of computation | Fri, 12 Nov 2010 14:40:27 +0000 | ||||||||||||||||||||||||||||||||||||||||||||||||||||||||||||||||||||||||||||||||||||||||||||||||||||
| Cite this page as follows | Statistical Computations at FreeStatistics.org, Office for Research Development and Education, URL https://freestatistics.org/blog/index.php?v=date/2010/Nov/12/t12895728354kp0n2udy2d0h9h.htm/, Retrieved Thu, 04 Jun 2026 19:20:42 +0000 | ||||||||||||||||||||||||||||||||||||||||||||||||||||||||||||||||||||||||||||||||||||||||||||||||||||
| Statistical Computations at FreeStatistics.org, Office for Research Development and Education, URL https://freestatistics.org/blog/index.php?pk=94167, Retrieved Thu, 04 Jun 2026 19:20:42 +0000 | |||||||||||||||||||||||||||||||||||||||||||||||||||||||||||||||||||||||||||||||||||||||||||||||||||||
| QR Codes: | |||||||||||||||||||||||||||||||||||||||||||||||||||||||||||||||||||||||||||||||||||||||||||||||||||||
|
| |||||||||||||||||||||||||||||||||||||||||||||||||||||||||||||||||||||||||||||||||||||||||||||||||||||
| Original text written by user: | |||||||||||||||||||||||||||||||||||||||||||||||||||||||||||||||||||||||||||||||||||||||||||||||||||||
| IsPrivate? | No (this computation is public) | ||||||||||||||||||||||||||||||||||||||||||||||||||||||||||||||||||||||||||||||||||||||||||||||||||||
| User-defined keywords | |||||||||||||||||||||||||||||||||||||||||||||||||||||||||||||||||||||||||||||||||||||||||||||||||||||
| Estimated Impact | 619 | ||||||||||||||||||||||||||||||||||||||||||||||||||||||||||||||||||||||||||||||||||||||||||||||||||||
Tree of Dependent Computations | |||||||||||||||||||||||||||||||||||||||||||||||||||||||||||||||||||||||||||||||||||||||||||||||||||||
| Family? (F = Feedback message, R = changed R code, M = changed R Module, P = changed Parameters, D = changed Data) | |||||||||||||||||||||||||||||||||||||||||||||||||||||||||||||||||||||||||||||||||||||||||||||||||||||
| - [Chi-Squared and McNemar Tests] [Workshop 6, CHI S...] [2010-11-12 14:40:27] [23a9b79f355c69a75648521a893cf584] [Current] - R D [Chi-Squared Test, McNemar Test, and Fisher Exact Test] [Chi-Squared Test ...] [2011-11-11 10:36:50] [ea9976aa04c7322b215e949114660791] - R PD [Chi-Squared Test, McNemar Test, and Fisher Exact Test] [Chi-Squared Test ...] [2011-11-11 10:41:40] [ea9976aa04c7322b215e949114660791] - P [Chi-Squared Test, McNemar Test, and Fisher Exact Test] [Chi-Squared Test ...] [2011-11-11 10:43:28] [ea9976aa04c7322b215e949114660791] - P [Chi-Squared Test, McNemar Test, and Fisher Exact Test] [Chi-Squared Test ...] [2011-11-11 10:44:50] [ea9976aa04c7322b215e949114660791] - P [Chi-Squared Test, McNemar Test, and Fisher Exact Test] [Chi-Squared Test ...] [2011-11-11 10:45:49] [ea9976aa04c7322b215e949114660791] - P [Chi-Squared Test, McNemar Test, and Fisher Exact Test] [Chi-Squared Test ...] [2011-11-11 10:47:03] [ea9976aa04c7322b215e949114660791] - R [Chi-Squared Test, McNemar Test, and Fisher Exact Test] [WS 6 Chi Squared ...] [2011-11-12 19:01:27] [d0cddc92c01af61bef0226b9e5ade9b3] - R [Chi-Squared Test, McNemar Test, and Fisher Exact Test] [] [2011-11-13 14:34:33] [74be16979710d4c4e7c6647856088456] - R [Chi-Squared Test, McNemar Test, and Fisher Exact Test] [Vraag 1 Happiness...] [2011-11-14 18:31:44] [c505444e07acba7694d29053ca5d114e] - R D [Chi-Squared Test, McNemar Test, and Fisher Exact Test] [Happiness - Conne...] [2011-11-14 19:01:17] [147523945ddfd9cf10d509b57b5cab55] - R D [Chi-Squared Test, McNemar Test, and Fisher Exact Test] [workshop 6,2] [2011-11-15 17:20:51] [aa7c7608f809e956d7797134ec926e04] - R [Chi-Squared Test, McNemar Test, and Fisher Exact Test] [Ws6 Hap/Con] [2012-11-06 13:17:13] [03ae93331854485753573ecb477807ae] | |||||||||||||||||||||||||||||||||||||||||||||||||||||||||||||||||||||||||||||||||||||||||||||||||||||
| Feedback Forum | |||||||||||||||||||||||||||||||||||||||||||||||||||||||||||||||||||||||||||||||||||||||||||||||||||||
Post a new message | |||||||||||||||||||||||||||||||||||||||||||||||||||||||||||||||||||||||||||||||||||||||||||||||||||||
Dataset | |||||||||||||||||||||||||||||||||||||||||||||||||||||||||||||||||||||||||||||||||||||||||||||||||||||
| Dataseries X: | |||||||||||||||||||||||||||||||||||||||||||||||||||||||||||||||||||||||||||||||||||||||||||||||||||||
'HI' 'HI' 'HI' 'HI' 'LO' 'LO' 'LO' 'LO' 'HI' 'HI' 'HI' 'HI' 'HI' 'HI' 'HI' 'HI' 'HI' 'HI' 'HI' 'HI' 'HI' 'HI' 'HI' 'HI' 'LO' 'HI' 'HI' 'HI' 'HI' 'LO' 'HI' 'LO' 'HI' 'HI' 'HI' 'HI' 'HI' 'HI' 'HI' 'LO' 'HI' 'LO' 'LO' 'LO' 'HI' 'HI' 'LO' 'HI' 'HI' 'HI' 'LO' 'HI' 'HI' 'HI' 'HI' 'LO' 'HI' 'LO' 'LO' 'HI' 'HI' 'LO' 'LO' 'LO' 'HI' 'HI' 'HI' 'HI' 'HI' 'HI' 'HI' 'LO' 'LO' 'LO' 'HI' 'HI' 'HI' 'LO' 'LO' 'HI' 'HI' 'HI' 'HI' 'HI' 'HI' 'HI' 'LO' 'HI' 'LO' 'HI' 'LO' 'HI' 'HI' 'HI' 'HI' 'LO' 'HI' 'HI' 'LO' 'HI' 'HI' 'LO' 'HI' 'LO' 'LO' 'LO' 'LO' 'HI' 'LO' 'LO' 'HI' 'HI' 'HI' 'HI' 'HI' 'LO' 'LO' 'HI' 'LO' 'HI' 'LO' 'LO' 'LO' 'HI' 'LO' 'HI' 'HI' 'LO' 'HI' 'HI' 'LO' 'HI' 'LO' 'HI' 'LO' 'LO' 'HI' 'HI' 'HI' 'HI' 'HI' 'HI' 'HI' 'LO' 'HI' 'HI' 'HI' 'HI' 'LO' 'HI' 'LO' 'HI' 'HI' 'HI' 'LO' 'HI' 'HI' 'LO' 'LO' 'HI' 'HI' 'LO' 'HI' 'HI' 'HI' 'HI' 'HI' 'HI' 'HI' 'LO' 'HI' 'LO' 'HI' 'HI' 'HI' 'LO' 'LO' 'LO' 'LO' 'LO' 'HI' 'LO' 'LO' 'HI' 'HI' 'HI' 'HI' 'LO' 'LO' 'LO' 'HI' 'HI' 'LO' 'HI' 'HI' 'HI' 'HI' 'HI' 'HI' 'LO' 'HI' 'HI' 'LO' 'HI' 'HI' 'HI' 'LO' 'LO' 'HI' 'LO' 'LO' 'HI' 'HI' 'HI' 'HI' 'HI' 'LO' 'HI' 'LO' 'HI' 'HI' 'LO' 'LO' 'LO' 'LO' 'LO' 'HI' 'LO' 'HI' 'HI' 'HI' 'HI' 'HI' 'LO' 'HI' 'HI' 'HI' 'LO' 'HI' 'HI' 'LO' 'LO' 'HI' 'LO' 'HI' 'HI' 'HI' 'HI' 'HI' 'LO' 'LO' 'LO' 'HI' 'HI' 'HI' 'HI' 'HI' 'LO' 'HI' 'HI' 'LO' 'LO' 'LO' 'LO' 'HI' 'HI' 'HI' 'LO' 'HI' 'HI' 'HI' 'LO' 'LO' 'LO' 'HI' 'HI' 'LO' 'LO' 'HI' 'HI' 'LO' 'LO' 'HI' 'LO' 'HI' 'LO' 'HI' 'LO' 'HI' 'LO' 'HI' 'HI' 'HI' 'LO' 'LO' 'HI' 'LO' 'LO' 'LO' 'HI' 'HI' 'HI' 'LO' 'HI' 'HI' 'HI' 'LO' 'HI' 'LO' 'HI' 'LO' 'LO' 'LO' 'HI' 'HI' 'LO' 'HI' 'LO' 'LO' 'HI' 'LO' 'LO' 'LO' 'HI' | |||||||||||||||||||||||||||||||||||||||||||||||||||||||||||||||||||||||||||||||||||||||||||||||||||||
Tables (Output of Computation) | |||||||||||||||||||||||||||||||||||||||||||||||||||||||||||||||||||||||||||||||||||||||||||||||||||||
| |||||||||||||||||||||||||||||||||||||||||||||||||||||||||||||||||||||||||||||||||||||||||||||||||||||
Figures (Output of Computation) | |||||||||||||||||||||||||||||||||||||||||||||||||||||||||||||||||||||||||||||||||||||||||||||||||||||
Input Parameters & R Code | |||||||||||||||||||||||||||||||||||||||||||||||||||||||||||||||||||||||||||||||||||||||||||||||||||||
| Parameters (Session): | |||||||||||||||||||||||||||||||||||||||||||||||||||||||||||||||||||||||||||||||||||||||||||||||||||||
| par1 = 1 ; par2 = 2 ; par3 = Pearson Chi-Squared ; | |||||||||||||||||||||||||||||||||||||||||||||||||||||||||||||||||||||||||||||||||||||||||||||||||||||
| Parameters (R input): | |||||||||||||||||||||||||||||||||||||||||||||||||||||||||||||||||||||||||||||||||||||||||||||||||||||
| par1 = 1 ; par2 = 2 ; par3 = Pearson Chi-Squared ; | |||||||||||||||||||||||||||||||||||||||||||||||||||||||||||||||||||||||||||||||||||||||||||||||||||||
| R code (references can be found in the software module): | |||||||||||||||||||||||||||||||||||||||||||||||||||||||||||||||||||||||||||||||||||||||||||||||||||||
library(vcd) | |||||||||||||||||||||||||||||||||||||||||||||||||||||||||||||||||||||||||||||||||||||||||||||||||||||