Free Statistics
of Irreproducible Research!
Description of Statistical Computation | |||||||||||||||||||||||||||||||||||||||||||||||||||||||||||||
|---|---|---|---|---|---|---|---|---|---|---|---|---|---|---|---|---|---|---|---|---|---|---|---|---|---|---|---|---|---|---|---|---|---|---|---|---|---|---|---|---|---|---|---|---|---|---|---|---|---|---|---|---|---|---|---|---|---|---|---|---|---|
| Author's title | |||||||||||||||||||||||||||||||||||||||||||||||||||||||||||||
| Author | *The author of this computation has been verified* | ||||||||||||||||||||||||||||||||||||||||||||||||||||||||||||
| R Software Module | rwasp_linear_regression.wasp | ||||||||||||||||||||||||||||||||||||||||||||||||||||||||||||
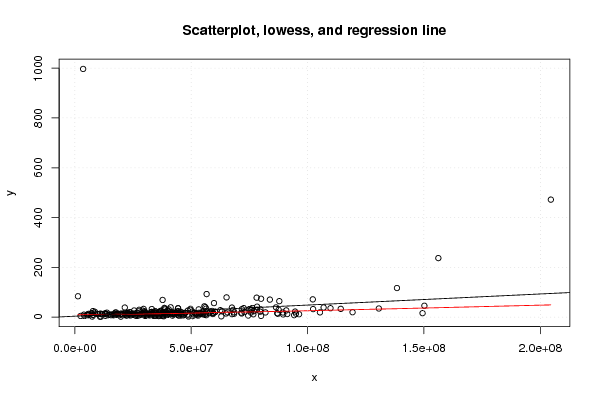
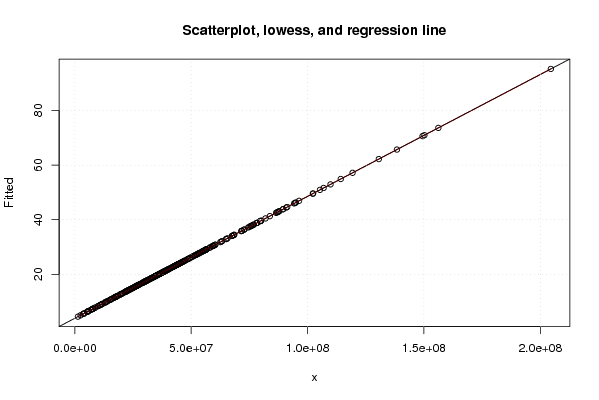
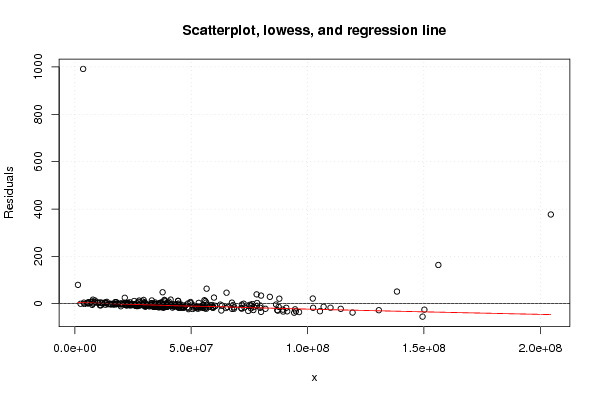
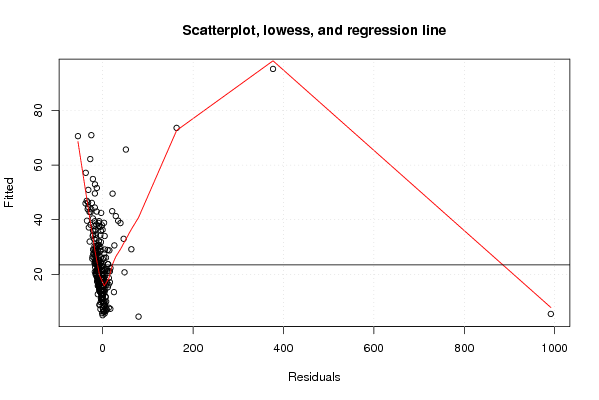
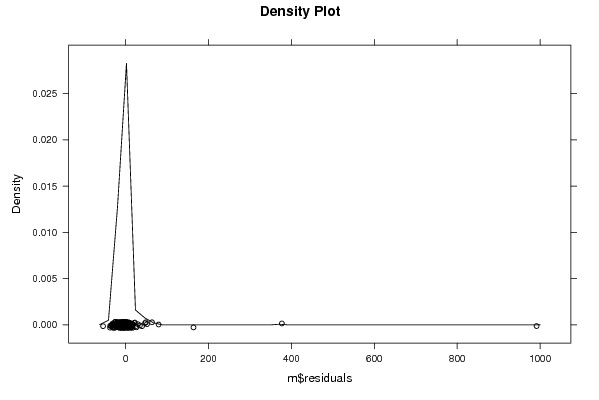
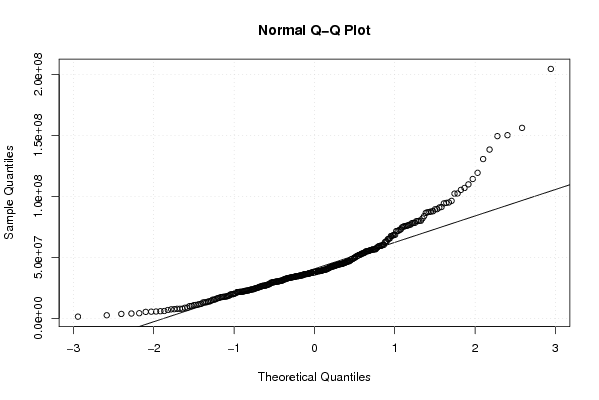
| Title produced by software | Linear Regression Graphical Model Validation | ||||||||||||||||||||||||||||||||||||||||||||||||||||||||||||
| Date of computation | Fri, 26 Nov 2010 14:52:17 +0000 | ||||||||||||||||||||||||||||||||||||||||||||||||||||||||||||
| Cite this page as follows | Statistical Computations at FreeStatistics.org, Office for Research Development and Education, URL https://freestatistics.org/blog/index.php?v=date/2010/Nov/26/t1290783066wxdangw65jxiqb5.htm/, Retrieved Sun, 09 Nov 2025 03:46:32 +0000 | ||||||||||||||||||||||||||||||||||||||||||||||||||||||||||||
| Statistical Computations at FreeStatistics.org, Office for Research Development and Education, URL https://freestatistics.org/blog/index.php?pk=101955, Retrieved Sun, 09 Nov 2025 03:46:32 +0000 | |||||||||||||||||||||||||||||||||||||||||||||||||||||||||||||
| QR Codes: | |||||||||||||||||||||||||||||||||||||||||||||||||||||||||||||
|
| |||||||||||||||||||||||||||||||||||||||||||||||||||||||||||||
| Original text written by user: | |||||||||||||||||||||||||||||||||||||||||||||||||||||||||||||
| IsPrivate? | No (this computation is public) | ||||||||||||||||||||||||||||||||||||||||||||||||||||||||||||
| User-defined keywords | |||||||||||||||||||||||||||||||||||||||||||||||||||||||||||||
| Estimated Impact | 307 | ||||||||||||||||||||||||||||||||||||||||||||||||||||||||||||
Tree of Dependent Computations | |||||||||||||||||||||||||||||||||||||||||||||||||||||||||||||
| Family? (F = Feedback message, R = changed R code, M = changed R Module, P = changed Parameters, D = changed Data) | |||||||||||||||||||||||||||||||||||||||||||||||||||||||||||||
| - [Linear Regression Graphical Model Validation] [Colombia Coffee -...] [2008-02-26 10:22:06] [74be16979710d4c4e7c6647856088456] - M D [Linear Regression Graphical Model Validation] [] [2010-11-25 11:12:40] [e71d94d32f847f62b540eebe6fadd003] - D [Linear Regression Graphical Model Validation] [] [2010-11-26 14:52:17] [c8b0d20ebafa6d61ca10522fa626ae82] [Current] | |||||||||||||||||||||||||||||||||||||||||||||||||||||||||||||
| Feedback Forum | |||||||||||||||||||||||||||||||||||||||||||||||||||||||||||||
Post a new message | |||||||||||||||||||||||||||||||||||||||||||||||||||||||||||||
Dataset | |||||||||||||||||||||||||||||||||||||||||||||||||||||||||||||
| Dataseries X: | |||||||||||||||||||||||||||||||||||||||||||||||||||||||||||||
10926126 204514194 20655116 7365385 3918657 38494822 90838469 8652220 47482511 5438191 5986958 59447386 37113055 23669000 5572851 7784176 5270786 43583746 19903814 7799064 35989363 29552113 21506498 7859684 13006528 89426565 40100910 38650820 17818636 51985948 24571878 29266469 45758250 22712439 86459749 49703065 65187751 39091325 34955804 33411147 15575837 36116313 27405375 55382004 7478767 72881801 37479848 27030251 109851111 28356456 48560722 23550558 52319234 105318425 17345510 71519979 59398481 36287185 44559709 114256076 23174724 38795625 94992548 48389051 46785833 56063795 27622103 11848002 55125816 42484133 49639784 30006747 19776143 41176416 34933018 39696259 38610419 44404281 44628459 20428394 33494104 15246622 10078039 36293305 11594321 34818494 36718379 19690322 44432615 36047082 40379563 23458900 24477773 21472076 27623825 42834376 21692408 2490957 5804447 4149313 22772412 8743945 6818743 30796414 17697315 62514975 17618542 37171201 29747133 39734547 18636718 30751381 58198919 35172258 30568494 32732200 33931175 38495426 39639276 18386312 49064295 34517203 54053990 56632146 46131933 31138610 37573144 32922160 71766977 21574297 46733768 36375026 50499581 44157910 26780541 71675809 17411180 138402202 89520475 53764838 79645460 45232765 60335913 48862499 56443228 149401818 55893936 39185258 54999796 62938759 130610415 3578335 119330610 43612479 67573324 94235304 52529046 38148241 41788652 21748127 16815679 29140007 80020386 10008346 13150180 33070836 44343752 38761463 63242438 10776650 13079087 42254065 45334695 75653353 37723883 35383003 42169175 37836247 16157265 25483137 24758200 25931415 35341058 59793935 46240034 25935511 29348057 16621841 34421545 30201523 68504357 21760376 68420735 34576094 80009790 23896896 43959624 31004430 96339703 78115427 13773684 79714473 30300608 47400000 29685182 72574056 26667187 56654962 34032684 37819725 25253403 55674674 40214078 32066001 26916456 31925699 36677072 22865662 33057141 87224667 30046064 33705054 94643577 74500253 13705457 81920371 75534971 17984250 26564680 75039636 31345912 156181130 37274013 60344095 19480849 15213215 36646854 37800225 35192619 51894705 43116866 14343902 21908691 34532932 38781483 32523543 46755676 68059999 34481666 23934252 56464201 30381482 41957576 11196762 26125759 45626240 33816982 150181287 33424206 67497380 54983068 83797137 44798290 39918703 22068324 78296142 41187726 87854574 56492262 36294788 102238796 42832378 22490585 53384345 22461067 24979034 106897458 51351879 39339354 32067212 32690247 53227096 59342371 64960155 54764596 102374548 76913992 42777761 40847167 86951363 43659732 76698629 78268805 91261974 65606487 28139063 75895280 51122832 53066011 1354614 30021100 33899609 58995770 57876331 87561067 26724300 76278583 50626962 | |||||||||||||||||||||||||||||||||||||||||||||||||||||||||||||
| Dataseries Y: | |||||||||||||||||||||||||||||||||||||||||||||||||||||||||||||
14.267 472.071 12.335 16.434 10.132 37.190 27.169 21.389 17.416 9.862 8.326 17.578 26.242 20.290 8.089 24.421 9.155 18.061 14.693 8.034 19.516 33.256 17.737 8.886 12.187 18.837 12.341 21.003 18.421 14.225 10.730 14.558 20.347 16.235 39.199 33.492 79.503 21.210 15.907 16.399 7.887 19.976 23.664 12.518 2.385 20.643 16.756 8.932 36.014 10.815 26.268 8.534 14.107 19.193 9.594 18.053 15.805 9.578 8.321 33.400 11.547 12.677 14.138 10.545 10.982 40.070 7.399 10.250 23.433 15.080 29.558 23.587 2.093 39.654 8.285 8.931 34.526 35.350 6.566 10.244 11.090 8.969 12.206 17.525 12.953 18.466 15.110 12.575 24.394 4.401 31.119 11.201 14.781 38.557 29.500 21.700 10.934 4.893 13.080 4.721 18.021 14.916 13.534 8.747 12.229 28.129 9.647 5.915 9.435 9.280 11.673 7.538 23.025 5.837 13.894 19.563 6.356 9.460 9.300 12.637 7.587 18.662 15.058 92.704 13.784 10.937 15.290 20.969 32.207 14.050 8.048 7.049 22.317 10.219 5.246 14.806 18.450 117.073 10.875 13.675 22.111 19.755 22.060 2.768 34.026 15.998 9.307 8.342 12.019 3.346 34.812 997 19.837 17.775 12.092 8.167 7.792 3.672 14.116 9.597 11.283 26.328 73.941 12.649 5.467 32.450 35.963 30.930 23.898 2.050 15.578 11.384 13.574 18.378 69.175 8.955 12.243 9.928 10.620 26.781 9.371 8.489 10.840 56.547 11.040 8.223 11.031 7.502 6.586 5.128 19.474 9.093 13.461 9.086 4.963 10.285 21.515 11.062 11.748 78.271 17.937 31.667 17.528 16.999 17.473 36.219 9.534 24.660 19.201 14.452 13.973 43.618 23.547 11.851 17.651 10.312 23.414 11.063 20.457 13.637 19.825 6.171 22.397 6.592 12.242 19.028 28.799 10.251 17.451 32.545 12.226 237.250 7.999 20.734 9.418 10.710 22.705 5.942 11.080 11.431 13.241 8.251 7.776 7.026 8.033 14.713 8.148 29.050 24.639 6.953 13.881 6.382 6.135 2.073 6.475 6.446 7.919 45.887 15.489 38.489 18.387 70.450 17.096 27.285 7.605 41.984 18.001 64.294 7.966 8.812 71.543 11.958 14.636 14.007 6.707 9.807 38.828 17.228 20.306 6.985 9.974 31.278 12.561 14.774 12.118 32.424 24.139 16.247 13.719 15.996 13.898 11.612 29.993 12.664 19.296 11.153 30.384 10.339 6.898 84 9.412 8.151 24.935 16.145 29.859 7.102 36.661 4.207 | |||||||||||||||||||||||||||||||||||||||||||||||||||||||||||||
Tables (Output of Computation) | |||||||||||||||||||||||||||||||||||||||||||||||||||||||||||||
| |||||||||||||||||||||||||||||||||||||||||||||||||||||||||||||
Figures (Output of Computation) | |||||||||||||||||||||||||||||||||||||||||||||||||||||||||||||
Input Parameters & R Code | |||||||||||||||||||||||||||||||||||||||||||||||||||||||||||||
| Parameters (Session): | |||||||||||||||||||||||||||||||||||||||||||||||||||||||||||||
| par1 = 0 ; | |||||||||||||||||||||||||||||||||||||||||||||||||||||||||||||
| Parameters (R input): | |||||||||||||||||||||||||||||||||||||||||||||||||||||||||||||
| par1 = 0 ; | |||||||||||||||||||||||||||||||||||||||||||||||||||||||||||||
| R code (references can be found in the software module): | |||||||||||||||||||||||||||||||||||||||||||||||||||||||||||||
par1 <- as.numeric(par1) | |||||||||||||||||||||||||||||||||||||||||||||||||||||||||||||