of Irreproducible Research!
Description of Statistical Computation | |||||||||||||||||||||||||||||||||||||||||||||||||||||||||||||||||||||||||||||||||||||||||||||||||||||
---|---|---|---|---|---|---|---|---|---|---|---|---|---|---|---|---|---|---|---|---|---|---|---|---|---|---|---|---|---|---|---|---|---|---|---|---|---|---|---|---|---|---|---|---|---|---|---|---|---|---|---|---|---|---|---|---|---|---|---|---|---|---|---|---|---|---|---|---|---|---|---|---|---|---|---|---|---|---|---|---|---|---|---|---|---|---|---|---|---|---|---|---|---|---|---|---|---|---|---|---|---|
Author's title | |||||||||||||||||||||||||||||||||||||||||||||||||||||||||||||||||||||||||||||||||||||||||||||||||||||
Author | *The author of this computation has been verified* | ||||||||||||||||||||||||||||||||||||||||||||||||||||||||||||||||||||||||||||||||||||||||||||||||||||
R Software Module | rwasp_chi_squared_tests.wasp | ||||||||||||||||||||||||||||||||||||||||||||||||||||||||||||||||||||||||||||||||||||||||||||||||||||
Title produced by software | Chi-Squared and McNemar Tests | ||||||||||||||||||||||||||||||||||||||||||||||||||||||||||||||||||||||||||||||||||||||||||||||||||||
Date of computation | Mon, 29 Nov 2010 20:04:52 +0000 | ||||||||||||||||||||||||||||||||||||||||||||||||||||||||||||||||||||||||||||||||||||||||||||||||||||
Cite this page as follows | Statistical Computations at FreeStatistics.org, Office for Research Development and Education, URL https://freestatistics.org/blog/index.php?v=date/2010/Nov/29/t1291060992t3baavhboit4vec.htm/, Retrieved Wed, 13 Aug 2025 23:52:23 +0000 | ||||||||||||||||||||||||||||||||||||||||||||||||||||||||||||||||||||||||||||||||||||||||||||||||||||
Statistical Computations at FreeStatistics.org, Office for Research Development and Education, URL https://freestatistics.org/blog/index.php?pk=103071, Retrieved Wed, 13 Aug 2025 23:52:23 +0000 | |||||||||||||||||||||||||||||||||||||||||||||||||||||||||||||||||||||||||||||||||||||||||||||||||||||
QR Codes: | |||||||||||||||||||||||||||||||||||||||||||||||||||||||||||||||||||||||||||||||||||||||||||||||||||||
|
|||||||||||||||||||||||||||||||||||||||||||||||||||||||||||||||||||||||||||||||||||||||||||||||||||||
Original text written by user: | |||||||||||||||||||||||||||||||||||||||||||||||||||||||||||||||||||||||||||||||||||||||||||||||||||||
IsPrivate? | No (this computation is public) | ||||||||||||||||||||||||||||||||||||||||||||||||||||||||||||||||||||||||||||||||||||||||||||||||||||
User-defined keywords | |||||||||||||||||||||||||||||||||||||||||||||||||||||||||||||||||||||||||||||||||||||||||||||||||||||
Estimated Impact | 271 | ||||||||||||||||||||||||||||||||||||||||||||||||||||||||||||||||||||||||||||||||||||||||||||||||||||
Tree of Dependent Computations | |||||||||||||||||||||||||||||||||||||||||||||||||||||||||||||||||||||||||||||||||||||||||||||||||||||
Family? (F = Feedback message, R = changed R code, M = changed R Module, P = changed Parameters, D = changed Data) | |||||||||||||||||||||||||||||||||||||||||||||||||||||||||||||||||||||||||||||||||||||||||||||||||||||
- [Chi-Squared and McNemar Tests] [] [2010-11-16 14:33:59] [b98453cac15ba1066b407e146608df68] - PD [Chi-Squared and McNemar Tests] [verband tussen "o...] [2010-11-27 12:48:56] [f730b099f190102bcd41f590a8dae16d] - PD [Chi-Squared and McNemar Tests] [popularity and cr...] [2010-11-29 20:04:52] [6ff6d3268c67efbfcd6d6506b34b66fb] [Current] | |||||||||||||||||||||||||||||||||||||||||||||||||||||||||||||||||||||||||||||||||||||||||||||||||||||
Feedback Forum | |||||||||||||||||||||||||||||||||||||||||||||||||||||||||||||||||||||||||||||||||||||||||||||||||||||
Post a new message | |||||||||||||||||||||||||||||||||||||||||||||||||||||||||||||||||||||||||||||||||||||||||||||||||||||
Dataset | |||||||||||||||||||||||||||||||||||||||||||||||||||||||||||||||||||||||||||||||||||||||||||||||||||||
Dataseries X: | |||||||||||||||||||||||||||||||||||||||||||||||||||||||||||||||||||||||||||||||||||||||||||||||||||||
1 1 1 1 2 1 1 2 1 1 1 1 2 2 1 1 1 1 1 1 1 2 1 1 2 1 1 2 1 1 1 2 1 2 2 2 1 1 1 1 2 2 1 1 1 1 2 1 2 1 1 1 1 1 1 1 2 1 1 1 1 2 1 2 1 2 2 1 1 2 1 1 1 1 2 1 2 1 2 1 1 1 1 2 1 1 2 1 2 1 1 1 1 1 1 1 1 1 1 1 1 1 1 1 2 2 1 2 1 2 2 1 1 1 2 2 1 1 2 2 2 1 2 1 1 1 2 2 1 2 1 1 2 1 1 1 2 1 1 1 1 1 1 1 1 1 1 2 1 1 1 1 2 1 1 1 1 1 2 2 2 2 1 1 1 1 1 2 1 1 1 1 2 2 1 2 2 2 1 2 2 1 2 2 1 1 1 2 1 1 1 1 1 2 1 2 2 2 2 1 2 2 1 1 1 1 2 2 1 1 1 1 1 2 1 1 1 2 1 2 2 1 2 1 2 1 2 1 1 1 2 1 2 1 1 2 2 1 1 2 1 1 2 1 1 2 2 2 1 1 1 2 1 2 2 1 2 1 1 1 1 1 2 1 1 2 2 1 1 2 2 1 1 1 1 1 1 1 2 1 1 2 1 1 1 1 1 1 1 1 2 2 2 1 1 1 1 1 2 2 2 2 1 1 | |||||||||||||||||||||||||||||||||||||||||||||||||||||||||||||||||||||||||||||||||||||||||||||||||||||
Tables (Output of Computation) | |||||||||||||||||||||||||||||||||||||||||||||||||||||||||||||||||||||||||||||||||||||||||||||||||||||
\begin{tabular}{lllllllll} \hline Summary of computational transaction \tabularnewline Raw Input & view raw input (R code) \tabularnewline Raw Output & view raw output of R engine \tabularnewline Computing time & 2 seconds \tabularnewline R Server & 'George Udny Yule' @ 72.249.76.132 \tabularnewline \hline \end{tabular} %Source: https://freestatistics.org/blog/index.php?pk=103071&T=0 [TABLE] [ROW][C]Summary of computational transaction[/C][/ROW] [ROW][C]Raw Input[/C][C]view raw input (R code) [/C][/ROW] [ROW][C]Raw Output[/C][C]view raw output of R engine [/C][/ROW] [ROW][C]Computing time[/C][C]2 seconds[/C][/ROW] [ROW][C]R Server[/C][C]'George Udny Yule' @ 72.249.76.132[/C][/ROW] [/TABLE] Source: https://freestatistics.org/blog/index.php?pk=103071&T=0
Globally Unique Identifier (entire table): ba.freestatistics.org/blog/index.php?pk=103071&T=0
As an alternative you can also use a QR Code: The GUIDs for individual cells are displayed in the table below:
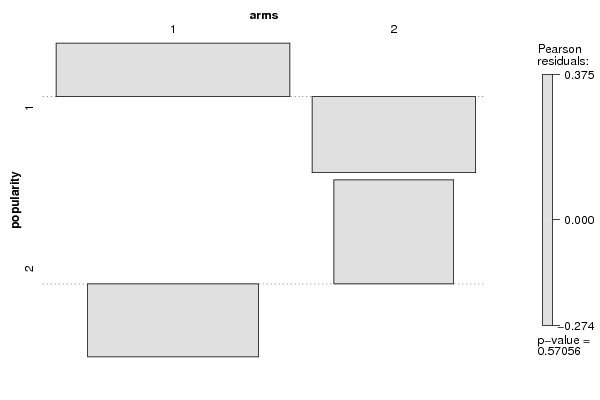
\begin{tabular}{lllllllll} \hline Tabulation of Results \tabularnewline popularity x arms \tabularnewline & 1 & 2 \tabularnewline 1 & 68 & 31 \tabularnewline 2 & 34 & 19 \tabularnewline \hline \end{tabular} %Source: https://freestatistics.org/blog/index.php?pk=103071&T=1 [TABLE] [ROW][C]Tabulation of Results[/C][/ROW] [ROW][C]popularity x arms[/C][/ROW] [ROW][C] [/C][C]1[/C][C]2[/C][/ROW] [C]1[/C][C]68[/C][C]31[/C][/ROW] [C]2[/C][C]34[/C][C]19[/C][/ROW] [/TABLE] Source: https://freestatistics.org/blog/index.php?pk=103071&T=1
Globally Unique Identifier (entire table): ba.freestatistics.org/blog/index.php?pk=103071&T=1
As an alternative you can also use a QR Code: The GUIDs for individual cells are displayed in the table below:
\begin{tabular}{lllllllll} \hline Tabulation of Expected Results \tabularnewline popularity x arms \tabularnewline & 1 & 2 \tabularnewline 1 & 66.43 & 32.57 \tabularnewline 2 & 35.57 & 17.43 \tabularnewline \hline \end{tabular} %Source: https://freestatistics.org/blog/index.php?pk=103071&T=2 [TABLE] [ROW][C]Tabulation of Expected Results[/C][/ROW] [ROW][C]popularity x arms[/C][/ROW] [ROW][C] [/C][C]1[/C][C]2[/C][/ROW] [C]1[/C][C]66.43[/C][C]32.57[/C][/ROW] [C]2[/C][C]35.57[/C][C]17.43[/C][/ROW] [/TABLE] Source: https://freestatistics.org/blog/index.php?pk=103071&T=2
Globally Unique Identifier (entire table): ba.freestatistics.org/blog/index.php?pk=103071&T=2
As an alternative you can also use a QR Code: The GUIDs for individual cells are displayed in the table below:
\begin{tabular}{lllllllll} \hline Statistical Results \tabularnewline Pearson's Chi-squared test with Yates' continuity correction \tabularnewline Chi Square Statistic & 0.15 \tabularnewline Degrees of Freedom & 1 \tabularnewline P value & 0.7 \tabularnewline \hline \end{tabular} %Source: https://freestatistics.org/blog/index.php?pk=103071&T=3 [TABLE] [ROW][C]Statistical Results[/C][/ROW] [ROW][C]Pearson's Chi-squared test with Yates' continuity correction[/C][/ROW] [ROW][C]Chi Square Statistic[/C][C]0.15[/C][/ROW] [ROW][C]Degrees of Freedom[/C][C]1[/C][/ROW] [ROW][C]P value[/C][C]0.7[/C][/ROW] [/TABLE] Source: https://freestatistics.org/blog/index.php?pk=103071&T=3
Globally Unique Identifier (entire table): ba.freestatistics.org/blog/index.php?pk=103071&T=3
As an alternative you can also use a QR Code: The GUIDs for individual cells are displayed in the table below:
| |||||||||||||||||||||||||||||||||||||||||||||||||||||||||||||||||||||||||||||||||||||||||||||||||||||
Figures (Output of Computation) | |||||||||||||||||||||||||||||||||||||||||||||||||||||||||||||||||||||||||||||||||||||||||||||||||||||
Input Parameters & R Code | |||||||||||||||||||||||||||||||||||||||||||||||||||||||||||||||||||||||||||||||||||||||||||||||||||||
Parameters (Session): | |||||||||||||||||||||||||||||||||||||||||||||||||||||||||||||||||||||||||||||||||||||||||||||||||||||
par1 = 1 ; par2 = 2 ; par3 = Pearson Chi-Squared ; | |||||||||||||||||||||||||||||||||||||||||||||||||||||||||||||||||||||||||||||||||||||||||||||||||||||
Parameters (R input): | |||||||||||||||||||||||||||||||||||||||||||||||||||||||||||||||||||||||||||||||||||||||||||||||||||||
par1 = 1 ; par2 = 2 ; par3 = Pearson Chi-Squared ; | |||||||||||||||||||||||||||||||||||||||||||||||||||||||||||||||||||||||||||||||||||||||||||||||||||||
R code (references can be found in the software module): | |||||||||||||||||||||||||||||||||||||||||||||||||||||||||||||||||||||||||||||||||||||||||||||||||||||
library(vcd) |