Free Statistics

of Irreproducible Research!

Author's title

Author*Unverified author*
R Software Modulerwasp_smp.wasp
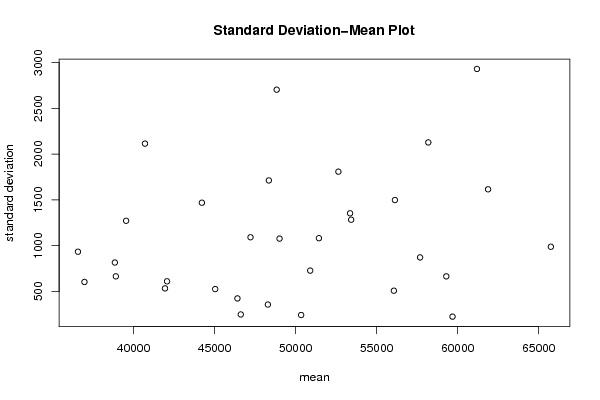
Title produced by softwareStandard Deviation-Mean Plot
Date of computationSun, 16 Jan 2011 13:10:31 +0000
Cite this page as followsStatistical Computations at FreeStatistics.org, Office for Research Development and Education, URL https://freestatistics.org/blog/index.php?v=date/2011/Jan/16/t1295183294sd095cbti6b8khg.htm/, Retrieved Thu, 31 Oct 2024 23:54:48 +0000
Statistical Computations at FreeStatistics.org, Office for Research Development and Education, URL https://freestatistics.org/blog/index.php?pk=117395, Retrieved Thu, 31 Oct 2024 23:54:48 +0000
QR Codes:

Original text written by user:
IsPrivate?No (this computation is public)
User-defined keywords KDGP2W83
Estimated Impact197
Family? (F = Feedback message, R = changed R code, M = changed R Module, P = changed Parameters, D = changed Data)
-       [Standard Deviation-Mean Plot] [] [2011-01-16 13:10:31] [a6954a1d1f0e31732d0acb07eec786a1] [Current]
Feedback Forum

Post a new message
Dataseries X:
52347
52407
50570
50442
50590
50040
50476
50268
50595
48708
48547
48196
48375
47915
46462
46132
46308
46532
46817
46824
46263
45992
46404
46995
48102
48719
47912
48430
50141
50608
51005
51857
52513
52406
53634
55165
57294
58026
56701
58706
60103
61153
62395
63850
64534
65765
66954
65741
65474
60687
59227
59373
59995
59532
59696
59507
60210
58782
59372
58827
60481
59508
56565
56201
56193
56431
56316
55316
54795
53310
51848
50618
52026
50120
46825
46374
45441
45392
45032
44302
42880
42101
41886
41415
43228
41633
39375
38603
37847
36881
36700
36477
35684
35896
37109
37612
39570
39518
37970
38343
37966
38942
39304
39438
38999
38110
40024
41050
42239
42313
41159
42067
42515
43554
45018
45797
46749
47291
48800
50566
54884
54002
51813
52751
54461
55364
56900
57795


Summary of computational transaction
Raw Inputview raw input (R code)
Raw Outputview raw output of R engine
Computing time1 seconds
R Server'Herman Ole Andreas Wold' @ www.yougetit.org

\begin{tabular}{lllllllll}
\hline
Summary of computational transaction \tabularnewline
Raw Input & view raw input (R code)  \tabularnewline
Raw Output & view raw output of R engine  \tabularnewline
Computing time & 1 seconds \tabularnewline
R Server & 'Herman Ole Andreas Wold' @ www.yougetit.org \tabularnewline
\hline
\end{tabular}
%Source: https://freestatistics.org/blog/index.php?pk=117395&T=0

[TABLE]
[ROW][C]Summary of computational transaction[/C][/ROW]
[ROW][C]Raw Input[/C][C]view raw input (R code) [/C][/ROW]
[ROW][C]Raw Output[/C][C]view raw output of R engine [/C][/ROW]
[ROW][C]Computing time[/C][C]1 seconds[/C][/ROW]
[ROW][C]R Server[/C][C]'Herman Ole Andreas Wold' @ www.yougetit.org[/C][/ROW]
[/TABLE]
Source: https://freestatistics.org/blog/index.php?pk=117395&T=0

Globally Unique Identifier (entire table): ba.freestatistics.org/blog/index.php?pk=117395&T=0

As an alternative you can also use a QR Code:  

The GUIDs for individual cells are displayed in the table below:

Summary of computational transaction
Raw Inputview raw input (R code)
Raw Outputview raw output of R engine
Computing time1 seconds
R Server'Herman Ole Andreas Wold' @ www.yougetit.org


Standard Deviation-Mean Plot
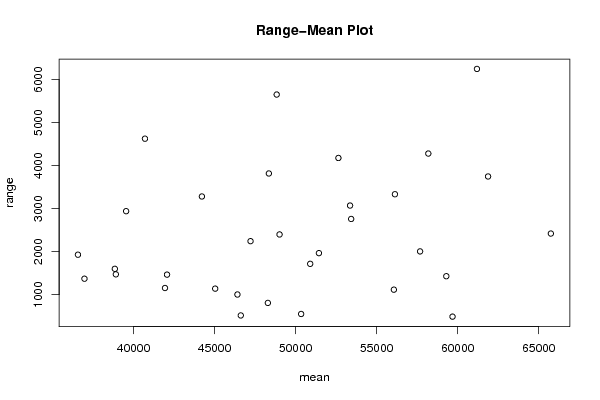
SectionMeanStandard DeviationRange
151441.51081.762913026691965
250343.5242.302152968836550
349011.51077.092537033532399
4472211091.68890562592243
546620.25248.671637573193516
646413.5423.6921051896061003
748290.75356.7757232025807
850902.75727.5962135690371716
953429.51283.394587282752759
1057681.75871.7447543098072005
1161875.251615.785954264983747
1265748.5988.023110390982420
1361190.252930.33119572976247
1459682.5224.565506404405488
1559297.75664.6594992926831428
1658188.752127.795788290474280
1756064508.0478980043781115
1852642.751808.189034181254177
1948836.252703.720939125685652
2045041.75525.8012140216741139
2142070.5610.9939988794221465
2240709.752114.546976698954625
2336976.25603.5568876805791370
2436575.25933.7106528969951928
2538850.25815.6945404582121600
2638912.5664.8696614124211472
2739545.751271.718620607562940
2841944.5533.7099711766061154
29442211469.048444855833282
3048351.51712.486398972753817
3153362.51353.859298450173071
32561301498.604017077233334

\begin{tabular}{lllllllll}
\hline
Standard Deviation-Mean Plot \tabularnewline
Section & Mean & Standard Deviation & Range \tabularnewline
1 & 51441.5 & 1081.76291302669 & 1965 \tabularnewline
2 & 50343.5 & 242.302152968836 & 550 \tabularnewline
3 & 49011.5 & 1077.09253703353 & 2399 \tabularnewline
4 & 47221 & 1091.6889056259 & 2243 \tabularnewline
5 & 46620.25 & 248.671637573193 & 516 \tabularnewline
6 & 46413.5 & 423.692105189606 & 1003 \tabularnewline
7 & 48290.75 & 356.7757232025 & 807 \tabularnewline
8 & 50902.75 & 727.596213569037 & 1716 \tabularnewline
9 & 53429.5 & 1283.39458728275 & 2759 \tabularnewline
10 & 57681.75 & 871.744754309807 & 2005 \tabularnewline
11 & 61875.25 & 1615.78595426498 & 3747 \tabularnewline
12 & 65748.5 & 988.02311039098 & 2420 \tabularnewline
13 & 61190.25 & 2930.3311957297 & 6247 \tabularnewline
14 & 59682.5 & 224.565506404405 & 488 \tabularnewline
15 & 59297.75 & 664.659499292683 & 1428 \tabularnewline
16 & 58188.75 & 2127.79578829047 & 4280 \tabularnewline
17 & 56064 & 508.047898004378 & 1115 \tabularnewline
18 & 52642.75 & 1808.18903418125 & 4177 \tabularnewline
19 & 48836.25 & 2703.72093912568 & 5652 \tabularnewline
20 & 45041.75 & 525.801214021674 & 1139 \tabularnewline
21 & 42070.5 & 610.993998879422 & 1465 \tabularnewline
22 & 40709.75 & 2114.54697669895 & 4625 \tabularnewline
23 & 36976.25 & 603.556887680579 & 1370 \tabularnewline
24 & 36575.25 & 933.710652896995 & 1928 \tabularnewline
25 & 38850.25 & 815.694540458212 & 1600 \tabularnewline
26 & 38912.5 & 664.869661412421 & 1472 \tabularnewline
27 & 39545.75 & 1271.71862060756 & 2940 \tabularnewline
28 & 41944.5 & 533.709971176606 & 1154 \tabularnewline
29 & 44221 & 1469.04844485583 & 3282 \tabularnewline
30 & 48351.5 & 1712.48639897275 & 3817 \tabularnewline
31 & 53362.5 & 1353.85929845017 & 3071 \tabularnewline
32 & 56130 & 1498.60401707723 & 3334 \tabularnewline
\hline
\end{tabular}
%Source: https://freestatistics.org/blog/index.php?pk=117395&T=1

[TABLE]
[ROW][C]Standard Deviation-Mean Plot[/C][/ROW]
[ROW][C]Section[/C][C]Mean[/C][C]Standard Deviation[/C][C]Range[/C][/ROW]
[ROW][C]1[/C][C]51441.5[/C][C]1081.76291302669[/C][C]1965[/C][/ROW]
[ROW][C]2[/C][C]50343.5[/C][C]242.302152968836[/C][C]550[/C][/ROW]
[ROW][C]3[/C][C]49011.5[/C][C]1077.09253703353[/C][C]2399[/C][/ROW]
[ROW][C]4[/C][C]47221[/C][C]1091.6889056259[/C][C]2243[/C][/ROW]
[ROW][C]5[/C][C]46620.25[/C][C]248.671637573193[/C][C]516[/C][/ROW]
[ROW][C]6[/C][C]46413.5[/C][C]423.692105189606[/C][C]1003[/C][/ROW]
[ROW][C]7[/C][C]48290.75[/C][C]356.7757232025[/C][C]807[/C][/ROW]
[ROW][C]8[/C][C]50902.75[/C][C]727.596213569037[/C][C]1716[/C][/ROW]
[ROW][C]9[/C][C]53429.5[/C][C]1283.39458728275[/C][C]2759[/C][/ROW]
[ROW][C]10[/C][C]57681.75[/C][C]871.744754309807[/C][C]2005[/C][/ROW]
[ROW][C]11[/C][C]61875.25[/C][C]1615.78595426498[/C][C]3747[/C][/ROW]
[ROW][C]12[/C][C]65748.5[/C][C]988.02311039098[/C][C]2420[/C][/ROW]
[ROW][C]13[/C][C]61190.25[/C][C]2930.3311957297[/C][C]6247[/C][/ROW]
[ROW][C]14[/C][C]59682.5[/C][C]224.565506404405[/C][C]488[/C][/ROW]
[ROW][C]15[/C][C]59297.75[/C][C]664.659499292683[/C][C]1428[/C][/ROW]
[ROW][C]16[/C][C]58188.75[/C][C]2127.79578829047[/C][C]4280[/C][/ROW]
[ROW][C]17[/C][C]56064[/C][C]508.047898004378[/C][C]1115[/C][/ROW]
[ROW][C]18[/C][C]52642.75[/C][C]1808.18903418125[/C][C]4177[/C][/ROW]
[ROW][C]19[/C][C]48836.25[/C][C]2703.72093912568[/C][C]5652[/C][/ROW]
[ROW][C]20[/C][C]45041.75[/C][C]525.801214021674[/C][C]1139[/C][/ROW]
[ROW][C]21[/C][C]42070.5[/C][C]610.993998879422[/C][C]1465[/C][/ROW]
[ROW][C]22[/C][C]40709.75[/C][C]2114.54697669895[/C][C]4625[/C][/ROW]
[ROW][C]23[/C][C]36976.25[/C][C]603.556887680579[/C][C]1370[/C][/ROW]
[ROW][C]24[/C][C]36575.25[/C][C]933.710652896995[/C][C]1928[/C][/ROW]
[ROW][C]25[/C][C]38850.25[/C][C]815.694540458212[/C][C]1600[/C][/ROW]
[ROW][C]26[/C][C]38912.5[/C][C]664.869661412421[/C][C]1472[/C][/ROW]
[ROW][C]27[/C][C]39545.75[/C][C]1271.71862060756[/C][C]2940[/C][/ROW]
[ROW][C]28[/C][C]41944.5[/C][C]533.709971176606[/C][C]1154[/C][/ROW]
[ROW][C]29[/C][C]44221[/C][C]1469.04844485583[/C][C]3282[/C][/ROW]
[ROW][C]30[/C][C]48351.5[/C][C]1712.48639897275[/C][C]3817[/C][/ROW]
[ROW][C]31[/C][C]53362.5[/C][C]1353.85929845017[/C][C]3071[/C][/ROW]
[ROW][C]32[/C][C]56130[/C][C]1498.60401707723[/C][C]3334[/C][/ROW]
[/TABLE]
Source: https://freestatistics.org/blog/index.php?pk=117395&T=1

Globally Unique Identifier (entire table): ba.freestatistics.org/blog/index.php?pk=117395&T=1

As an alternative you can also use a QR Code:  

The GUIDs for individual cells are displayed in the table below:

Standard Deviation-Mean Plot
SectionMeanStandard DeviationRange
151441.51081.762913026691965
250343.5242.302152968836550
349011.51077.092537033532399
4472211091.68890562592243
546620.25248.671637573193516
646413.5423.6921051896061003
748290.75356.7757232025807
850902.75727.5962135690371716
953429.51283.394587282752759
1057681.75871.7447543098072005
1161875.251615.785954264983747
1265748.5988.023110390982420
1361190.252930.33119572976247
1459682.5224.565506404405488
1559297.75664.6594992926831428
1658188.752127.795788290474280
1756064508.0478980043781115
1852642.751808.189034181254177
1948836.252703.720939125685652
2045041.75525.8012140216741139
2142070.5610.9939988794221465
2240709.752114.546976698954625
2336976.25603.5568876805791370
2436575.25933.7106528969951928
2538850.25815.6945404582121600
2638912.5664.8696614124211472
2739545.751271.718620607562940
2841944.5533.7099711766061154
29442211469.048444855833282
3048351.51712.486398972753817
3153362.51353.859298450173071
32561301498.604017077233334


Regression: S.E.(k) = alpha + beta * Mean(k)
alpha103.48737712451
beta0.0200134639880739
S.D.0.0156191414552193
T-STAT1.28134213045278
p-value0.209889602571648

\begin{tabular}{lllllllll}
\hline
Regression: S.E.(k) = alpha + beta * Mean(k) \tabularnewline
alpha & 103.48737712451 \tabularnewline
beta & 0.0200134639880739 \tabularnewline
S.D. & 0.0156191414552193 \tabularnewline
T-STAT & 1.28134213045278 \tabularnewline
p-value & 0.209889602571648 \tabularnewline
\hline
\end{tabular}
%Source: https://freestatistics.org/blog/index.php?pk=117395&T=2

[TABLE]
[ROW][C]Regression: S.E.(k) = alpha + beta * Mean(k)[/C][/ROW]
[ROW][C]alpha[/C][C]103.48737712451[/C][/ROW]
[ROW][C]beta[/C][C]0.0200134639880739[/C][/ROW]
[ROW][C]S.D.[/C][C]0.0156191414552193[/C][/ROW]
[ROW][C]T-STAT[/C][C]1.28134213045278[/C][/ROW]
[ROW][C]p-value[/C][C]0.209889602571648[/C][/ROW]
[/TABLE]
Source: https://freestatistics.org/blog/index.php?pk=117395&T=2

Globally Unique Identifier (entire table): ba.freestatistics.org/blog/index.php?pk=117395&T=2

As an alternative you can also use a QR Code:  

The GUIDs for individual cells are displayed in the table below:

Regression: S.E.(k) = alpha + beta * Mean(k)
alpha103.48737712451
beta0.0200134639880739
S.D.0.0156191414552193
T-STAT1.28134213045278
p-value0.209889602571648


Regression: ln S.E.(k) = alpha + beta * ln Mean(k)
alpha0.0122495382604356
beta0.627832451725583
S.D.0.765465045726809
T-STAT0.820197414931542
p-value0.418573007226473
Lambda0.372167548274417

\begin{tabular}{lllllllll}
\hline
Regression: ln S.E.(k) = alpha + beta * ln Mean(k) \tabularnewline
alpha & 0.0122495382604356 \tabularnewline
beta & 0.627832451725583 \tabularnewline
S.D. & 0.765465045726809 \tabularnewline
T-STAT & 0.820197414931542 \tabularnewline
p-value & 0.418573007226473 \tabularnewline
Lambda & 0.372167548274417 \tabularnewline
\hline
\end{tabular}
%Source: https://freestatistics.org/blog/index.php?pk=117395&T=3

[TABLE]
[ROW][C]Regression: ln S.E.(k) = alpha + beta * ln Mean(k)[/C][/ROW]
[ROW][C]alpha[/C][C]0.0122495382604356[/C][/ROW]
[ROW][C]beta[/C][C]0.627832451725583[/C][/ROW]
[ROW][C]S.D.[/C][C]0.765465045726809[/C][/ROW]
[ROW][C]T-STAT[/C][C]0.820197414931542[/C][/ROW]
[ROW][C]p-value[/C][C]0.418573007226473[/C][/ROW]
[ROW][C]Lambda[/C][C]0.372167548274417[/C][/ROW]
[/TABLE]
Source: https://freestatistics.org/blog/index.php?pk=117395&T=3

Globally Unique Identifier (entire table): ba.freestatistics.org/blog/index.php?pk=117395&T=3

As an alternative you can also use a QR Code:  

The GUIDs for individual cells are displayed in the table below:

Regression: ln S.E.(k) = alpha + beta * ln Mean(k)
alpha0.0122495382604356
beta0.627832451725583
S.D.0.765465045726809
T-STAT0.820197414931542
p-value0.418573007226473
Lambda0.372167548274417


Parameters (Session):
par1 = 4 ;
Parameters (R input):
par1 = 4 ;
R code (references can be found in the software module):
par1 <- as.numeric(par1)
(n <- length(x))
(np <- floor(n / par1))
arr <- array(NA,dim=c(par1,np))
j <- 0
k <- 1
for (i in 1:(np*par1))
{
j = j + 1
arr[j,k] <- x[i]
if (j == par1) {
j = 0
k=k+1
}
}
arr
arr.mean <- array(NA,dim=np)
arr.sd <- array(NA,dim=np)
arr.range <- array(NA,dim=np)
for (j in 1:np)
{
arr.mean[j] <- mean(arr[,j],na.rm=TRUE)
arr.sd[j] <- sd(arr[,j],na.rm=TRUE)
arr.range[j] <- max(arr[,j],na.rm=TRUE) - min(arr[,j],na.rm=TRUE)
}
arr.mean
arr.sd
arr.range
(lm1 <- lm(arr.sd~arr.mean))
(lnlm1 <- lm(log(arr.sd)~log(arr.mean)))
(lm2 <- lm(arr.range~arr.mean))
bitmap(file='test1.png')
plot(arr.mean,arr.sd,main='Standard Deviation-Mean Plot',xlab='mean',ylab='standard deviation')
dev.off()
bitmap(file='test2.png')
plot(arr.mean,arr.range,main='Range-Mean Plot',xlab='mean',ylab='range')
dev.off()
load(file='createtable')
a<-table.start()
a<-table.row.start(a)
a<-table.element(a,'Standard Deviation-Mean Plot',4,TRUE)
a<-table.row.end(a)
a<-table.row.start(a)
a<-table.element(a,'Section',header=TRUE)
a<-table.element(a,'Mean',header=TRUE)
a<-table.element(a,'Standard Deviation',header=TRUE)
a<-table.element(a,'Range',header=TRUE)
a<-table.row.end(a)
for (j in 1:np) {
a<-table.row.start(a)
a<-table.element(a,j,header=TRUE)
a<-table.element(a,arr.mean[j])
a<-table.element(a,arr.sd[j] )
a<-table.element(a,arr.range[j] )
a<-table.row.end(a)
}
a<-table.end(a)
table.save(a,file='mytable.tab')
a<-table.start()
a<-table.row.start(a)
a<-table.element(a,'Regression: S.E.(k) = alpha + beta * Mean(k)',2,TRUE)
a<-table.row.end(a)
a<-table.row.start(a)
a<-table.element(a,'alpha',header=TRUE)
a<-table.element(a,lm1$coefficients[[1]])
a<-table.row.end(a)
a<-table.row.start(a)
a<-table.element(a,'beta',header=TRUE)
a<-table.element(a,lm1$coefficients[[2]])
a<-table.row.end(a)
a<-table.row.start(a)
a<-table.element(a,'S.D.',header=TRUE)
a<-table.element(a,summary(lm1)$coefficients[2,2])
a<-table.row.end(a)
a<-table.row.start(a)
a<-table.element(a,'T-STAT',header=TRUE)
a<-table.element(a,summary(lm1)$coefficients[2,3])
a<-table.row.end(a)
a<-table.row.start(a)
a<-table.element(a,'p-value',header=TRUE)
a<-table.element(a,summary(lm1)$coefficients[2,4])
a<-table.row.end(a)
a<-table.end(a)
table.save(a,file='mytable1.tab')
a<-table.start()
a<-table.row.start(a)
a<-table.element(a,'Regression: ln S.E.(k) = alpha + beta * ln Mean(k)',2,TRUE)
a<-table.row.end(a)
a<-table.row.start(a)
a<-table.element(a,'alpha',header=TRUE)
a<-table.element(a,lnlm1$coefficients[[1]])
a<-table.row.end(a)
a<-table.row.start(a)
a<-table.element(a,'beta',header=TRUE)
a<-table.element(a,lnlm1$coefficients[[2]])
a<-table.row.end(a)
a<-table.row.start(a)
a<-table.element(a,'S.D.',header=TRUE)
a<-table.element(a,summary(lnlm1)$coefficients[2,2])
a<-table.row.end(a)
a<-table.row.start(a)
a<-table.element(a,'T-STAT',header=TRUE)
a<-table.element(a,summary(lnlm1)$coefficients[2,3])
a<-table.row.end(a)
a<-table.row.start(a)
a<-table.element(a,'p-value',header=TRUE)
a<-table.element(a,summary(lnlm1)$coefficients[2,4])
a<-table.row.end(a)
a<-table.row.start(a)
a<-table.element(a,'Lambda',header=TRUE)
a<-table.element(a,1-lnlm1$coefficients[[2]])
a<-table.row.end(a)
a<-table.end(a)
table.save(a,file='mytable2.tab')