Free Statistics

of Irreproducible Research!

Author's title

Author*Unverified author*
R Software Modulerwasp_smp.wasp
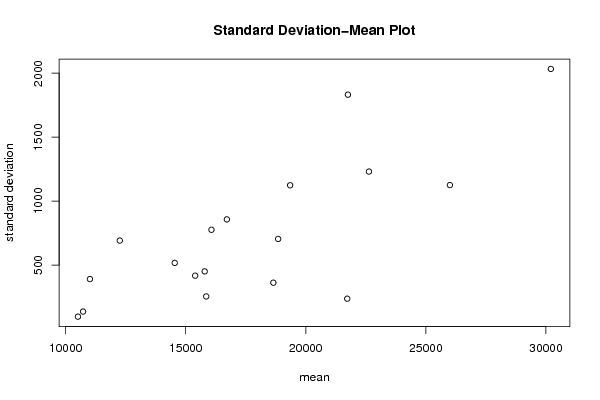
Title produced by softwareStandard Deviation-Mean Plot
Date of computationSun, 16 Jan 2011 13:42:18 +0000
Cite this page as followsStatistical Computations at FreeStatistics.org, Office for Research Development and Education, URL https://freestatistics.org/blog/index.php?v=date/2011/Jan/16/t1295185223kaq4sv9uhr7ase7.htm/, Retrieved Thu, 31 Oct 2024 23:17:20 +0000
Statistical Computations at FreeStatistics.org, Office for Research Development and Education, URL https://freestatistics.org/blog/index.php?pk=117401, Retrieved Thu, 31 Oct 2024 23:17:20 +0000
QR Codes:

Original text written by user:
IsPrivate?No (this computation is public)
User-defined keywordsKDGP2W83
Estimated Impact189
Family? (F = Feedback message, R = changed R code, M = changed R Module, P = changed Parameters, D = changed Data)
-     [Univariate Data Series] [] [2011-01-16 11:37:06] [e35ce2e7ec49602a729c3c8722e619b0]
- RMPD  [Variability] [] [2011-01-16 13:09:43] [e35ce2e7ec49602a729c3c8722e619b0]
- RM D      [Standard Deviation-Mean Plot] [] [2011-01-16 13:42:18] [9ecedc6075144b73bec317d56fadfdf0] [Current]
Feedback Forum

Post a new message
Dataseries X:
10574
10653
10805
10872
10625
10407
10463
10556
10646
10702
11353
11346
11451
11964
12574
13031
13812
14544
14931
14886
16005
17064
15168
16050
15839
15137
14954
15648
15305
15579
16348
15928
16171
15937
15713
15594
15683
16438
17032
17696
17745
19394
20148
20108
18584
18441
18391
19178
18073
18483
19644
19195
19650
20830
23595
22937
21814
21928
21777
21383
21467
22052
22680
24320
24977
25204
27390
26434
27525
30695
32436
30160
30236


Summary of computational transaction
Raw Inputview raw input (R code)
Raw Outputview raw output of R engine
Computing time1 seconds
R Server'Sir Ronald Aylmer Fisher' @ 193.190.124.24

\begin{tabular}{lllllllll}
\hline
Summary of computational transaction \tabularnewline
Raw Input & view raw input (R code)  \tabularnewline
Raw Output & view raw output of R engine  \tabularnewline
Computing time & 1 seconds \tabularnewline
R Server & 'Sir Ronald Aylmer Fisher' @ 193.190.124.24 \tabularnewline
\hline
\end{tabular}
%Source: https://freestatistics.org/blog/index.php?pk=117401&T=0

[TABLE]
[ROW][C]Summary of computational transaction[/C][/ROW]
[ROW][C]Raw Input[/C][C]view raw input (R code) [/C][/ROW]
[ROW][C]Raw Output[/C][C]view raw output of R engine [/C][/ROW]
[ROW][C]Computing time[/C][C]1 seconds[/C][/ROW]
[ROW][C]R Server[/C][C]'Sir Ronald Aylmer Fisher' @ 193.190.124.24[/C][/ROW]
[/TABLE]
Source: https://freestatistics.org/blog/index.php?pk=117401&T=0

Globally Unique Identifier (entire table): ba.freestatistics.org/blog/index.php?pk=117401&T=0

As an alternative you can also use a QR Code:  

The GUIDs for individual cells are displayed in the table below:

Summary of computational transaction
Raw Inputview raw input (R code)
Raw Outputview raw output of R engine
Computing time1 seconds
R Server'Sir Ronald Aylmer Fisher' @ 193.190.124.24


Standard Deviation-Mean Plot
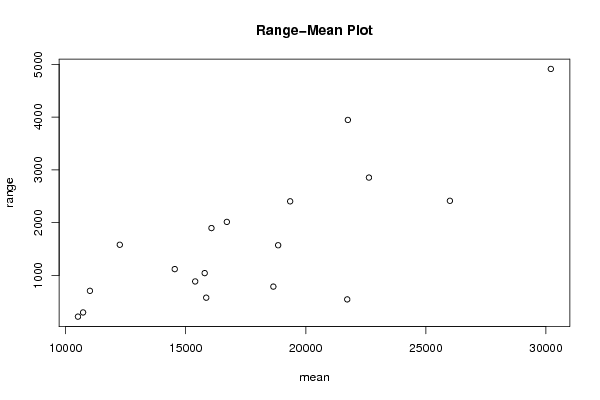
SectionMeanStandard DeviationRange
110726136.613810917247298
210512.7596.8310384122777218
311011.75390.680069451548707
412255691.6246573587921580
514543.25517.2216642794461119
616071.75775.940880479951896
715394.5417.208580928053885
815790450.9818917281121043
915853.75254.858620938486577
1016712.25857.2383468635392013
1119348.751123.880591225482403
1218648.5362.350198932837787
1318848.75704.2425600127651571
14217531832.062407961773945
1521725.5237.203850446545545
1622629.751230.887586256362853
1726001.251125.550939170092413
18302042033.214368104524911

\begin{tabular}{lllllllll}
\hline
Standard Deviation-Mean Plot \tabularnewline
Section & Mean & Standard Deviation & Range \tabularnewline
1 & 10726 & 136.613810917247 & 298 \tabularnewline
2 & 10512.75 & 96.8310384122777 & 218 \tabularnewline
3 & 11011.75 & 390.680069451548 & 707 \tabularnewline
4 & 12255 & 691.624657358792 & 1580 \tabularnewline
5 & 14543.25 & 517.221664279446 & 1119 \tabularnewline
6 & 16071.75 & 775.94088047995 & 1896 \tabularnewline
7 & 15394.5 & 417.208580928053 & 885 \tabularnewline
8 & 15790 & 450.981891728112 & 1043 \tabularnewline
9 & 15853.75 & 254.858620938486 & 577 \tabularnewline
10 & 16712.25 & 857.238346863539 & 2013 \tabularnewline
11 & 19348.75 & 1123.88059122548 & 2403 \tabularnewline
12 & 18648.5 & 362.350198932837 & 787 \tabularnewline
13 & 18848.75 & 704.242560012765 & 1571 \tabularnewline
14 & 21753 & 1832.06240796177 & 3945 \tabularnewline
15 & 21725.5 & 237.203850446545 & 545 \tabularnewline
16 & 22629.75 & 1230.88758625636 & 2853 \tabularnewline
17 & 26001.25 & 1125.55093917009 & 2413 \tabularnewline
18 & 30204 & 2033.21436810452 & 4911 \tabularnewline
\hline
\end{tabular}
%Source: https://freestatistics.org/blog/index.php?pk=117401&T=1

[TABLE]
[ROW][C]Standard Deviation-Mean Plot[/C][/ROW]
[ROW][C]Section[/C][C]Mean[/C][C]Standard Deviation[/C][C]Range[/C][/ROW]
[ROW][C]1[/C][C]10726[/C][C]136.613810917247[/C][C]298[/C][/ROW]
[ROW][C]2[/C][C]10512.75[/C][C]96.8310384122777[/C][C]218[/C][/ROW]
[ROW][C]3[/C][C]11011.75[/C][C]390.680069451548[/C][C]707[/C][/ROW]
[ROW][C]4[/C][C]12255[/C][C]691.624657358792[/C][C]1580[/C][/ROW]
[ROW][C]5[/C][C]14543.25[/C][C]517.221664279446[/C][C]1119[/C][/ROW]
[ROW][C]6[/C][C]16071.75[/C][C]775.94088047995[/C][C]1896[/C][/ROW]
[ROW][C]7[/C][C]15394.5[/C][C]417.208580928053[/C][C]885[/C][/ROW]
[ROW][C]8[/C][C]15790[/C][C]450.981891728112[/C][C]1043[/C][/ROW]
[ROW][C]9[/C][C]15853.75[/C][C]254.858620938486[/C][C]577[/C][/ROW]
[ROW][C]10[/C][C]16712.25[/C][C]857.238346863539[/C][C]2013[/C][/ROW]
[ROW][C]11[/C][C]19348.75[/C][C]1123.88059122548[/C][C]2403[/C][/ROW]
[ROW][C]12[/C][C]18648.5[/C][C]362.350198932837[/C][C]787[/C][/ROW]
[ROW][C]13[/C][C]18848.75[/C][C]704.242560012765[/C][C]1571[/C][/ROW]
[ROW][C]14[/C][C]21753[/C][C]1832.06240796177[/C][C]3945[/C][/ROW]
[ROW][C]15[/C][C]21725.5[/C][C]237.203850446545[/C][C]545[/C][/ROW]
[ROW][C]16[/C][C]22629.75[/C][C]1230.88758625636[/C][C]2853[/C][/ROW]
[ROW][C]17[/C][C]26001.25[/C][C]1125.55093917009[/C][C]2413[/C][/ROW]
[ROW][C]18[/C][C]30204[/C][C]2033.21436810452[/C][C]4911[/C][/ROW]
[/TABLE]
Source: https://freestatistics.org/blog/index.php?pk=117401&T=1

Globally Unique Identifier (entire table): ba.freestatistics.org/blog/index.php?pk=117401&T=1

As an alternative you can also use a QR Code:  

The GUIDs for individual cells are displayed in the table below:

Standard Deviation-Mean Plot
SectionMeanStandard DeviationRange
110726136.613810917247298
210512.7596.8310384122777218
311011.75390.680069451548707
412255691.6246573587921580
514543.25517.2216642794461119
616071.75775.940880479951896
715394.5417.208580928053885
815790450.9818917281121043
915853.75254.858620938486577
1016712.25857.2383468635392013
1119348.751123.880591225482403
1218648.5362.350198932837787
1318848.75704.2425600127651571
14217531832.062407961773945
1521725.5237.203850446545545
1622629.751230.887586256362853
1726001.251125.550939170092413
18302042033.214368104524911


Regression: S.E.(k) = alpha + beta * Mean(k)
alpha-661.875245713468
beta0.0790878437329446
S.D.0.016549234748395
T-STAT4.77894264812546
p-value0.000204943622627993

\begin{tabular}{lllllllll}
\hline
Regression: S.E.(k) = alpha + beta * Mean(k) \tabularnewline
alpha & -661.875245713468 \tabularnewline
beta & 0.0790878437329446 \tabularnewline
S.D. & 0.016549234748395 \tabularnewline
T-STAT & 4.77894264812546 \tabularnewline
p-value & 0.000204943622627993 \tabularnewline
\hline
\end{tabular}
%Source: https://freestatistics.org/blog/index.php?pk=117401&T=2

[TABLE]
[ROW][C]Regression: S.E.(k) = alpha + beta * Mean(k)[/C][/ROW]
[ROW][C]alpha[/C][C]-661.875245713468[/C][/ROW]
[ROW][C]beta[/C][C]0.0790878437329446[/C][/ROW]
[ROW][C]S.D.[/C][C]0.016549234748395[/C][/ROW]
[ROW][C]T-STAT[/C][C]4.77894264812546[/C][/ROW]
[ROW][C]p-value[/C][C]0.000204943622627993[/C][/ROW]
[/TABLE]
Source: https://freestatistics.org/blog/index.php?pk=117401&T=2

Globally Unique Identifier (entire table): ba.freestatistics.org/blog/index.php?pk=117401&T=2

As an alternative you can also use a QR Code:  

The GUIDs for individual cells are displayed in the table below:

Regression: S.E.(k) = alpha + beta * Mean(k)
alpha-661.875245713468
beta0.0790878437329446
S.D.0.016549234748395
T-STAT4.77894264812546
p-value0.000204943622627993


Regression: ln S.E.(k) = alpha + beta * ln Mean(k)
alpha-13.2405553655873
beta2.00772342153798
S.D.0.482972062587607
T-STAT4.15701771812897
p-value0.000742344313015657
Lambda-1.00772342153798

\begin{tabular}{lllllllll}
\hline
Regression: ln S.E.(k) = alpha + beta * ln Mean(k) \tabularnewline
alpha & -13.2405553655873 \tabularnewline
beta & 2.00772342153798 \tabularnewline
S.D. & 0.482972062587607 \tabularnewline
T-STAT & 4.15701771812897 \tabularnewline
p-value & 0.000742344313015657 \tabularnewline
Lambda & -1.00772342153798 \tabularnewline
\hline
\end{tabular}
%Source: https://freestatistics.org/blog/index.php?pk=117401&T=3

[TABLE]
[ROW][C]Regression: ln S.E.(k) = alpha + beta * ln Mean(k)[/C][/ROW]
[ROW][C]alpha[/C][C]-13.2405553655873[/C][/ROW]
[ROW][C]beta[/C][C]2.00772342153798[/C][/ROW]
[ROW][C]S.D.[/C][C]0.482972062587607[/C][/ROW]
[ROW][C]T-STAT[/C][C]4.15701771812897[/C][/ROW]
[ROW][C]p-value[/C][C]0.000742344313015657[/C][/ROW]
[ROW][C]Lambda[/C][C]-1.00772342153798[/C][/ROW]
[/TABLE]
Source: https://freestatistics.org/blog/index.php?pk=117401&T=3

Globally Unique Identifier (entire table): ba.freestatistics.org/blog/index.php?pk=117401&T=3

As an alternative you can also use a QR Code:  

The GUIDs for individual cells are displayed in the table below:

Regression: ln S.E.(k) = alpha + beta * ln Mean(k)
alpha-13.2405553655873
beta2.00772342153798
S.D.0.482972062587607
T-STAT4.15701771812897
p-value0.000742344313015657
Lambda-1.00772342153798


Parameters (Session):
par1 = 200 ; par2 = 12 ;
Parameters (R input):
par1 = 4 ;
R code (references can be found in the software module):
par1 <- as.numeric(par1)
(n <- length(x))
(np <- floor(n / par1))
arr <- array(NA,dim=c(par1,np))
j <- 0
k <- 1
for (i in 1:(np*par1))
{
j = j + 1
arr[j,k] <- x[i]
if (j == par1) {
j = 0
k=k+1
}
}
arr
arr.mean <- array(NA,dim=np)
arr.sd <- array(NA,dim=np)
arr.range <- array(NA,dim=np)
for (j in 1:np)
{
arr.mean[j] <- mean(arr[,j],na.rm=TRUE)
arr.sd[j] <- sd(arr[,j],na.rm=TRUE)
arr.range[j] <- max(arr[,j],na.rm=TRUE) - min(arr[,j],na.rm=TRUE)
}
arr.mean
arr.sd
arr.range
(lm1 <- lm(arr.sd~arr.mean))
(lnlm1 <- lm(log(arr.sd)~log(arr.mean)))
(lm2 <- lm(arr.range~arr.mean))
bitmap(file='test1.png')
plot(arr.mean,arr.sd,main='Standard Deviation-Mean Plot',xlab='mean',ylab='standard deviation')
dev.off()
bitmap(file='test2.png')
plot(arr.mean,arr.range,main='Range-Mean Plot',xlab='mean',ylab='range')
dev.off()
load(file='createtable')
a<-table.start()
a<-table.row.start(a)
a<-table.element(a,'Standard Deviation-Mean Plot',4,TRUE)
a<-table.row.end(a)
a<-table.row.start(a)
a<-table.element(a,'Section',header=TRUE)
a<-table.element(a,'Mean',header=TRUE)
a<-table.element(a,'Standard Deviation',header=TRUE)
a<-table.element(a,'Range',header=TRUE)
a<-table.row.end(a)
for (j in 1:np) {
a<-table.row.start(a)
a<-table.element(a,j,header=TRUE)
a<-table.element(a,arr.mean[j])
a<-table.element(a,arr.sd[j] )
a<-table.element(a,arr.range[j] )
a<-table.row.end(a)
}
a<-table.end(a)
table.save(a,file='mytable.tab')
a<-table.start()
a<-table.row.start(a)
a<-table.element(a,'Regression: S.E.(k) = alpha + beta * Mean(k)',2,TRUE)
a<-table.row.end(a)
a<-table.row.start(a)
a<-table.element(a,'alpha',header=TRUE)
a<-table.element(a,lm1$coefficients[[1]])
a<-table.row.end(a)
a<-table.row.start(a)
a<-table.element(a,'beta',header=TRUE)
a<-table.element(a,lm1$coefficients[[2]])
a<-table.row.end(a)
a<-table.row.start(a)
a<-table.element(a,'S.D.',header=TRUE)
a<-table.element(a,summary(lm1)$coefficients[2,2])
a<-table.row.end(a)
a<-table.row.start(a)
a<-table.element(a,'T-STAT',header=TRUE)
a<-table.element(a,summary(lm1)$coefficients[2,3])
a<-table.row.end(a)
a<-table.row.start(a)
a<-table.element(a,'p-value',header=TRUE)
a<-table.element(a,summary(lm1)$coefficients[2,4])
a<-table.row.end(a)
a<-table.end(a)
table.save(a,file='mytable1.tab')
a<-table.start()
a<-table.row.start(a)
a<-table.element(a,'Regression: ln S.E.(k) = alpha + beta * ln Mean(k)',2,TRUE)
a<-table.row.end(a)
a<-table.row.start(a)
a<-table.element(a,'alpha',header=TRUE)
a<-table.element(a,lnlm1$coefficients[[1]])
a<-table.row.end(a)
a<-table.row.start(a)
a<-table.element(a,'beta',header=TRUE)
a<-table.element(a,lnlm1$coefficients[[2]])
a<-table.row.end(a)
a<-table.row.start(a)
a<-table.element(a,'S.D.',header=TRUE)
a<-table.element(a,summary(lnlm1)$coefficients[2,2])
a<-table.row.end(a)
a<-table.row.start(a)
a<-table.element(a,'T-STAT',header=TRUE)
a<-table.element(a,summary(lnlm1)$coefficients[2,3])
a<-table.row.end(a)
a<-table.row.start(a)
a<-table.element(a,'p-value',header=TRUE)
a<-table.element(a,summary(lnlm1)$coefficients[2,4])
a<-table.row.end(a)
a<-table.row.start(a)
a<-table.element(a,'Lambda',header=TRUE)
a<-table.element(a,1-lnlm1$coefficients[[2]])
a<-table.row.end(a)
a<-table.end(a)
table.save(a,file='mytable2.tab')