Free Statistics
of Irreproducible Research!
Description of Statistical Computation | |
|---|---|
| Author's title | |
| Author | *The author of this computation has been verified* |
| R Software Module | Rscript (source code is shown below) |
| Title produced by software | R console |
| Date of computation | Sun, 20 Mar 2011 18:02:03 +0000 |
| Cite this page as follows | Statistical Computations at FreeStatistics.org, Office for Research Development and Education, URL https://freestatistics.org/blog/index.php?v=date/2011/Mar/20/t1300643897ttzt5xs85m4728n.htm/, Retrieved Mon, 19 Oct 2026 13:09:07 +0000 |
| Statistical Computations at FreeStatistics.org, Office for Research Development and Education, URL https://freestatistics.org/blog/index.php?pk=119778, Retrieved Mon, 19 Oct 2026 13:09:07 +0000 | |
| QR Codes: | |
|
| |
| Original text written by user: | This example is used in the manual files of the RC package. |
| IsPrivate? | No (this computation is public) |
| User-defined keywords | blogtest |
| Estimated Impact | 538 |
Tree of Dependent Computations | |
| Family? (F = Feedback message, R = changed R code, M = changed R Module, P = changed Parameters, D = changed Data) | |
| - [R console] [correlation test] [2011-03-20 18:02:03] [256f657a32c6b2b7628dddcfa9a822d0] [Current] | |
| Feedback Forum | |
Post a new message | |
Dataset | |
| Dataseries X: | |
-0.0675984304167346 -1.0399970182883 -0.320295845623631 0.487171206608469 -1.02299662429368 0.40659201931 -0.574650498155591 -0.187068117956312 -0.0911487173957396 -0.233078036934972 0.0342052015204809 1.11315968882225 1.08938762610434 0.89901264856618 -0.746328034330336 -0.941869890442842 0.076369218397864 -0.233760540531918 -2.10375665128603 -2.18620892904747 -0.350858849639173 0.552207647572275 -0.983068215908437 -0.675063660804589 0.967783072401814 -1.0705760367181 0.45944775983222 0.408917009582918 0.476216217313324 -0.726085048182128 0.334239375547304 0.914072395590253 0.42855264777743 1.62862592734723 -0.911745787545834 -1.74676351243553 1.20500530136854 -1.06511112973477 -1.0608836961548 1.10027098584825 1.22352540257825 -0.965654736060412 -0.542185536358911 -0.584057427242989 0.33611846355707 0.408132901038393 0.895022441559729 1.10291155875313 1.53139740509936 -0.609999149484703 -0.69049391984899 2.00276131092225 -0.233089471157436 -1.2293794547836 0.137502378098706 1.08964218016502 -1.23639480691591 0.651966721874936 0.142216110054084 -0.72364471377501 -0.844813457124898 0.383679868454521 0.603464986359042 -0.725166447619214 0.391266198484394 0.436010348015264 0.467419007692738 -1.18475816355996 -0.544967729482026 -0.789965924936119 0.263240681346912 -0.40810462709285 -1.68661431820211 -1.4982928140783 -1.06306746266923 -0.584817435073333 0.246407266751722 -1.24810788375352 2.28965407064973 -0.308773598938477 -1.12195446020207 -0.318186320085006 0.155307108615895 0.316004724285236 0.391376598667005 -0.958364806604336 -0.604697818974935 1.91152220466624 1.64823701988704 -1.42200075034027 0.16460515169457 -0.495144271556621 0.2542516494254 -0.22610361652952 0.420654212901216 1.02802143922814 1.72058275190608 -1.43741115477542 -0.459241778515479 2.74604999774729 | |
Tables (Output of Computation) | |
> title = 'my title'


> {
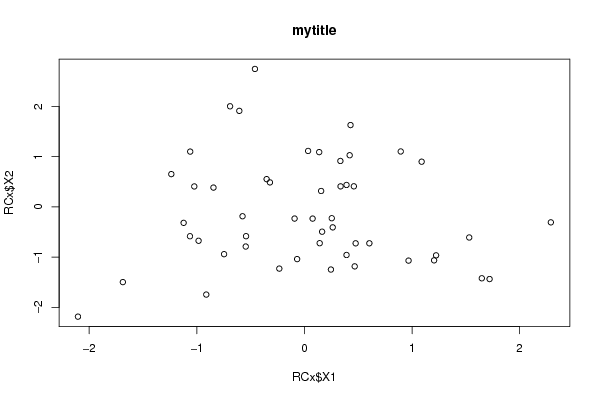
+     plot(RCx$X1, RCx$X2, main = title)
+     res <- cor.test(RCx$X1, RCx$X2)
+     print(res)
+ }

	Pearson's product-moment correlation

data:  RCx$X1 and RCx$X2
t = -0.3879, df = 48, p-value = 0.6998
alternative hypothesis: true correlation is not equal to 0
95 percent confidence interval:
 -0.3291227  0.2259678
sample estimates:
        cor
-0.05589558
| |
Figures (Output of Computation) | |
Input Parameters & R Code | |
| Parameters (Session): | |
| par1 = 'mytitle' ; | |
| Parameters (R input): | |
| R code (body of R function): | |
{ | |