Free Statistics

of Irreproducible Research!

Author's title

Author*The author of this computation has been verified*
R Software Modulerwasp_multipleregression.wasp
Title produced by softwareMultiple Regression
Date of computationSat, 03 Nov 2012 07:06:52 -0400
Cite this page as followsStatistical Computations at FreeStatistics.org, Office for Research Development and Education, URL https://freestatistics.org/blog/index.php?v=date/2012/Nov/03/t1351940844q2aqpmku9cfvktp.htm/, Retrieved Thu, 28 Mar 2024 10:33:46 +0000
Statistical Computations at FreeStatistics.org, Office for Research Development and Education, URL https://freestatistics.org/blog/index.php?pk=185707, Retrieved Thu, 28 Mar 2024 10:33:46 +0000
QR Codes:

Original text written by user:
IsPrivate?No (this computation is public)
User-defined keywords
Estimated Impact113
Family? (F = Feedback message, R = changed R code, M = changed R Module, P = changed Parameters, D = changed Data)
-     [Multiple Regression] [Competence to learn] [2010-11-17 07:43:53] [b98453cac15ba1066b407e146608df68]
- R PD    [Multiple Regression] [Multiple regressi...] [2012-11-03 11:06:52] [a641906195a0eb35087b0121beaccdc9] [Current]
Feedback Forum

Post a new message
Dataseries X:
45.123	27.002	5.144	220	23.045
42.110	29.314	21.427	1.585	32.638
40.434	30.628	8.958	3.922	14.842
41.777	31.355	11.263	4.196	17.489
43.296	31.405	18.729	4.763	25.857
43.141	30.840	30.961	6.388	36.874
44.813	29.189	34.605	9.449	40.780
45.561	30.081	49.515	12.040	52.955
45.613	35.366	64.021	16.370	57.898
43.303	32.606	67.561	20.308	57.950
42.159	28.903	72.191	25.660	59.787


Summary of computational transaction
Raw Inputview raw input (R code)
Raw Outputview raw output of R engine
Computing time6 seconds
R Server'Gertrude Mary Cox' @ cox.wessa.net

\begin{tabular}{lllllllll}
\hline
Summary of computational transaction \tabularnewline
Raw Input & view raw input (R code)  \tabularnewline
Raw Output & view raw output of R engine  \tabularnewline
Computing time & 6 seconds \tabularnewline
R Server & 'Gertrude Mary Cox' @ cox.wessa.net \tabularnewline
\hline
\end{tabular}
%Source: https://freestatistics.org/blog/index.php?pk=185707&T=0

[TABLE]
[ROW][C]Summary of computational transaction[/C][/ROW]
[ROW][C]Raw Input[/C][C]view raw input (R code) [/C][/ROW]
[ROW][C]Raw Output[/C][C]view raw output of R engine [/C][/ROW]
[ROW][C]Computing time[/C][C]6 seconds[/C][/ROW]
[ROW][C]R Server[/C][C]'Gertrude Mary Cox' @ cox.wessa.net[/C][/ROW]
[/TABLE]
Source: https://freestatistics.org/blog/index.php?pk=185707&T=0

Globally Unique Identifier (entire table): ba.freestatistics.org/blog/index.php?pk=185707&T=0

As an alternative you can also use a QR Code:  

The GUIDs for individual cells are displayed in the table below:

Summary of computational transaction
Raw Inputview raw input (R code)
Raw Outputview raw output of R engine
Computing time6 seconds
R Server'Gertrude Mary Cox' @ cox.wessa.net


Multiple Linear Regression - Estimated Regression Equation
Goede_gezinssituatie_België[t] = -47.4242515620179 + 2.10299421534183huwelijk[t] -0.903615524277149echtscheiding[t] + 0.643466733838713verklaring_samenwonend[t] -0.0158173105073099stopzetting_samenwonend[t] + e[t]

\begin{tabular}{lllllllll}
\hline
Multiple Linear Regression - Estimated Regression Equation \tabularnewline
Goede_gezinssituatie_België[t] =  -47.4242515620179 +  2.10299421534183huwelijk[t] -0.903615524277149echtscheiding[t] +  0.643466733838713verklaring_samenwonend[t] -0.0158173105073099stopzetting_samenwonend[t]  + e[t] \tabularnewline
\hline
\end{tabular}
%Source: https://freestatistics.org/blog/index.php?pk=185707&T=1

[TABLE]
[ROW][C]Multiple Linear Regression - Estimated Regression Equation[/C][/ROW]
[ROW][C]Goede_gezinssituatie_België[t] =  -47.4242515620179 +  2.10299421534183huwelijk[t] -0.903615524277149echtscheiding[t] +  0.643466733838713verklaring_samenwonend[t] -0.0158173105073099stopzetting_samenwonend[t]  + e[t][/C][/ROW]
[/TABLE]
Source: https://freestatistics.org/blog/index.php?pk=185707&T=1

Globally Unique Identifier (entire table): ba.freestatistics.org/blog/index.php?pk=185707&T=1

As an alternative you can also use a QR Code:  

The GUIDs for individual cells are displayed in the table below:

Multiple Linear Regression - Estimated Regression Equation
Goede_gezinssituatie_België[t] = -47.4242515620179 + 2.10299421534183huwelijk[t] -0.903615524277149echtscheiding[t] + 0.643466733838713verklaring_samenwonend[t] -0.0158173105073099stopzetting_samenwonend[t] + e[t]


Multiple Linear Regression - Ordinary Least Squares
VariableParameterS.D.T-STATH0: parameter = 02-tail p-value1-tail p-value
(Intercept)-47.424251562017922.997368-2.06220.0848030.042401
huwelijk2.102994215341830.5353963.92790.0077310.003866
echtscheiding-0.9036155242771490.428031-2.11110.0792530.039626
verklaring_samenwonend0.6434667338387130.03561918.06522e-061e-06
stopzetting_samenwonend-0.01581731050730990.016157-0.9790.3654040.182702

\begin{tabular}{lllllllll}
\hline
Multiple Linear Regression - Ordinary Least Squares \tabularnewline
Variable & Parameter & S.D. & T-STATH0: parameter = 0 & 2-tail p-value & 1-tail p-value \tabularnewline
(Intercept) & -47.4242515620179 & 22.997368 & -2.0622 & 0.084803 & 0.042401 \tabularnewline
huwelijk & 2.10299421534183 & 0.535396 & 3.9279 & 0.007731 & 0.003866 \tabularnewline
echtscheiding & -0.903615524277149 & 0.428031 & -2.1111 & 0.079253 & 0.039626 \tabularnewline
verklaring_samenwonend & 0.643466733838713 & 0.035619 & 18.0652 & 2e-06 & 1e-06 \tabularnewline
stopzetting_samenwonend & -0.0158173105073099 & 0.016157 & -0.979 & 0.365404 & 0.182702 \tabularnewline
\hline
\end{tabular}
%Source: https://freestatistics.org/blog/index.php?pk=185707&T=2

[TABLE]
[ROW][C]Multiple Linear Regression - Ordinary Least Squares[/C][/ROW]
[ROW][C]Variable[/C][C]Parameter[/C][C]S.D.[/C][C]T-STATH0: parameter = 0[/C][C]2-tail p-value[/C][C]1-tail p-value[/C][/ROW]
[ROW][C](Intercept)[/C][C]-47.4242515620179[/C][C]22.997368[/C][C]-2.0622[/C][C]0.084803[/C][C]0.042401[/C][/ROW]
[ROW][C]huwelijk[/C][C]2.10299421534183[/C][C]0.535396[/C][C]3.9279[/C][C]0.007731[/C][C]0.003866[/C][/ROW]
[ROW][C]echtscheiding[/C][C]-0.903615524277149[/C][C]0.428031[/C][C]-2.1111[/C][C]0.079253[/C][C]0.039626[/C][/ROW]
[ROW][C]verklaring_samenwonend[/C][C]0.643466733838713[/C][C]0.035619[/C][C]18.0652[/C][C]2e-06[/C][C]1e-06[/C][/ROW]
[ROW][C]stopzetting_samenwonend[/C][C]-0.0158173105073099[/C][C]0.016157[/C][C]-0.979[/C][C]0.365404[/C][C]0.182702[/C][/ROW]
[/TABLE]
Source: https://freestatistics.org/blog/index.php?pk=185707&T=2

Globally Unique Identifier (entire table): ba.freestatistics.org/blog/index.php?pk=185707&T=2

As an alternative you can also use a QR Code:  

The GUIDs for individual cells are displayed in the table below:

Multiple Linear Regression - Ordinary Least Squares
VariableParameterS.D.T-STATH0: parameter = 02-tail p-value1-tail p-value
(Intercept)-47.424251562017922.997368-2.06220.0848030.042401
huwelijk2.102994215341830.5353963.92790.0077310.003866
echtscheiding-0.9036155242771490.428031-2.11110.0792530.039626
verklaring_samenwonend0.6434667338387130.03561918.06522e-061e-06
stopzetting_samenwonend-0.01581731050730990.016157-0.9790.3654040.182702


Multiple Linear Regression - Regression Statistics
Multiple R0.994405230155849
R-squared0.988841761761306
Adjusted R-squared0.981402936268844
F-TEST (value)132.929823768989
F-TEST (DF numerator)4
F-TEST (DF denominator)6
p-value5.51057752251616e-06
Multiple Linear Regression - Residual Statistics
Residual Standard Deviation2.3053152258897
Sum Squared Residuals31.8868697443133

\begin{tabular}{lllllllll}
\hline
Multiple Linear Regression - Regression Statistics \tabularnewline
Multiple R & 0.994405230155849 \tabularnewline
R-squared & 0.988841761761306 \tabularnewline
Adjusted R-squared & 0.981402936268844 \tabularnewline
F-TEST (value) & 132.929823768989 \tabularnewline
F-TEST (DF numerator) & 4 \tabularnewline
F-TEST (DF denominator) & 6 \tabularnewline
p-value & 5.51057752251616e-06 \tabularnewline
Multiple Linear Regression - Residual Statistics \tabularnewline
Residual Standard Deviation & 2.3053152258897 \tabularnewline
Sum Squared Residuals & 31.8868697443133 \tabularnewline
\hline
\end{tabular}
%Source: https://freestatistics.org/blog/index.php?pk=185707&T=3

[TABLE]
[ROW][C]Multiple Linear Regression - Regression Statistics[/C][/ROW]
[ROW][C]Multiple R[/C][C]0.994405230155849[/C][/ROW]
[ROW][C]R-squared[/C][C]0.988841761761306[/C][/ROW]
[ROW][C]Adjusted R-squared[/C][C]0.981402936268844[/C][/ROW]
[ROW][C]F-TEST (value)[/C][C]132.929823768989[/C][/ROW]
[ROW][C]F-TEST (DF numerator)[/C][C]4[/C][/ROW]
[ROW][C]F-TEST (DF denominator)[/C][C]6[/C][/ROW]
[ROW][C]p-value[/C][C]5.51057752251616e-06[/C][/ROW]
[ROW][C]Multiple Linear Regression - Residual Statistics[/C][/ROW]
[ROW][C]Residual Standard Deviation[/C][C]2.3053152258897[/C][/ROW]
[ROW][C]Sum Squared Residuals[/C][C]31.8868697443133[/C][/ROW]
[/TABLE]
Source: https://freestatistics.org/blog/index.php?pk=185707&T=3

Globally Unique Identifier (entire table): ba.freestatistics.org/blog/index.php?pk=185707&T=3

As an alternative you can also use a QR Code:  

The GUIDs for individual cells are displayed in the table below:

Multiple Linear Regression - Regression Statistics
Multiple R0.994405230155849
R-squared0.988841761761306
Adjusted R-squared0.981402936268844
F-TEST (value)132.929823768989
F-TEST (DF numerator)4
F-TEST (DF denominator)6
p-value5.51057752251616e-06
Multiple Linear Regression - Residual Statistics
Residual Standard Deviation2.3053152258897
Sum Squared Residuals31.8868697443133


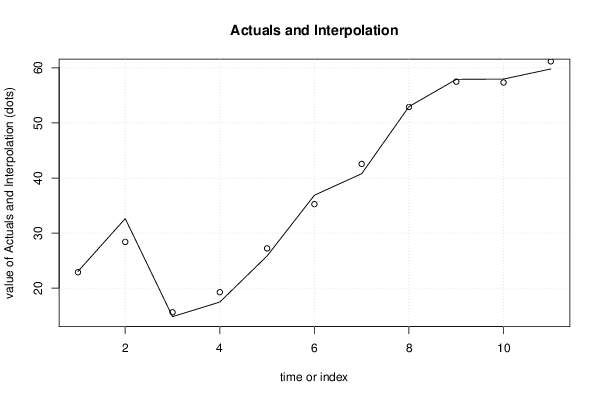
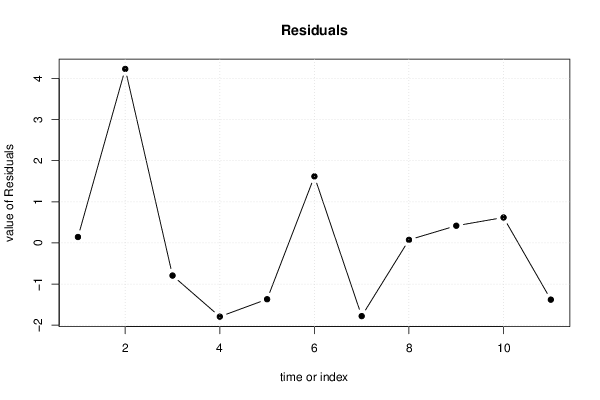
Multiple Linear Regression - Actuals, Interpolation, and Residuals
Time or IndexActualsInterpolationForecastResidualsPrediction Error
123.04522.8999145975780.145085402422028
232.63828.40674063617414.23125936382587
314.84215.6344197734706-0.792419773470551
417.48919.2806693969444-1.79166939694437
525.85727.2250910536169-1.36809105361694
636.87435.25485168019631.6191483198037
740.7842.5593032294748-1.77930322947481
852.95552.8794242049060.0755757950939548
957.89857.47881134486680.419188655133197
1057.9557.33045722344340.619542776556634
1159.78761.1653168593287-1.37831685932872

\begin{tabular}{lllllllll}
\hline
Multiple Linear Regression - Actuals, Interpolation, and Residuals \tabularnewline
Time or Index & Actuals & InterpolationForecast & ResidualsPrediction Error \tabularnewline
1 & 23.045 & 22.899914597578 & 0.145085402422028 \tabularnewline
2 & 32.638 & 28.4067406361741 & 4.23125936382587 \tabularnewline
3 & 14.842 & 15.6344197734706 & -0.792419773470551 \tabularnewline
4 & 17.489 & 19.2806693969444 & -1.79166939694437 \tabularnewline
5 & 25.857 & 27.2250910536169 & -1.36809105361694 \tabularnewline
6 & 36.874 & 35.2548516801963 & 1.6191483198037 \tabularnewline
7 & 40.78 & 42.5593032294748 & -1.77930322947481 \tabularnewline
8 & 52.955 & 52.879424204906 & 0.0755757950939548 \tabularnewline
9 & 57.898 & 57.4788113448668 & 0.419188655133197 \tabularnewline
10 & 57.95 & 57.3304572234434 & 0.619542776556634 \tabularnewline
11 & 59.787 & 61.1653168593287 & -1.37831685932872 \tabularnewline
\hline
\end{tabular}
%Source: https://freestatistics.org/blog/index.php?pk=185707&T=4

[TABLE]
[ROW][C]Multiple Linear Regression - Actuals, Interpolation, and Residuals[/C][/ROW]
[ROW][C]Time or Index[/C][C]Actuals[/C][C]InterpolationForecast[/C][C]ResidualsPrediction Error[/C][/ROW]
[ROW][C]1[/C][C]23.045[/C][C]22.899914597578[/C][C]0.145085402422028[/C][/ROW]
[ROW][C]2[/C][C]32.638[/C][C]28.4067406361741[/C][C]4.23125936382587[/C][/ROW]
[ROW][C]3[/C][C]14.842[/C][C]15.6344197734706[/C][C]-0.792419773470551[/C][/ROW]
[ROW][C]4[/C][C]17.489[/C][C]19.2806693969444[/C][C]-1.79166939694437[/C][/ROW]
[ROW][C]5[/C][C]25.857[/C][C]27.2250910536169[/C][C]-1.36809105361694[/C][/ROW]
[ROW][C]6[/C][C]36.874[/C][C]35.2548516801963[/C][C]1.6191483198037[/C][/ROW]
[ROW][C]7[/C][C]40.78[/C][C]42.5593032294748[/C][C]-1.77930322947481[/C][/ROW]
[ROW][C]8[/C][C]52.955[/C][C]52.879424204906[/C][C]0.0755757950939548[/C][/ROW]
[ROW][C]9[/C][C]57.898[/C][C]57.4788113448668[/C][C]0.419188655133197[/C][/ROW]
[ROW][C]10[/C][C]57.95[/C][C]57.3304572234434[/C][C]0.619542776556634[/C][/ROW]
[ROW][C]11[/C][C]59.787[/C][C]61.1653168593287[/C][C]-1.37831685932872[/C][/ROW]
[/TABLE]
Source: https://freestatistics.org/blog/index.php?pk=185707&T=4

Globally Unique Identifier (entire table): ba.freestatistics.org/blog/index.php?pk=185707&T=4

As an alternative you can also use a QR Code:  

The GUIDs for individual cells are displayed in the table below:

Multiple Linear Regression - Actuals, Interpolation, and Residuals
Time or IndexActualsInterpolationForecastResidualsPrediction Error
123.04522.8999145975780.145085402422028
232.63828.40674063617414.23125936382587
314.84215.6344197734706-0.792419773470551
417.48919.2806693969444-1.79166939694437
525.85727.2250910536169-1.36809105361694
636.87435.25485168019631.6191483198037
740.7842.5593032294748-1.77930322947481
852.95552.8794242049060.0755757950939548
957.89857.47881134486680.419188655133197
1057.9557.33045722344340.619542776556634
1159.78761.1653168593287-1.37831685932872


Parameters (Session):
par1 = 5 ; par2 = Do not include Seasonal Dummies ; par3 = No Linear Trend ;
Parameters (R input):
par1 = 5 ; par2 = Do not include Seasonal Dummies ; par3 = No Linear Trend ;
R code (references can be found in the software module):
library(lattice)
library(lmtest)
n25 <- 25 #minimum number of obs. for Goldfeld-Quandt test
par1 <- as.numeric(par1)
x <- t(y)
k <- length(x[1,])
n <- length(x[,1])
x1 <- cbind(x[,par1], x[,1:k!=par1])
mycolnames <- c(colnames(x)[par1], colnames(x)[1:k!=par1])
colnames(x1) <- mycolnames #colnames(x)[par1]
x <- x1
if (par3 == 'First Differences'){
x2 <- array(0, dim=c(n-1,k), dimnames=list(1:(n-1), paste('(1-B)',colnames(x),sep='')))
for (i in 1:n-1) {
for (j in 1:k) {
x2[i,j] <- x[i+1,j] - x[i,j]
}
}
x <- x2
}
if (par2 == 'Include Monthly Dummies'){
x2 <- array(0, dim=c(n,11), dimnames=list(1:n, paste('M', seq(1:11), sep ='')))
for (i in 1:11){
x2[seq(i,n,12),i] <- 1
}
x <- cbind(x, x2)
}
if (par2 == 'Include Quarterly Dummies'){
x2 <- array(0, dim=c(n,3), dimnames=list(1:n, paste('Q', seq(1:3), sep ='')))
for (i in 1:3){
x2[seq(i,n,4),i] <- 1
}
x <- cbind(x, x2)
}
k <- length(x[1,])
if (par3 == 'Linear Trend'){
x <- cbind(x, c(1:n))
colnames(x)[k+1] <- 't'
}
x
k <- length(x[1,])
df <- as.data.frame(x)
(mylm <- lm(df))
(mysum <- summary(mylm))
if (n > n25) {
kp3 <- k + 3
nmkm3 <- n - k - 3
gqarr <- array(NA, dim=c(nmkm3-kp3+1,3))
numgqtests <- 0
numsignificant1 <- 0
numsignificant5 <- 0
numsignificant10 <- 0
for (mypoint in kp3:nmkm3) {
j <- 0
numgqtests <- numgqtests + 1
for (myalt in c('greater', 'two.sided', 'less')) {
j <- j + 1
gqarr[mypoint-kp3+1,j] <- gqtest(mylm, point=mypoint, alternative=myalt)$p.value
}
if (gqarr[mypoint-kp3+1,2] < 0.01) numsignificant1 <- numsignificant1 + 1
if (gqarr[mypoint-kp3+1,2] < 0.05) numsignificant5 <- numsignificant5 + 1
if (gqarr[mypoint-kp3+1,2] < 0.10) numsignificant10 <- numsignificant10 + 1
}
gqarr
}
bitmap(file='test0.png')
plot(x[,1], type='l', main='Actuals and Interpolation', ylab='value of Actuals and Interpolation (dots)', xlab='time or index')
points(x[,1]-mysum$resid)
grid()
dev.off()
bitmap(file='test1.png')
plot(mysum$resid, type='b', pch=19, main='Residuals', ylab='value of Residuals', xlab='time or index')
grid()
dev.off()
bitmap(file='test2.png')
hist(mysum$resid, main='Residual Histogram', xlab='values of Residuals')
grid()
dev.off()
bitmap(file='test3.png')
densityplot(~mysum$resid,col='black',main='Residual Density Plot', xlab='values of Residuals')
dev.off()
bitmap(file='test4.png')
qqnorm(mysum$resid, main='Residual Normal Q-Q Plot')
qqline(mysum$resid)
grid()
dev.off()
(myerror <- as.ts(mysum$resid))
bitmap(file='test5.png')
dum <- cbind(lag(myerror,k=1),myerror)
dum
dum1 <- dum[2:length(myerror),]
dum1
z <- as.data.frame(dum1)
z
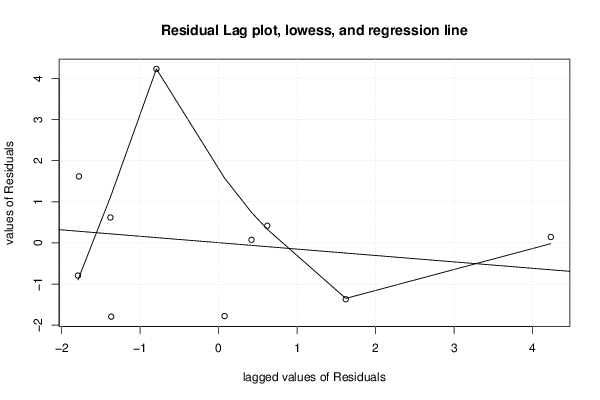
plot(z,main=paste('Residual Lag plot, lowess, and regression line'), ylab='values of Residuals', xlab='lagged values of Residuals')
lines(lowess(z))
abline(lm(z))
grid()
dev.off()
bitmap(file='test6.png')
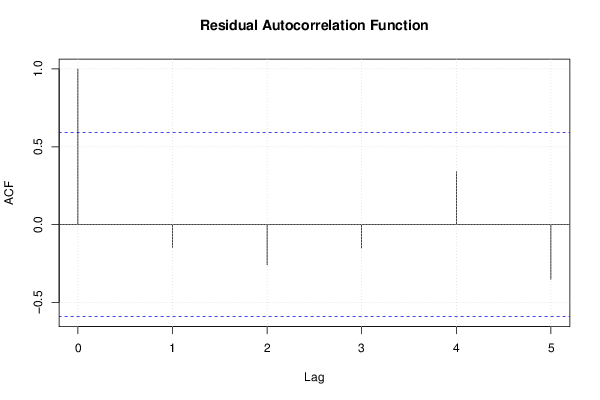
acf(mysum$resid, lag.max=length(mysum$resid)/2, main='Residual Autocorrelation Function')
grid()
dev.off()
bitmap(file='test7.png')
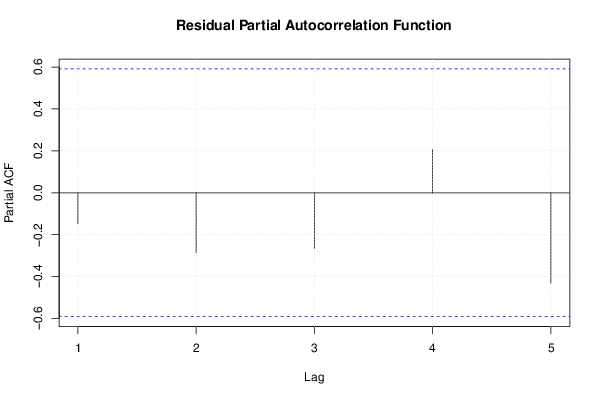
pacf(mysum$resid, lag.max=length(mysum$resid)/2, main='Residual Partial Autocorrelation Function')
grid()
dev.off()
bitmap(file='test8.png')
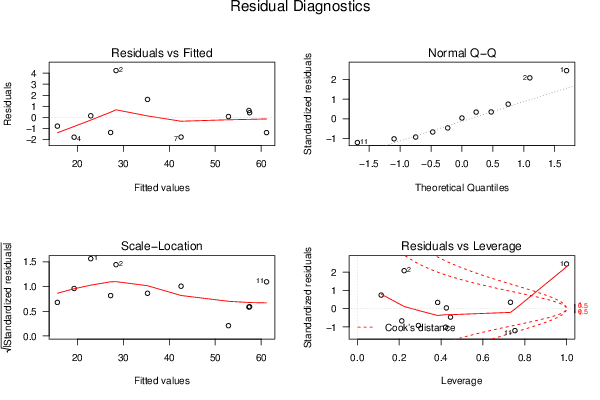
opar <- par(mfrow = c(2,2), oma = c(0, 0, 1.1, 0))
plot(mylm, las = 1, sub='Residual Diagnostics')
par(opar)
dev.off()
if (n > n25) {
bitmap(file='test9.png')
plot(kp3:nmkm3,gqarr[,2], main='Goldfeld-Quandt test',ylab='2-sided p-value',xlab='breakpoint')
grid()
dev.off()
}
load(file='createtable')
a<-table.start()
a<-table.row.start(a)
a<-table.element(a, 'Multiple Linear Regression - Estimated Regression Equation', 1, TRUE)
a<-table.row.end(a)
myeq <- colnames(x)[1]
myeq <- paste(myeq, '[t] = ', sep='')
for (i in 1:k){
if (mysum$coefficients[i,1] > 0) myeq <- paste(myeq, '+', '')
myeq <- paste(myeq, mysum$coefficients[i,1], sep=' ')
if (rownames(mysum$coefficients)[i] != '(Intercept)') {
myeq <- paste(myeq, rownames(mysum$coefficients)[i], sep='')
if (rownames(mysum$coefficients)[i] != 't') myeq <- paste(myeq, '[t]', sep='')
}
}
myeq <- paste(myeq, ' + e[t]')
a<-table.row.start(a)
a<-table.element(a, myeq)
a<-table.row.end(a)
a<-table.end(a)
table.save(a,file='mytable1.tab')
a<-table.start()
a<-table.row.start(a)
a<-table.element(a,hyperlink('ols1.htm','Multiple Linear Regression - Ordinary Least Squares',''), 6, TRUE)
a<-table.row.end(a)
a<-table.row.start(a)
a<-table.element(a,'Variable',header=TRUE)
a<-table.element(a,'Parameter',header=TRUE)
a<-table.element(a,'S.D.',header=TRUE)
a<-table.element(a,'T-STAT
H0: parameter = 0',header=TRUE)
a<-table.element(a,'2-tail p-value',header=TRUE)
a<-table.element(a,'1-tail p-value',header=TRUE)
a<-table.row.end(a)
for (i in 1:k){
a<-table.row.start(a)
a<-table.element(a,rownames(mysum$coefficients)[i],header=TRUE)
a<-table.element(a,mysum$coefficients[i,1])
a<-table.element(a, round(mysum$coefficients[i,2],6))
a<-table.element(a, round(mysum$coefficients[i,3],4))
a<-table.element(a, round(mysum$coefficients[i,4],6))
a<-table.element(a, round(mysum$coefficients[i,4]/2,6))
a<-table.row.end(a)
}
a<-table.end(a)
table.save(a,file='mytable2.tab')
a<-table.start()
a<-table.row.start(a)
a<-table.element(a, 'Multiple Linear Regression - Regression Statistics', 2, TRUE)
a<-table.row.end(a)
a<-table.row.start(a)
a<-table.element(a, 'Multiple R',1,TRUE)
a<-table.element(a, sqrt(mysum$r.squared))
a<-table.row.end(a)
a<-table.row.start(a)
a<-table.element(a, 'R-squared',1,TRUE)
a<-table.element(a, mysum$r.squared)
a<-table.row.end(a)
a<-table.row.start(a)
a<-table.element(a, 'Adjusted R-squared',1,TRUE)
a<-table.element(a, mysum$adj.r.squared)
a<-table.row.end(a)
a<-table.row.start(a)
a<-table.element(a, 'F-TEST (value)',1,TRUE)
a<-table.element(a, mysum$fstatistic[1])
a<-table.row.end(a)
a<-table.row.start(a)
a<-table.element(a, 'F-TEST (DF numerator)',1,TRUE)
a<-table.element(a, mysum$fstatistic[2])
a<-table.row.end(a)
a<-table.row.start(a)
a<-table.element(a, 'F-TEST (DF denominator)',1,TRUE)
a<-table.element(a, mysum$fstatistic[3])
a<-table.row.end(a)
a<-table.row.start(a)
a<-table.element(a, 'p-value',1,TRUE)
a<-table.element(a, 1-pf(mysum$fstatistic[1],mysum$fstatistic[2],mysum$fstatistic[3]))
a<-table.row.end(a)
a<-table.row.start(a)
a<-table.element(a, 'Multiple Linear Regression - Residual Statistics', 2, TRUE)
a<-table.row.end(a)
a<-table.row.start(a)
a<-table.element(a, 'Residual Standard Deviation',1,TRUE)
a<-table.element(a, mysum$sigma)
a<-table.row.end(a)
a<-table.row.start(a)
a<-table.element(a, 'Sum Squared Residuals',1,TRUE)
a<-table.element(a, sum(myerror*myerror))
a<-table.row.end(a)
a<-table.end(a)
table.save(a,file='mytable3.tab')
a<-table.start()
a<-table.row.start(a)
a<-table.element(a, 'Multiple Linear Regression - Actuals, Interpolation, and Residuals', 4, TRUE)
a<-table.row.end(a)
a<-table.row.start(a)
a<-table.element(a, 'Time or Index', 1, TRUE)
a<-table.element(a, 'Actuals', 1, TRUE)
a<-table.element(a, 'Interpolation
Forecast', 1, TRUE)
a<-table.element(a, 'Residuals
Prediction Error', 1, TRUE)
a<-table.row.end(a)
for (i in 1:n) {
a<-table.row.start(a)
a<-table.element(a,i, 1, TRUE)
a<-table.element(a,x[i])
a<-table.element(a,x[i]-mysum$resid[i])
a<-table.element(a,mysum$resid[i])
a<-table.row.end(a)
}
a<-table.end(a)
table.save(a,file='mytable4.tab')
if (n > n25) {
a<-table.start()
a<-table.row.start(a)
a<-table.element(a,'Goldfeld-Quandt test for Heteroskedasticity',4,TRUE)
a<-table.row.end(a)
a<-table.row.start(a)
a<-table.element(a,'p-values',header=TRUE)
a<-table.element(a,'Alternative Hypothesis',3,header=TRUE)
a<-table.row.end(a)
a<-table.row.start(a)
a<-table.element(a,'breakpoint index',header=TRUE)
a<-table.element(a,'greater',header=TRUE)
a<-table.element(a,'2-sided',header=TRUE)
a<-table.element(a,'less',header=TRUE)
a<-table.row.end(a)
for (mypoint in kp3:nmkm3) {
a<-table.row.start(a)
a<-table.element(a,mypoint,header=TRUE)
a<-table.element(a,gqarr[mypoint-kp3+1,1])
a<-table.element(a,gqarr[mypoint-kp3+1,2])
a<-table.element(a,gqarr[mypoint-kp3+1,3])
a<-table.row.end(a)
}
a<-table.end(a)
table.save(a,file='mytable5.tab')
a<-table.start()
a<-table.row.start(a)
a<-table.element(a,'Meta Analysis of Goldfeld-Quandt test for Heteroskedasticity',4,TRUE)
a<-table.row.end(a)
a<-table.row.start(a)
a<-table.element(a,'Description',header=TRUE)
a<-table.element(a,'# significant tests',header=TRUE)
a<-table.element(a,'% significant tests',header=TRUE)
a<-table.element(a,'OK/NOK',header=TRUE)
a<-table.row.end(a)
a<-table.row.start(a)
a<-table.element(a,'1% type I error level',header=TRUE)
a<-table.element(a,numsignificant1)
a<-table.element(a,numsignificant1/numgqtests)
if (numsignificant1/numgqtests < 0.01) dum <- 'OK' else dum <- 'NOK'
a<-table.element(a,dum)
a<-table.row.end(a)
a<-table.row.start(a)
a<-table.element(a,'5% type I error level',header=TRUE)
a<-table.element(a,numsignificant5)
a<-table.element(a,numsignificant5/numgqtests)
if (numsignificant5/numgqtests < 0.05) dum <- 'OK' else dum <- 'NOK'
a<-table.element(a,dum)
a<-table.row.end(a)
a<-table.row.start(a)
a<-table.element(a,'10% type I error level',header=TRUE)
a<-table.element(a,numsignificant10)
a<-table.element(a,numsignificant10/numgqtests)
if (numsignificant10/numgqtests < 0.1) dum <- 'OK' else dum <- 'NOK'
a<-table.element(a,dum)
a<-table.row.end(a)
a<-table.end(a)
table.save(a,file='mytable6.tab')
}