Free Statistics
of Irreproducible Research!


Description of Statistical Computation | |||||||||||||||||||||||||||||||||||||||||||||||||||||||||||||||||
|---|---|---|---|---|---|---|---|---|---|---|---|---|---|---|---|---|---|---|---|---|---|---|---|---|---|---|---|---|---|---|---|---|---|---|---|---|---|---|---|---|---|---|---|---|---|---|---|---|---|---|---|---|---|---|---|---|---|---|---|---|---|---|---|---|---|
| Author's title | |||||||||||||||||||||||||||||||||||||||||||||||||||||||||||||||||
| Author | *The author of this computation has been verified* | ||||||||||||||||||||||||||||||||||||||||||||||||||||||||||||||||
| R Software Module | rwasp_Tests to Compare Two Means.wasp | ||||||||||||||||||||||||||||||||||||||||||||||||||||||||||||||||
| Title produced by software | T-Tests | ||||||||||||||||||||||||||||||||||||||||||||||||||||||||||||||||
| Date of computation | Sat, 03 Nov 2012 20:17:58 -0400 | ||||||||||||||||||||||||||||||||||||||||||||||||||||||||||||||||
| Cite this page as follows | Statistical Computations at FreeStatistics.org, Office for Research Development and Education, URL https://freestatistics.org/blog/index.php?v=date/2012/Nov/03/t135198829100xxxlgedyth6pz.htm/, Retrieved Thu, 03 Jul 2025 16:06:01 +0000 | ||||||||||||||||||||||||||||||||||||||||||||||||||||||||||||||||
| Statistical Computations at FreeStatistics.org, Office for Research Development and Education, URL https://freestatistics.org/blog/index.php?pk=185771, Retrieved Thu, 03 Jul 2025 16:06:01 +0000 | |||||||||||||||||||||||||||||||||||||||||||||||||||||||||||||||||
| QR Codes: | |||||||||||||||||||||||||||||||||||||||||||||||||||||||||||||||||
|
| |||||||||||||||||||||||||||||||||||||||||||||||||||||||||||||||||
| Original text written by user: | |||||||||||||||||||||||||||||||||||||||||||||||||||||||||||||||||
| IsPrivate? | No (this computation is public) | ||||||||||||||||||||||||||||||||||||||||||||||||||||||||||||||||
| User-defined keywords | |||||||||||||||||||||||||||||||||||||||||||||||||||||||||||||||||
| Estimated Impact | 219 | ||||||||||||||||||||||||||||||||||||||||||||||||||||||||||||||||
Tree of Dependent Computations | |||||||||||||||||||||||||||||||||||||||||||||||||||||||||||||||||
| Family? (F = Feedback message, R = changed R code, M = changed R Module, P = changed Parameters, D = changed Data) | |||||||||||||||||||||||||||||||||||||||||||||||||||||||||||||||||
| - [Aston University Statistical Software] [Morning Sickness ...] [2009-11-16 16:26:06] [74be16979710d4c4e7c6647856088456] - R [Aston University Statistical Software] [Morning Sickness ...] [2009-11-16 17:22:16] [74be16979710d4c4e7c6647856088456] - P [T-Tests] [Morning Sickness ...] [2010-11-09 11:12:43] [3fdd735c61ad38cbc9b3393dc997cdb7] - RM [T-Tests] [Morning Sickness ...] [2011-11-07 09:34:35] [98fd0e87c3eb04e0cc2efde01dbafab6] - R P [T-Tests] [T- test] [2012-10-29 15:33:11] [47982bab1b21f7e04987328ecb1c3458] - P [T-Tests] [] [2012-11-04 00:17:58] [ea99e61d761e3afc17f8bda1c0d13b86] [Current] | |||||||||||||||||||||||||||||||||||||||||||||||||||||||||||||||||
| Feedback Forum | |||||||||||||||||||||||||||||||||||||||||||||||||||||||||||||||||
Post a new message | |||||||||||||||||||||||||||||||||||||||||||||||||||||||||||||||||
Dataset | |||||||||||||||||||||||||||||||||||||||||||||||||||||||||||||||||
| Dataseries X: | |||||||||||||||||||||||||||||||||||||||||||||||||||||||||||||||||
68.95 70.18 70.84 69.94 70.26 69.61 70.93 71.39 70.71 72.54 70.73 70.48 70.20 70.48 69.76 71.68 71.46 70.59 70.31 71.61 69.24 70.56 70.94 72.74 68.98 72.63 71.16 71.58 69.96 70.14 69.66 71.22 70.20 70.72 69.99 71.37 71.97 69.73 68.29 71.29 67.67 73.19 70.07 70.64 70.89 69.30 69.66 71.76 71.12 70.28 70.60 69.77 70.09 70.37 70.55 71.70 71.63 70.85 69.30 71.07 | |||||||||||||||||||||||||||||||||||||||||||||||||||||||||||||||||
Tables (Output of Computation) | |||||||||||||||||||||||||||||||||||||||||||||||||||||||||||||||||
\begin{tabular}{lllllllll}
\hline
Summary of computational transaction \tabularnewline
Raw Input & view raw input (R code)  \tabularnewline
Raw Output & view raw output of R engine  \tabularnewline
Computing time & 1 seconds \tabularnewline
R Server & 'Gwilym Jenkins' @ jenkins.wessa.net \tabularnewline
\hline
\end{tabular}
%Source: https://freestatistics.org/blog/index.php?pk=185771&T=0
[TABLE] [ROW][C]Summary of computational transaction[/C][/ROW] [ROW][C]Raw Input[/C][C]view raw input (R code) [/C][/ROW] [ROW][C]Raw Output[/C][C]view raw output of R engine [/C][/ROW] [ROW][C]Computing time[/C][C]1 seconds[/C][/ROW] [ROW][C]R Server[/C][C]'Gwilym Jenkins' @ jenkins.wessa.net[/C][/ROW] [/TABLE] Source: https://freestatistics.org/blog/index.php?pk=185771&T=0
Globally Unique Identifier (entire table): ba.freestatistics.org/blog/index.php?pk=185771&T=0
As an alternative you can also use a QR Code: The GUIDs for individual cells are displayed in the table below:
\begin{tabular}{lllllllll}
\hline
T-Test \tabularnewline
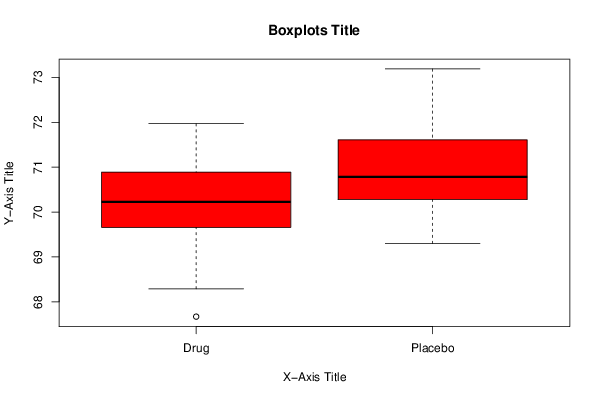
Mean1 & 70.204 \tabularnewline
Mean2 & 70.98033 \tabularnewline
T Statistic & -3.08443 \tabularnewline
P-value & 0.00312 \tabularnewline
Lower Confidence Limit & -1.28016 \tabularnewline
Upper Confidence Limit & -0.27251 \tabularnewline
\hline
\end{tabular}
%Source: https://freestatistics.org/blog/index.php?pk=185771&T=1[TABLE] [ROW][C]T-Test[/C][/ROW] [ROW][C]Mean1[/C][C]70.204[/C][/ROW] [ROW][C]Mean2[/C][C]70.98033[/C][/ROW] [ROW][C]T Statistic[/C][C]-3.08443[/C][/ROW] [ROW][C]P-value[/C][C]0.00312[/C][/ROW] [ROW][C]Lower Confidence Limit[/C][C]-1.28016[/C][/ROW] [ROW][C]Upper Confidence Limit[/C][C]-0.27251[/C][/ROW] [/TABLE] Source: https://freestatistics.org/blog/index.php?pk=185771&T=1
Globally Unique Identifier (entire table): ba.freestatistics.org/blog/index.php?pk=185771&T=1
As an alternative you can also use a QR Code: The GUIDs for individual cells are displayed in the table below:
\begin{tabular}{lllllllll}
\hline
Standard Deviations \tabularnewline
Variable 1 & 0.96628 \tabularnewline
Variable 2 & 0.98326 \tabularnewline
\hline
\end{tabular}
%Source: https://freestatistics.org/blog/index.php?pk=185771&T=2
[TABLE] [ROW][C]Standard Deviations[/C][/ROW] [ROW][C]Variable 1[/C][C]0.96628[/C][/ROW] [ROW][C]Variable 2[/C][C]0.98326[/C][/ROW] [/TABLE] Source: https://freestatistics.org/blog/index.php?pk=185771&T=2
Globally Unique Identifier (entire table): ba.freestatistics.org/blog/index.php?pk=185771&T=2
As an alternative you can also use a QR Code: The GUIDs for individual cells are displayed in the table below:
| |||||||||||||||||||||||||||||||||||||||||||||||||||||||||||||||||
Figures (Output of Computation) | |||||||||||||||||||||||||||||||||||||||||||||||||||||||||||||||||
Input Parameters & R Code | |||||||||||||||||||||||||||||||||||||||||||||||||||||||||||||||||
| Parameters (Session): | |||||||||||||||||||||||||||||||||||||||||||||||||||||||||||||||||
| par1 = two.sided ; par2 = 1 ; par3 = 2 ; par4 = T-Test ; par5 = unpaired ; par6 = 0.0 ; par7 = 0.95 ; par8 = TRUE ; | |||||||||||||||||||||||||||||||||||||||||||||||||||||||||||||||||
| Parameters (R input): | |||||||||||||||||||||||||||||||||||||||||||||||||||||||||||||||||
| par1 = two.sided ; par2 = 1 ; par3 = 2 ; par4 = T-Test ; par5 = unpaired ; par6 = 0.0 ; par7 = 0.95 ; par8 = TRUE ; | |||||||||||||||||||||||||||||||||||||||||||||||||||||||||||||||||
| R code (references can be found in the software module): | |||||||||||||||||||||||||||||||||||||||||||||||||||||||||||||||||
par2 <- as.numeric(par2) | |||||||||||||||||||||||||||||||||||||||||||||||||||||||||||||||||