Free Statistics
of Irreproducible Research!
Description of Statistical Computation | ||||||||||||||||||||||||||||||
|---|---|---|---|---|---|---|---|---|---|---|---|---|---|---|---|---|---|---|---|---|---|---|---|---|---|---|---|---|---|---|
| Author's title | ||||||||||||||||||||||||||||||
| Author | *The author of this computation has been verified* | |||||||||||||||||||||||||||||
| R Software Module | rwasp_Distributional Plots.wasp | |||||||||||||||||||||||||||||
| Title produced by software | Histogram, QQplot and Density | |||||||||||||||||||||||||||||
| Date of computation | Thu, 15 Nov 2012 12:46:08 -0500 | |||||||||||||||||||||||||||||
| Cite this page as follows | Statistical Computations at FreeStatistics.org, Office for Research Development and Education, URL https://freestatistics.org/blog/index.php?v=date/2012/Nov/15/t13530015838uqxca10i2ukl9g.htm/, Retrieved Mon, 03 Aug 2026 13:39:08 +0000 | |||||||||||||||||||||||||||||
| Statistical Computations at FreeStatistics.org, Office for Research Development and Education, URL https://freestatistics.org/blog/index.php?pk=189739, Retrieved Mon, 03 Aug 2026 13:39:08 +0000 | ||||||||||||||||||||||||||||||
| QR Codes: | ||||||||||||||||||||||||||||||
|
| ||||||||||||||||||||||||||||||
| Original text written by user: | ||||||||||||||||||||||||||||||
| IsPrivate? | No (this computation is public) | |||||||||||||||||||||||||||||
| User-defined keywords | ||||||||||||||||||||||||||||||
| Estimated Impact | 389 | |||||||||||||||||||||||||||||
Tree of Dependent Computations | ||||||||||||||||||||||||||||||
| Family? (F = Feedback message, R = changed R code, M = changed R Module, P = changed Parameters, D = changed Data) | ||||||||||||||||||||||||||||||
| - [Histogram, QQplot and Density] [Pregnancy] [2012-11-15 16:45:34] [fdf4304d806d0d9051820b7e5467ca18] - RMPD [Correlation] [Pregnancy] [2012-11-15 16:56:08] [fdf4304d806d0d9051820b7e5467ca18] - RMPD [Histogram, QQplot and Density] [asgf] [2012-11-15 17:14:16] [fdf4304d806d0d9051820b7e5467ca18] - R D [Histogram, QQplot and Density] [Compmemomean ] [2012-11-15 17:24:16] [fdf4304d806d0d9051820b7e5467ca18] - D [Histogram, QQplot and Density] [Compmemomean ] [2012-11-15 17:37:43] [fdf4304d806d0d9051820b7e5467ca18] - D [Histogram, QQplot and Density] [Compattenmean ] [2012-11-15 17:40:02] [fdf4304d806d0d9051820b7e5467ca18] - D [Histogram, QQplot and Density] [compappliedmean ] [2012-11-15 17:42:22] [fdf4304d806d0d9051820b7e5467ca18] - D [Histogram, QQplot and Density] [Specmemmean ] [2012-11-15 17:46:08] [01d189c67e410f55b92337d59f7551a8] [Current] | ||||||||||||||||||||||||||||||
| Feedback Forum | ||||||||||||||||||||||||||||||
Post a new message | ||||||||||||||||||||||||||||||
Dataset | ||||||||||||||||||||||||||||||
| Dataseries X: | ||||||||||||||||||||||||||||||
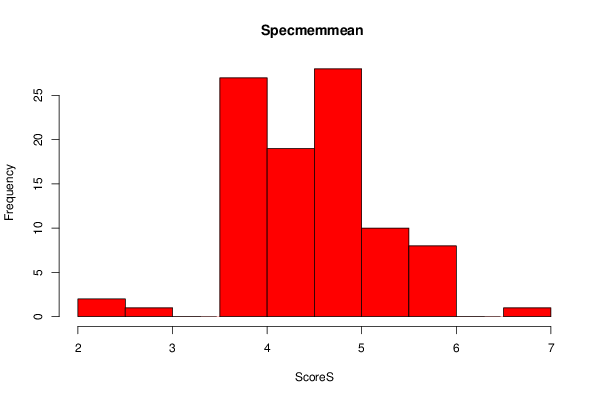
4.6 5.6 4 5 4.4 6 4 4.4 4.6 4 4.8 5.333333333 4.4 5.2 5.2 4 5.2 4.8 4 4.4 5.6 6 4.8 4.2 4 2.8 4.8 4.2 4.8 5.2 4.6 4.4 4 3.6 4.6 4 2.2 4 5.6 3.6 4 5.4 5 4.4 4.6 3.8 4.25 4.6 5.2 4 4.2 4.2 4.6 5.6 5.4 4 3.6 4.4 4.6 4.4 4 5 4.8 4 4.6 4 5 4.2 4.8 6.8 4 4.2 5 5 4.6 4.8 5 4.2 4 4 3.8 4.6 4 4.2 5.6 4 5.6 3.8 5 5.4 5 4.4 4.4 4 5.4 2.2 | ||||||||||||||||||||||||||||||
Tables (Output of Computation) | ||||||||||||||||||||||||||||||
| ||||||||||||||||||||||||||||||
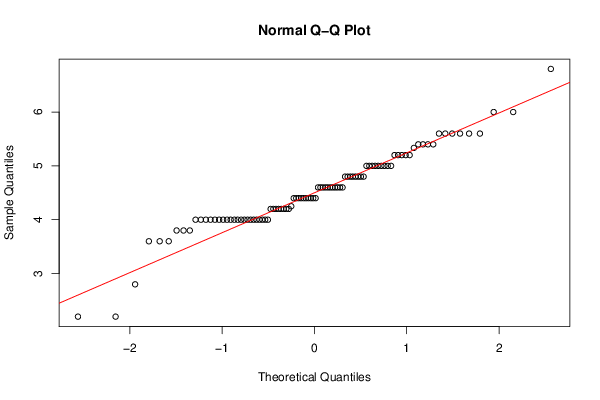
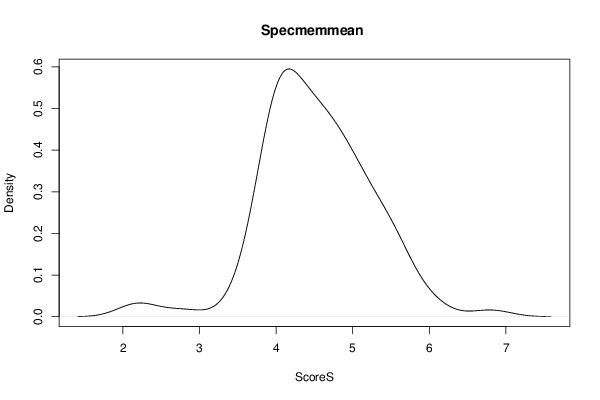
Figures (Output of Computation) | ||||||||||||||||||||||||||||||
Input Parameters & R Code | ||||||||||||||||||||||||||||||
| Parameters (Session): | ||||||||||||||||||||||||||||||
| par1 = 10 ; | ||||||||||||||||||||||||||||||
| Parameters (R input): | ||||||||||||||||||||||||||||||
| par1 = 10 ; | ||||||||||||||||||||||||||||||
| R code (references can be found in the software module): | ||||||||||||||||||||||||||||||
x <- x[!is.na(x)] | ||||||||||||||||||||||||||||||