par1 <- as.numeric(par1) #column number of first sample
par2 <- as.numeric(par2) #column number of second sample
par3 <- as.numeric(par3) #confidence (= 1 - alpha)
if (par5 == 'unpaired') paired <- FALSE else paired <- TRUE
par6 <- as.numeric(par6) #H0
z <- t(y)
if (par1 == par2) stop('Please, select two different column numbers')
if (par1 < 1) stop('Please, select a column number greater than zero for the first sample')
if (par2 < 1) stop('Please, select a column number greater than zero for the second sample')
if (par1 > length(z[1,])) stop('The column number for the first sample should be smaller')
if (par2 > length(z[1,])) stop('The column number for the second sample should be smaller')
if (par3 <= 0) stop('The confidence level should be larger than zero')
if (par3 >= 1) stop('The confidence level should be smaller than zero')
(r.t <- t.test(z[,par1],z[,par2],var.equal=TRUE,alternative=par4,paired=paired,mu=par6,conf.level=par3))
(v.t <- var.test(z[,par1],z[,par2],conf.level=par3))
(r.w <- t.test(z[,par1],z[,par2],var.equal=FALSE,alternative=par4,paired=paired,mu=par6,conf.level=par3))
(w.t <- wilcox.test(z[,par1],z[,par2],alternative=par4,paired=paired,mu=par6,conf.level=par3))
(ks.t <- ks.test(z[,par1],z[,par2],alternative=par4))
m1 <- mean(z[,par1],na.rm=T)
m2 <- mean(z[,par2],na.rm=T)
mdiff <- m1 - m2
newsam1 <- z[!is.na(z[,par1]),par1]
newsam2 <- z[,par2]+mdiff
newsam2 <- newsam2[!is.na(newsam2)]
(ks1.t <- ks.test(newsam1,newsam2,alternative=par4))
mydf <- data.frame(cbind(z[,par1],z[,par2]))
colnames(mydf) <- c('Variable 1','Variable 2')
bitmap(file='test1.png')
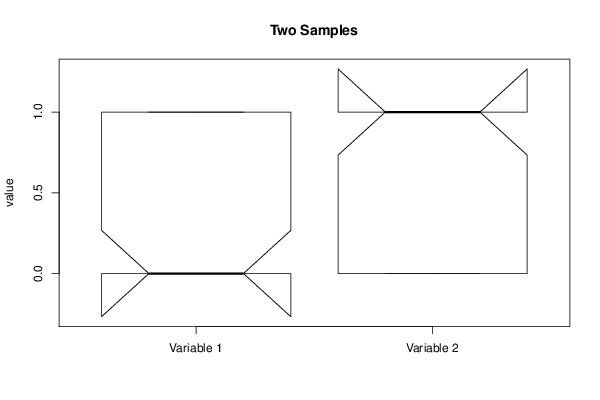
boxplot(mydf, notch=TRUE, ylab='value',main=main)
dev.off()
bitmap(file='test2.png')
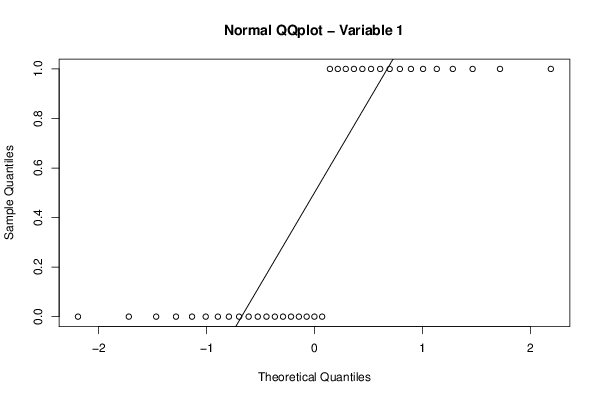
qqnorm(z[,par1],main='Normal QQplot - Variable 1')
qqline(z[,par1])
dev.off()
bitmap(file='test3.png')
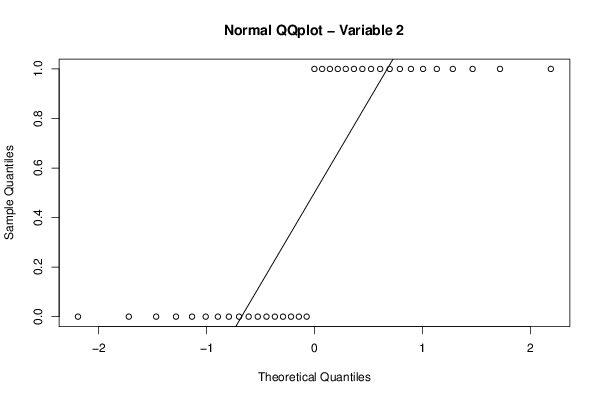
qqnorm(z[,par2],main='Normal QQplot - Variable 2')
qqline(z[,par2])
dev.off()
load(file='createtable')
a<-table.start()
a<-table.row.start(a)
a<-table.element(a,paste('Two Sample t-test (',par5,')',sep=''),2,TRUE)
a<-table.row.end(a)
if(!paired){
a<-table.row.start(a)
a<-table.element(a,'Mean of Sample 1',header=TRUE)
a<-table.element(a,r.t$estimate[[1]])
a<-table.row.end(a)
a<-table.row.start(a)
a<-table.element(a,'Mean of Sample 2',header=TRUE)
a<-table.element(a,r.t$estimate[[2]])
a<-table.row.end(a)
} else {
a<-table.row.start(a)
a<-table.element(a,'Difference: Mean1 - Mean2',header=TRUE)
a<-table.element(a,r.t$estimate)
a<-table.row.end(a)
}
a<-table.row.start(a)
a<-table.element(a,'t-stat',header=TRUE)
a<-table.element(a,r.t$statistic[[1]])
a<-table.row.end(a)
a<-table.row.start(a)
a<-table.element(a,'df',header=TRUE)
a<-table.element(a,r.t$parameter[[1]])
a<-table.row.end(a)
a<-table.row.start(a)
a<-table.element(a,'p-value',header=TRUE)
a<-table.element(a,r.t$p.value)
a<-table.row.end(a)
a<-table.row.start(a)
a<-table.element(a,'H0 value',header=TRUE)
a<-table.element(a,r.t$null.value[[1]])
a<-table.row.end(a)
a<-table.row.start(a)
a<-table.element(a,'Alternative',header=TRUE)
a<-table.element(a,r.t$alternative)
a<-table.row.end(a)
a<-table.row.start(a)
a<-table.element(a,'CI Level',header=TRUE)
a<-table.element(a,attr(r.t$conf.int,'conf.level'))
a<-table.row.end(a)
a<-table.row.start(a)
a<-table.element(a,'CI',header=TRUE)
a<-table.element(a,paste('[',r.t$conf.int[1],',',r.t$conf.int[2],']',sep=''))
a<-table.row.end(a)
a<-table.row.start(a)
a<-table.element(a,'F-test to compare two variances',2,TRUE)
a<-table.row.end(a)
a<-table.row.start(a)
a<-table.element(a,'F-stat',header=TRUE)
a<-table.element(a,v.t$statistic[[1]])
a<-table.row.end(a)
a<-table.row.start(a)
a<-table.element(a,'df',header=TRUE)
a<-table.element(a,v.t$parameter[[1]])
a<-table.row.end(a)
a<-table.row.start(a)
a<-table.element(a,'p-value',header=TRUE)
a<-table.element(a,v.t$p.value)
a<-table.row.end(a)
a<-table.row.start(a)
a<-table.element(a,'H0 value',header=TRUE)
a<-table.element(a,v.t$null.value[[1]])
a<-table.row.end(a)
a<-table.row.start(a)
a<-table.element(a,'Alternative',header=TRUE)
a<-table.element(a,v.t$alternative)
a<-table.row.end(a)
a<-table.row.start(a)
a<-table.element(a,'CI Level',header=TRUE)
a<-table.element(a,attr(v.t$conf.int,'conf.level'))
a<-table.row.end(a)
a<-table.row.start(a)
a<-table.element(a,'CI',header=TRUE)
a<-table.element(a,paste('[',v.t$conf.int[1],',',v.t$conf.int[2],']',sep=''))
a<-table.row.end(a)
a<-table.end(a)
table.save(a,file='mytable.tab')
a<-table.start()
a<-table.row.start(a)
a<-table.element(a,paste('Welch Two Sample t-test (',par5,')',sep=''),2,TRUE)
a<-table.row.end(a)
if(!paired){
a<-table.row.start(a)
a<-table.element(a,'Mean of Sample 1',header=TRUE)
a<-table.element(a,r.w$estimate[[1]])
a<-table.row.end(a)
a<-table.row.start(a)
a<-table.element(a,'Mean of Sample 2',header=TRUE)
a<-table.element(a,r.w$estimate[[2]])
a<-table.row.end(a)
} else {
a<-table.row.start(a)
a<-table.element(a,'Difference: Mean1 - Mean2',header=TRUE)
a<-table.element(a,r.w$estimate)
a<-table.row.end(a)
}
a<-table.row.start(a)
a<-table.element(a,'t-stat',header=TRUE)
a<-table.element(a,r.w$statistic[[1]])
a<-table.row.end(a)
a<-table.row.start(a)
a<-table.element(a,'df',header=TRUE)
a<-table.element(a,r.w$parameter[[1]])
a<-table.row.end(a)
a<-table.row.start(a)
a<-table.element(a,'p-value',header=TRUE)
a<-table.element(a,r.w$p.value)
a<-table.row.end(a)
a<-table.row.start(a)
a<-table.element(a,'H0 value',header=TRUE)
a<-table.element(a,r.w$null.value[[1]])
a<-table.row.end(a)
a<-table.row.start(a)
a<-table.element(a,'Alternative',header=TRUE)
a<-table.element(a,r.w$alternative)
a<-table.row.end(a)
a<-table.row.start(a)
a<-table.element(a,'CI Level',header=TRUE)
a<-table.element(a,attr(r.w$conf.int,'conf.level'))
a<-table.row.end(a)
a<-table.row.start(a)
a<-table.element(a,'CI',header=TRUE)
a<-table.element(a,paste('[',r.w$conf.int[1],',',r.w$conf.int[2],']',sep=''))
a<-table.row.end(a)
a<-table.end(a)
table.save(a,file='mytable1.tab')
a<-table.start()
a<-table.row.start(a)
a<-table.element(a,paste('Wicoxon rank sum test with continuity correction (',par5,')',sep=''),2,TRUE)
a<-table.row.end(a)
a<-table.row.start(a)
a<-table.element(a,'W',header=TRUE)
a<-table.element(a,w.t$statistic[[1]])
a<-table.row.end(a)
a<-table.row.start(a)
a<-table.element(a,'p-value',header=TRUE)
a<-table.element(a,w.t$p.value)
a<-table.row.end(a)
a<-table.row.start(a)
a<-table.element(a,'H0 value',header=TRUE)
a<-table.element(a,w.t$null.value[[1]])
a<-table.row.end(a)
a<-table.row.start(a)
a<-table.element(a,'Alternative',header=TRUE)
a<-table.element(a,w.t$alternative)
a<-table.row.end(a)
a<-table.row.start(a)
a<-table.element(a,'Kolmogorov-Smirnov Test to compare Distributions of two Samples',2,TRUE)
a<-table.row.end(a)
a<-table.row.start(a)
a<-table.element(a,'KS Statistic',header=TRUE)
a<-table.element(a,ks.t$statistic[[1]])
a<-table.row.end(a)
a<-table.row.start(a)
a<-table.element(a,'p-value',header=TRUE)
a<-table.element(a,ks.t$p.value)
a<-table.row.end(a)
a<-table.row.start(a)
a<-table.element(a,'Kolmogorov-Smirnov Test to compare Distributional Shape of two Samples',2,TRUE)
a<-table.row.end(a)
a<-table.row.start(a)
a<-table.element(a,'KS Statistic',header=TRUE)
a<-table.element(a,ks1.t$statistic[[1]])
a<-table.row.end(a)
a<-table.row.start(a)
a<-table.element(a,'p-value',header=TRUE)
a<-table.element(a,ks1.t$p.value)
a<-table.row.end(a)
a<-table.end(a)
table.save(a,file='mytable2.tab')
|


