Free Statistics
of Irreproducible Research!
Description of Statistical Computation | |||||||||||||||||||||||||||||||||||||||||||||||||||||||||||||||||||||||||||||||||||||||||||||||||||||||||||||||||||||||||||||||||||||||||||||
|---|---|---|---|---|---|---|---|---|---|---|---|---|---|---|---|---|---|---|---|---|---|---|---|---|---|---|---|---|---|---|---|---|---|---|---|---|---|---|---|---|---|---|---|---|---|---|---|---|---|---|---|---|---|---|---|---|---|---|---|---|---|---|---|---|---|---|---|---|---|---|---|---|---|---|---|---|---|---|---|---|---|---|---|---|---|---|---|---|---|---|---|---|---|---|---|---|---|---|---|---|---|---|---|---|---|---|---|---|---|---|---|---|---|---|---|---|---|---|---|---|---|---|---|---|---|---|---|---|---|---|---|---|---|---|---|---|---|---|---|---|---|
| Author's title | |||||||||||||||||||||||||||||||||||||||||||||||||||||||||||||||||||||||||||||||||||||||||||||||||||||||||||||||||||||||||||||||||||||||||||||
| Author | *The author of this computation has been verified* | ||||||||||||||||||||||||||||||||||||||||||||||||||||||||||||||||||||||||||||||||||||||||||||||||||||||||||||||||||||||||||||||||||||||||||||
| R Software Module | rwasp_notchedbox1.wasp | ||||||||||||||||||||||||||||||||||||||||||||||||||||||||||||||||||||||||||||||||||||||||||||||||||||||||||||||||||||||||||||||||||||||||||||
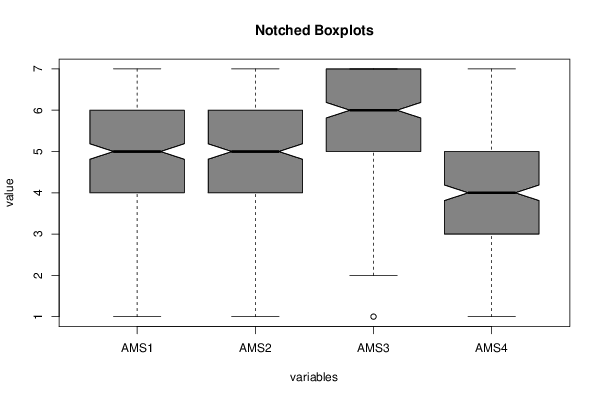
| Title produced by software | Notched Boxplots | ||||||||||||||||||||||||||||||||||||||||||||||||||||||||||||||||||||||||||||||||||||||||||||||||||||||||||||||||||||||||||||||||||||||||||||
| Date of computation | Sun, 02 Aug 2015 11:20:32 +0100 | ||||||||||||||||||||||||||||||||||||||||||||||||||||||||||||||||||||||||||||||||||||||||||||||||||||||||||||||||||||||||||||||||||||||||||||
| Cite this page as follows | Statistical Computations at FreeStatistics.org, Office for Research Development and Education, URL https://freestatistics.org/blog/index.php?v=date/2015/Aug/02/t1438510839nrj6lt96wot3a76.htm/, Retrieved Sun, 02 Aug 2026 14:46:25 +0000 | ||||||||||||||||||||||||||||||||||||||||||||||||||||||||||||||||||||||||||||||||||||||||||||||||||||||||||||||||||||||||||||||||||||||||||||
| Statistical Computations at FreeStatistics.org, Office for Research Development and Education, URL https://freestatistics.org/blog/index.php?pk=279819, Retrieved Sun, 02 Aug 2026 14:46:25 +0000 | |||||||||||||||||||||||||||||||||||||||||||||||||||||||||||||||||||||||||||||||||||||||||||||||||||||||||||||||||||||||||||||||||||||||||||||
| QR Codes: | |||||||||||||||||||||||||||||||||||||||||||||||||||||||||||||||||||||||||||||||||||||||||||||||||||||||||||||||||||||||||||||||||||||||||||||
|
| |||||||||||||||||||||||||||||||||||||||||||||||||||||||||||||||||||||||||||||||||||||||||||||||||||||||||||||||||||||||||||||||||||||||||||||
| Original text written by user: | |||||||||||||||||||||||||||||||||||||||||||||||||||||||||||||||||||||||||||||||||||||||||||||||||||||||||||||||||||||||||||||||||||||||||||||
| IsPrivate? | No (this computation is public) | ||||||||||||||||||||||||||||||||||||||||||||||||||||||||||||||||||||||||||||||||||||||||||||||||||||||||||||||||||||||||||||||||||||||||||||
| User-defined keywords | |||||||||||||||||||||||||||||||||||||||||||||||||||||||||||||||||||||||||||||||||||||||||||||||||||||||||||||||||||||||||||||||||||||||||||||
| Estimated Impact | 913 | ||||||||||||||||||||||||||||||||||||||||||||||||||||||||||||||||||||||||||||||||||||||||||||||||||||||||||||||||||||||||||||||||||||||||||||
Tree of Dependent Computations | |||||||||||||||||||||||||||||||||||||||||||||||||||||||||||||||||||||||||||||||||||||||||||||||||||||||||||||||||||||||||||||||||||||||||||||
| Family? (F = Feedback message, R = changed R code, M = changed R Module, P = changed Parameters, D = changed Data) | |||||||||||||||||||||||||||||||||||||||||||||||||||||||||||||||||||||||||||||||||||||||||||||||||||||||||||||||||||||||||||||||||||||||||||||
| - [Notched Boxplots] [] [2015-08-02 10:20:32] [63a9f0ea7bb98050796b649e85481845] [Current] - RMP [Paired and Unpaired Two Samples Tests about the Mean] [] [2015-11-22 12:30:57] [32b17a345b130fdf5cc88718ed94a974] - RMP [Paired and Unpaired Two Samples Tests about the Mean] [] [2015-11-22 13:19:22] [32b17a345b130fdf5cc88718ed94a974] - RMPD [Kendall tau Correlation Matrix] [concentration matrix] [2016-01-21 15:26:07] [7e4b57525890cc30fba63974cbfab1d7] - RMPD [Two-Way ANOVA] [two way anova] [2016-01-21 15:38:12] [7e4b57525890cc30fba63974cbfab1d7] - RMP [Paired and Unpaired Two Samples Tests about the Mean] [] [2015-11-22 13:23:00] [32b17a345b130fdf5cc88718ed94a974] - RMP [Paired and Unpaired Two Samples Tests about the Mean] [] [2015-11-22 13:25:48] [32b17a345b130fdf5cc88718ed94a974] - RMP [Paired and Unpaired Two Samples Tests about the Mean] [] [2015-11-22 13:28:33] [32b17a345b130fdf5cc88718ed94a974] - RMP [Paired and Unpaired Two Samples Tests about the Mean] [] [2015-11-22 13:31:19] [32b17a345b130fdf5cc88718ed94a974] - RMPD [Chi-Squared Test, McNemar Test, and Fisher Exact Test] [] [2015-11-22 14:58:29] [32b17a345b130fdf5cc88718ed94a974] - D [Chi-Squared Test, McNemar Test, and Fisher Exact Test] [] [2015-11-28 20:03:11] [e7afe482707cd0d9e12999f107a77777] - R D [Chi-Squared Test, McNemar Test, and Fisher Exact Test] [Task 10 - Chapter 5] [2015-11-29 17:09:05] [be3a328ac39a2f037654611efd7bd567] - RMPD [One Sample Tests about the Mean] [Vraag 1] [2015-12-22 13:43:45] [2710f8dea95e981897be7c03387b4566] - RMPD [Two-Way ANOVA] [Vraag 2] [2015-12-22 13:50:53] [2710f8dea95e981897be7c03387b4566] - RMPD [Paired and Unpaired Two Samples Tests about the Mean] [Vraag 3] [2015-12-22 16:17:34] [2710f8dea95e981897be7c03387b4566] - R PD [Chi-Squared Test, McNemar Test, and Fisher Exact Test] [Vraag 4] [2015-12-22 16:37:28] [2710f8dea95e981897be7c03387b4566] - RMPD [Multiple Regression] [Vraag 5] [2015-12-22 16:42:13] [2710f8dea95e981897be7c03387b4566] - RMPD [Skewness and Kurtosis Test] [Vraag 6.1] [2015-12-22 16:52:32] [2710f8dea95e981897be7c03387b4566] - RMPD [Central Tendency] [Vraag 6.2] [2015-12-22 16:55:00] [2710f8dea95e981897be7c03387b4566] - RMPD [Testing Mean with unknown Variance - Critical Value] [Vraag 6.3] [2015-12-22 17:00:26] [2710f8dea95e981897be7c03387b4566] - RMPD [Exponential Smoothing] [Vraag 7] [2015-12-22 17:03:29] [2710f8dea95e981897be7c03387b4566] - RMPD [Notched Boxplots] [Vraag 9] [2015-12-22 17:06:13] [2710f8dea95e981897be7c03387b4566] - RMPD [Kendall tau Correlation Matrix] [Vraag 10] [2015-12-22 17:09:20] [2710f8dea95e981897be7c03387b4566] - RMPD [Chi-Squared Test, McNemar Test, and Fisher Exact Test] [] [2015-11-22 15:17:21] [32b17a345b130fdf5cc88718ed94a974] - RMPD [Chi-Squared Test, McNemar Test, and Fisher Exact Test] [] [2015-11-22 15:27:04] [32b17a345b130fdf5cc88718ed94a974] - RMPD [Histogram] [] [2015-11-22 15:55:26] [32b17a345b130fdf5cc88718ed94a974] - RMPD [One-Way-Between-Groups ANOVA- Free Statistics Software (Calculator)] [] [2015-11-22 16:02:34] [32b17a345b130fdf5cc88718ed94a974] - R D [One-Way-Between-Groups ANOVA- Free Statistics Software (Calculator)] [Fout reproductie ...] [2015-12-08 10:31:45] [e7b69f276c668efa4454b31fcaf26444] - R PD [One-Way-Between-Groups ANOVA- Free Statistics Software (Calculator)] [] [2015-12-10 12:37:55] [32b17a345b130fdf5cc88718ed94a974] - RMPD [Kendall tau Correlation Matrix] [t13 h5] [2015-12-16 23:17:24] [0421fd723697f00896a2f19b11b89484] - RMPD [Paired and Unpaired Two Samples Tests about the Mean] [] [2016-01-21 10:59:01] [2e6b1bdc398efa0639617f5108875d85] - RMPD [Two-Way ANOVA] [] [2015-11-22 17:26:16] [32b17a345b130fdf5cc88718ed94a974] - RM D [Two-Way ANOVA] [Fout reproductie ...] [2015-12-08 10:45:43] [e7b69f276c668efa4454b31fcaf26444] - R PD [Two-Way ANOVA] [] [2015-12-10 12:41:44] [32b17a345b130fdf5cc88718ed94a974] - RMPD [Central Tendency] [] [2017-01-23 08:28:19] [1d1c21b35677ac459e60c7134a1aea4d] - R PD [Two-Way ANOVA] [t12 h5] [2015-12-16 22:52:35] [0421fd723697f00896a2f19b11b89484] - R P [Notched Boxplots] [] [2017-01-21 18:49:39] [f228b22b1b705502a1661555263484ee] | |||||||||||||||||||||||||||||||||||||||||||||||||||||||||||||||||||||||||||||||||||||||||||||||||||||||||||||||||||||||||||||||||||||||||||||
| Feedback Forum | |||||||||||||||||||||||||||||||||||||||||||||||||||||||||||||||||||||||||||||||||||||||||||||||||||||||||||||||||||||||||||||||||||||||||||||
Post a new message | |||||||||||||||||||||||||||||||||||||||||||||||||||||||||||||||||||||||||||||||||||||||||||||||||||||||||||||||||||||||||||||||||||||||||||||
Dataset | |||||||||||||||||||||||||||||||||||||||||||||||||||||||||||||||||||||||||||||||||||||||||||||||||||||||||||||||||||||||||||||||||||||||||||||
| Dataseries X: | |||||||||||||||||||||||||||||||||||||||||||||||||||||||||||||||||||||||||||||||||||||||||||||||||||||||||||||||||||||||||||||||||||||||||||||
5 4 5 2 7 4 6 4 4 4 7 5 4 3 5 1 5 6 6 5 5 4 5 3 5 4 7 4 6 5 7 5 4 5 3 3 7 7 7 7 1 7 6 6 5 3 5 5 4 7 7 4 6 2 5 3 5 5 7 3 5 6 7 2 6 5 6 5 5 4 6 3 5 6 7 4 5 5 4 3 7 7 7 7 7 7 7 6 5 7 6 5 7 6 6 4 6 5 7 4 4 5 6 5 5 4 5 4 6 5 7 6 5 5 6 5 5 6 4 6 7 6 7 4 5 2 6 1 3 6 6 4 5 4 7 3 5 3 7 5 6 6 7 4 6 4 6 4 2 3 6 2 6 7 7 2 5 5 5 4 4 5 4 4 5 4 5 2 5 4 5 2 5 6 3 2 6 5 7 2 6 5 6 2 6 4 5 2 4 7 4 4 3 4 5 4 5 6 7 5 6 6 5 4 6 4 5 2 5 5 6 3 4 5 6 3 6 4 6 4 6 5 7 5 4 6 5 3 6 5 4 2 6 5 6 2 5 4 6 4 5 6 7 3 5 5 6 3 2 6 4 2 3 4 6 2 5 3 5 5 6 5 5 4 6 5 5 4 7 5 6 3 5 4 7 6 4 5 6 5 5 5 6 2 4 5 6 4 3 5 6 5 3 5 6 3 3 6 5 4 3 6 5 5 6 3 6 4 6 5 7 2 5 2 6 2 6 4 5 2 4 6 6 3 4 4 7 2 6 4 7 6 7 5 6 4 7 5 6 4 6 4 7 1 7 4 6 5 5 3 3 2 4 5 5 4 5 6 7 3 7 5 6 4 6 4 6 3 7 5 7 4 5 4 6 5 6 4 6 2 5 4 6 3 5 2 4 2 5 4 6 7 5 4 6 6 5 5 6 4 5 7 7 3 5 4 7 2 7 6 7 4 5 5 7 5 6 4 7 5 6 2 7 1 6 6 7 3 6 4 5 2 2 4 4 4 5 7 5 4 7 6 7 6 5 5 6 6 5 5 3 3 6 6 6 5 4 6 6 5 3 4 5 4 7 1 7 1 4 5 3 3 5 4 6 4 6 7 6 3 6 5 4 6 6 6 6 4 4 6 7 6 5 5 6 4 6 5 3 4 5 4 6 4 5 6 7 5 6 4 6 4 1 5 7 5 7 4 5 2 7 4 7 4 5 6 7 5 3 4 4 3 4 6 6 6 5 5 6 5 5 6 7 2 6 5 6 5 7 4 4 2 5 6 6 7 6 3 6 3 5 5 6 4 6 5 4 4 2 6 5 4 4 2 3 3 5 5 6 3 3 6 6 4 6 5 6 3 2 6 7 3 5 6 7 5 4 5 6 4 1 5 5 3 5 4 5 4 4 4 3 1 4 5 6 5 5 6 7 3 7 6 7 3 2 5 7 2 3 4 5 4 4 3 6 1 7 6 7 5 5 7 5 5 4 7 6 7 6 6 4 2 5 6 6 4 6 6 5 2 6 4 6 2 6 6 7 5 5 5 7 3 2 6 4 5 3 4 4 3 5 3 6 6 7 5 6 4 6 5 5 4 5 7 6 4 6 4 5 3 6 7 6 7 5 5 6 4 4 5 6 4 2 5 5 3 3 5 5 3 6 5 4 5 4 5 4 2 6 4 2 1 6 4 6 3 6 6 7 5 7 5 6 3 4 4 6 2 7 6 3 1 7 5 6 4 4 3 4 4 5 4 6 5 5 4 6 5 5 4 6 5 5 4 6 5 5 5 7 3 6 4 6 3 6 3 6 3 7 6 6 3 4 5 6 6 7 7 7 3 5 5 4 4 5 5 4 5 1 4 6 4 5 5 6 2 5 6 7 5 2 2 1 6 4 6 6 5 4 6 6 5 6 4 6 3 7 4 7 5 4 6 7 5 7 5 7 3 2 5 3 1 7 6 6 6 4 5 7 4 7 4 7 4 7 5 6 3 5 6 3 3 5 5 6 5 7 5 7 4 5 5 6 2 6 3 4 2 5 5 5 2 3 7 2 4 3 6 7 2 5 4 5 2 3 4 5 3 5 5 7 4 6 5 7 5 5 6 5 4 5 5 7 3 4 4 6 4 4 4 5 3 4 5 6 4 5 5 6 5 6 5 6 4 5 4 6 3 6 7 5 5 5 6 6 4 5 7 7 4 5 5 7 4 2 5 5 2 5 5 6 5 5 6 7 5 6 7 7 6 1 3 4 4 4 5 6 6 5 7 5 6 7 5 7 4 6 4 6 5 2 4 4 3 2 5 6 3 6 5 5 2 7 5 7 4 3 4 7 5 6 3 6 3 5 7 7 5 5 6 6 3 6 5 7 5 5 5 6 1 6 4 5 5 6 1 5 3 5 3 5 2 6 5 5 5 6 4 6 4 7 3 7 6 4 6 7 3 4 4 6 3 5 5 4 4 6 5 7 4 5 5 5 6 6 6 5 5 5 5 7 5 5 5 6 3 6 5 6 4 7 7 7 7 5 5 6 4 6 6 6 5 6 5 7 4 7 5 4 2 4 5 6 3 5 6 6 5 6 6 4 5 5 4 4 3 5 5 7 4 | |||||||||||||||||||||||||||||||||||||||||||||||||||||||||||||||||||||||||||||||||||||||||||||||||||||||||||||||||||||||||||||||||||||||||||||
Tables (Output of Computation) | |||||||||||||||||||||||||||||||||||||||||||||||||||||||||||||||||||||||||||||||||||||||||||||||||||||||||||||||||||||||||||||||||||||||||||||
| |||||||||||||||||||||||||||||||||||||||||||||||||||||||||||||||||||||||||||||||||||||||||||||||||||||||||||||||||||||||||||||||||||||||||||||
Figures (Output of Computation) | |||||||||||||||||||||||||||||||||||||||||||||||||||||||||||||||||||||||||||||||||||||||||||||||||||||||||||||||||||||||||||||||||||||||||||||
Input Parameters & R Code | |||||||||||||||||||||||||||||||||||||||||||||||||||||||||||||||||||||||||||||||||||||||||||||||||||||||||||||||||||||||||||||||||||||||||||||
| Parameters (Session): | |||||||||||||||||||||||||||||||||||||||||||||||||||||||||||||||||||||||||||||||||||||||||||||||||||||||||||||||||||||||||||||||||||||||||||||
| par1 = grey ; | |||||||||||||||||||||||||||||||||||||||||||||||||||||||||||||||||||||||||||||||||||||||||||||||||||||||||||||||||||||||||||||||||||||||||||||
| Parameters (R input): | |||||||||||||||||||||||||||||||||||||||||||||||||||||||||||||||||||||||||||||||||||||||||||||||||||||||||||||||||||||||||||||||||||||||||||||
| par1 = grey ; | |||||||||||||||||||||||||||||||||||||||||||||||||||||||||||||||||||||||||||||||||||||||||||||||||||||||||||||||||||||||||||||||||||||||||||||
| R code (references can be found in the software module): | |||||||||||||||||||||||||||||||||||||||||||||||||||||||||||||||||||||||||||||||||||||||||||||||||||||||||||||||||||||||||||||||||||||||||||||
par1 <- 'grey' | |||||||||||||||||||||||||||||||||||||||||||||||||||||||||||||||||||||||||||||||||||||||||||||||||||||||||||||||||||||||||||||||||||||||||||||