Free Statistics
of Irreproducible Research!
Description of Statistical Computation | |||||||||||||||||||||
|---|---|---|---|---|---|---|---|---|---|---|---|---|---|---|---|---|---|---|---|---|---|
| Author's title | |||||||||||||||||||||
| Author | *The author of this computation has been verified* | ||||||||||||||||||||
| R Software Module | rwasp_skewness_kurtosis_plot.wasp | ||||||||||||||||||||
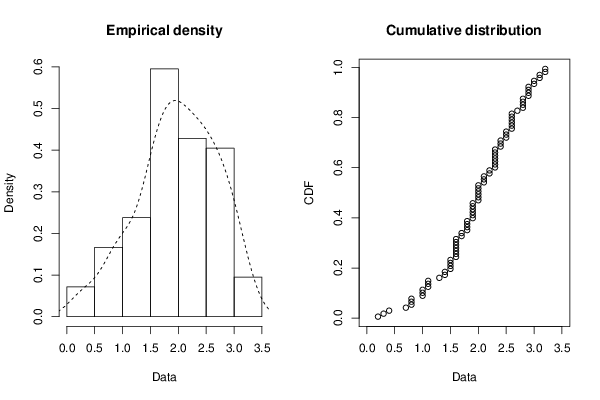
| Title produced by software | Skewness-Kurtosis Plot | ||||||||||||||||||||
| Date of computation | Fri, 22 Jan 2016 10:39:17 +0000 | ||||||||||||||||||||
| Cite this page as follows | Statistical Computations at FreeStatistics.org, Office for Research Development and Education, URL https://freestatistics.org/blog/index.php?v=date/2016/Jan/22/t1453459166bey5x6yuvouzbnb.htm/, Retrieved Fri, 29 May 2026 15:28:41 +0000 | ||||||||||||||||||||
| Statistical Computations at FreeStatistics.org, Office for Research Development and Education, URL https://freestatistics.org/blog/index.php?pk=291500, Retrieved Fri, 29 May 2026 15:28:41 +0000 | |||||||||||||||||||||
| QR Codes: | |||||||||||||||||||||
|
| |||||||||||||||||||||
| Original text written by user: | |||||||||||||||||||||
| IsPrivate? | No (this computation is public) | ||||||||||||||||||||
| User-defined keywords | |||||||||||||||||||||
| Estimated Impact | 350 | ||||||||||||||||||||
Tree of Dependent Computations | |||||||||||||||||||||
| Family? (F = Feedback message, R = changed R code, M = changed R Module, P = changed Parameters, D = changed Data) | |||||||||||||||||||||
| - [Standard Deviation-Mean Plot] [Jenkins vraag 8.2] [2015-12-19 07:38:11] [2ba32e9656c7c3fdddad3ba3f1588288] - RMP [Skewness-Kurtosis Plot] [skwenns & kurt] [2016-01-22 10:39:17] [8acc4c3875a0c63009483cc7dfb4f316] [Current] | |||||||||||||||||||||
| Feedback Forum | |||||||||||||||||||||
Post a new message | |||||||||||||||||||||
Dataset | |||||||||||||||||||||
| Dataseries X: | |||||||||||||||||||||
1.4 1.5 1.8 1.8 1.8 1.7 1.5 1.1 1.3 1.6 1.9 1.9 2 2.2 2.2 2 2.3 2.6 3.2 3.2 3.1 2.8 2.3 1.9 1.9 2 2 1.8 1.6 1.4 0.2 0.3 0.4 0.7 1 1.1 0.8 0.8 1 1.1 1 0.8 1.6 1.5 1.6 1.6 1.6 1.9 2 1.9 2 2.1 2.3 2.3 2.6 2.6 2.7 2.6 2.6 2.4 2.5 2.5 2.5 2.4 2.1 2.1 2.3 2.3 2.3 2.9 2.8 2.9 3 3 2.9 2.6 2.8 2.9 3.1 2.8 2.4 1.6 1.5 1.7 | |||||||||||||||||||||
Tables (Output of Computation) | |||||||||||||||||||||
| |||||||||||||||||||||
Figures (Output of Computation) | |||||||||||||||||||||
Input Parameters & R Code | |||||||||||||||||||||
| Parameters (Session): | |||||||||||||||||||||
| Parameters (R input): | |||||||||||||||||||||
| R code (references can be found in the software module): | |||||||||||||||||||||
library(fitdistrplus) | |||||||||||||||||||||