Free Statistics

of Irreproducible Research!

Author's title

Author*The author of this computation has been verified*
R Software Modulerwasp_multipleregression.wasp
Title produced by softwareMultiple Regression
Date of computationWed, 19 Nov 2008 07:18:31 -0700
Cite this page as followsStatistical Computations at FreeStatistics.org, Office for Research Development and Education, URL https://freestatistics.org/blog/index.php?v=date/2008/Nov/19/t1227104365gz3i5me0uw30w0h.htm/, Retrieved Fri, 01 Nov 2024 00:58:50 +0000
Statistical Computations at FreeStatistics.org, Office for Research Development and Education, URL https://freestatistics.org/blog/index.php?pk=25039, Retrieved Fri, 01 Nov 2024 00:58:50 +0000
QR Codes:

Original text written by user:
IsPrivate?No (this computation is public)
User-defined keywords
Estimated Impact321
Family? (F = Feedback message, R = changed R code, M = changed R Module, P = changed Parameters, D = changed Data)
-     [Multiple Regression] [Q1 The Seatbeltlaw] [2007-11-14 19:27:43] [8cd6641b921d30ebe00b648d1481bba0]
F    D  [Multiple Regression] [The Seatbelt Law ...] [2008-11-15 12:00:57] [93834488277b53a4510bfd06084ae13b]
-   PD    [Multiple Regression] [] [2008-11-15 18:50:27] [93834488277b53a4510bfd06084ae13b]
F    D      [Multiple Regression] [q3 ] [2008-11-19 14:12:05] [44a98561a4b3e6ab8cd5a857b48b0914]
F   P           [Multiple Regression] [q3 dummie+trend] [2008-11-19 14:18:31] [1aceffc2fa350402d9e8f8edd757a2e8] [Current]
Feedback Forum
2008-11-30 21:57:40 [Olivier Uyttendaele] [reply
Voor zover ik kan zien in je document, hebt je het document correct met je eigen gevens gereproduceerd. De interpretatie die je geeft is ook goed.

Het stappenplan dat je volgt is volgens mij ook correct.

Post a new message
Dataseries X:
3.4	1
3	1
3.1	1
2.5	0
2.2	0
2.3	0
2.1	0
2.8	0
3.1	1
2.9	0
2.6	0
2.7	0
2.3	0
2.3	0
2.1	0
2.2	0
2.9	0
2.6	0
2.7	0
1.8	0
1.3	0
0.9	0
1.3	0
1.3	0
1.3	0
1.3	0
1.1	0
1.4	0
1.2	0
1.7	0
1.8	0
1.5	0
1	0
1.6	0
1.5	0
1.8	0
1.8	0
1.6	0
1.9	0
1.7	0
1.6	0
1.3	0
1.1	0
1.9	0
2.6	0
2.3	0
2.4	0
2.2	0
2	0
2.9	0
2.6	0
2.3	0
2.3	0
2.6	0
3.1	1
2.8	0
2.5	0
2.9	0
3.1	1
3.1	1
3.2	1
2.5	0
2.6	0
2.9	0
2.6	0
2.4	0
1.7	0
2	0
2.2	0
1.9	0
1.6	0
1.6	0
1.2	0
1.2	0
1.5	0
1.6	0
1.7	0
1.8	0
1.8	0
1.8	0
1.3	0
1.3	0
1.4	0
1.1	0
1.5	0
2.2	0
2.9	0
3.1	1
3.5	1
3.6	1
4.4	1
4.2	1
5.2	1
5.8	1


Summary of computational transaction
Raw Inputview raw input (R code)
Raw Outputview raw output of R engine
Computing time3 seconds
R Server'George Udny Yule' @ 72.249.76.132

\begin{tabular}{lllllllll}
\hline
Summary of computational transaction \tabularnewline
Raw Input & view raw input (R code)  \tabularnewline
Raw Output & view raw output of R engine  \tabularnewline
Computing time & 3 seconds \tabularnewline
R Server & 'George Udny Yule' @ 72.249.76.132 \tabularnewline
\hline
\end{tabular}
%Source: https://freestatistics.org/blog/index.php?pk=25039&T=0

[TABLE]
[ROW][C]Summary of computational transaction[/C][/ROW]
[ROW][C]Raw Input[/C][C]view raw input (R code) [/C][/ROW]
[ROW][C]Raw Output[/C][C]view raw output of R engine [/C][/ROW]
[ROW][C]Computing time[/C][C]3 seconds[/C][/ROW]
[ROW][C]R Server[/C][C]'George Udny Yule' @ 72.249.76.132[/C][/ROW]
[/TABLE]
Source: https://freestatistics.org/blog/index.php?pk=25039&T=0

Globally Unique Identifier (entire table): ba.freestatistics.org/blog/index.php?pk=25039&T=0

As an alternative you can also use a QR Code:  

The GUIDs for individual cells are displayed in the table below:

Summary of computational transaction
Raw Inputview raw input (R code)
Raw Outputview raw output of R engine
Computing time3 seconds
R Server'George Udny Yule' @ 72.249.76.132


Multiple Linear Regression - Estimated Regression Equation
Consumptieprijsindex[t] = + 1.66897225848358 + 1.71692049618152Dumivariabele[t] -0.0619278850903809M1[t] + 0.188995886175069M2[t] + 0.287804595417827M3[t] + 0.274113304660584M4[t] + 0.310422013903342M5[t] + 0.3467307231461M6[t] + 0.180924370366167M7[t] + 0.406848141631615M8[t] + 0.241041788851683M9[t] + 0.50446556011713M10[t] + 0.0154770050429578M11[t] + 0.00119129075724229t + e[t]

\begin{tabular}{lllllllll}
\hline
Multiple Linear Regression - Estimated Regression Equation \tabularnewline
Consumptieprijsindex[t] =  +  1.66897225848358 +  1.71692049618152Dumivariabele[t] -0.0619278850903809M1[t] +  0.188995886175069M2[t] +  0.287804595417827M3[t] +  0.274113304660584M4[t] +  0.310422013903342M5[t] +  0.3467307231461M6[t] +  0.180924370366167M7[t] +  0.406848141631615M8[t] +  0.241041788851683M9[t] +  0.50446556011713M10[t] +  0.0154770050429578M11[t] +  0.00119129075724229t  + e[t] \tabularnewline
\hline
\end{tabular}
%Source: https://freestatistics.org/blog/index.php?pk=25039&T=1

[TABLE]
[ROW][C]Multiple Linear Regression - Estimated Regression Equation[/C][/ROW]
[ROW][C]Consumptieprijsindex[t] =  +  1.66897225848358 +  1.71692049618152Dumivariabele[t] -0.0619278850903809M1[t] +  0.188995886175069M2[t] +  0.287804595417827M3[t] +  0.274113304660584M4[t] +  0.310422013903342M5[t] +  0.3467307231461M6[t] +  0.180924370366167M7[t] +  0.406848141631615M8[t] +  0.241041788851683M9[t] +  0.50446556011713M10[t] +  0.0154770050429578M11[t] +  0.00119129075724229t  + e[t][/C][/ROW]
[/TABLE]
Source: https://freestatistics.org/blog/index.php?pk=25039&T=1

Globally Unique Identifier (entire table): ba.freestatistics.org/blog/index.php?pk=25039&T=1

As an alternative you can also use a QR Code:  

The GUIDs for individual cells are displayed in the table below:

Multiple Linear Regression - Estimated Regression Equation
Consumptieprijsindex[t] = + 1.66897225848358 + 1.71692049618152Dumivariabele[t] -0.0619278850903809M1[t] + 0.188995886175069M2[t] + 0.287804595417827M3[t] + 0.274113304660584M4[t] + 0.310422013903342M5[t] + 0.3467307231461M6[t] + 0.180924370366167M7[t] + 0.406848141631615M8[t] + 0.241041788851683M9[t] + 0.50446556011713M10[t] + 0.0154770050429578M11[t] + 0.00119129075724229t + e[t]


Multiple Linear Regression - Ordinary Least Squares
VariableParameterS.D.T-STATH0: parameter = 02-tail p-value1-tail p-value
(Intercept)1.668972258483580.2696486.189500
Dumivariabele1.716920496181520.1860749.227100
M1-0.06192788509038090.333148-0.18590.8530040.426502
M20.1889958861750690.3323220.56870.5711440.285572
M30.2878045954178270.3322610.86620.3889710.194486
M40.2741133046605840.3322190.82510.411770.205885
M50.3104220139033420.3321960.93450.3528810.176441
M60.34673072314610.3321911.04380.2997360.149868
M70.1809243703661670.3327530.54370.5881470.294073
M80.4068481416316150.3322381.22460.2243320.112166
M90.2410417888516830.3327720.72430.4709660.235483
M100.504465560117130.332361.51780.1330.0665
M110.01547700504295780.3430770.04510.964130.482065
t0.001191290757242290.0024970.47720.6345430.317271

\begin{tabular}{lllllllll}
\hline
Multiple Linear Regression - Ordinary Least Squares \tabularnewline
Variable & Parameter & S.D. & T-STATH0: parameter = 0 & 2-tail p-value & 1-tail p-value \tabularnewline
(Intercept) & 1.66897225848358 & 0.269648 & 6.1895 & 0 & 0 \tabularnewline
Dumivariabele & 1.71692049618152 & 0.186074 & 9.2271 & 0 & 0 \tabularnewline
M1 & -0.0619278850903809 & 0.333148 & -0.1859 & 0.853004 & 0.426502 \tabularnewline
M2 & 0.188995886175069 & 0.332322 & 0.5687 & 0.571144 & 0.285572 \tabularnewline
M3 & 0.287804595417827 & 0.332261 & 0.8662 & 0.388971 & 0.194486 \tabularnewline
M4 & 0.274113304660584 & 0.332219 & 0.8251 & 0.41177 & 0.205885 \tabularnewline
M5 & 0.310422013903342 & 0.332196 & 0.9345 & 0.352881 & 0.176441 \tabularnewline
M6 & 0.3467307231461 & 0.332191 & 1.0438 & 0.299736 & 0.149868 \tabularnewline
M7 & 0.180924370366167 & 0.332753 & 0.5437 & 0.588147 & 0.294073 \tabularnewline
M8 & 0.406848141631615 & 0.332238 & 1.2246 & 0.224332 & 0.112166 \tabularnewline
M9 & 0.241041788851683 & 0.332772 & 0.7243 & 0.470966 & 0.235483 \tabularnewline
M10 & 0.50446556011713 & 0.33236 & 1.5178 & 0.133 & 0.0665 \tabularnewline
M11 & 0.0154770050429578 & 0.343077 & 0.0451 & 0.96413 & 0.482065 \tabularnewline
t & 0.00119129075724229 & 0.002497 & 0.4772 & 0.634543 & 0.317271 \tabularnewline
\hline
\end{tabular}
%Source: https://freestatistics.org/blog/index.php?pk=25039&T=2

[TABLE]
[ROW][C]Multiple Linear Regression - Ordinary Least Squares[/C][/ROW]
[ROW][C]Variable[/C][C]Parameter[/C][C]S.D.[/C][C]T-STATH0: parameter = 0[/C][C]2-tail p-value[/C][C]1-tail p-value[/C][/ROW]
[ROW][C](Intercept)[/C][C]1.66897225848358[/C][C]0.269648[/C][C]6.1895[/C][C]0[/C][C]0[/C][/ROW]
[ROW][C]Dumivariabele[/C][C]1.71692049618152[/C][C]0.186074[/C][C]9.2271[/C][C]0[/C][C]0[/C][/ROW]
[ROW][C]M1[/C][C]-0.0619278850903809[/C][C]0.333148[/C][C]-0.1859[/C][C]0.853004[/C][C]0.426502[/C][/ROW]
[ROW][C]M2[/C][C]0.188995886175069[/C][C]0.332322[/C][C]0.5687[/C][C]0.571144[/C][C]0.285572[/C][/ROW]
[ROW][C]M3[/C][C]0.287804595417827[/C][C]0.332261[/C][C]0.8662[/C][C]0.388971[/C][C]0.194486[/C][/ROW]
[ROW][C]M4[/C][C]0.274113304660584[/C][C]0.332219[/C][C]0.8251[/C][C]0.41177[/C][C]0.205885[/C][/ROW]
[ROW][C]M5[/C][C]0.310422013903342[/C][C]0.332196[/C][C]0.9345[/C][C]0.352881[/C][C]0.176441[/C][/ROW]
[ROW][C]M6[/C][C]0.3467307231461[/C][C]0.332191[/C][C]1.0438[/C][C]0.299736[/C][C]0.149868[/C][/ROW]
[ROW][C]M7[/C][C]0.180924370366167[/C][C]0.332753[/C][C]0.5437[/C][C]0.588147[/C][C]0.294073[/C][/ROW]
[ROW][C]M8[/C][C]0.406848141631615[/C][C]0.332238[/C][C]1.2246[/C][C]0.224332[/C][C]0.112166[/C][/ROW]
[ROW][C]M9[/C][C]0.241041788851683[/C][C]0.332772[/C][C]0.7243[/C][C]0.470966[/C][C]0.235483[/C][/ROW]
[ROW][C]M10[/C][C]0.50446556011713[/C][C]0.33236[/C][C]1.5178[/C][C]0.133[/C][C]0.0665[/C][/ROW]
[ROW][C]M11[/C][C]0.0154770050429578[/C][C]0.343077[/C][C]0.0451[/C][C]0.96413[/C][C]0.482065[/C][/ROW]
[ROW][C]t[/C][C]0.00119129075724229[/C][C]0.002497[/C][C]0.4772[/C][C]0.634543[/C][C]0.317271[/C][/ROW]
[/TABLE]
Source: https://freestatistics.org/blog/index.php?pk=25039&T=2

Globally Unique Identifier (entire table): ba.freestatistics.org/blog/index.php?pk=25039&T=2

As an alternative you can also use a QR Code:  

The GUIDs for individual cells are displayed in the table below:

Multiple Linear Regression - Ordinary Least Squares
VariableParameterS.D.T-STATH0: parameter = 02-tail p-value1-tail p-value
(Intercept)1.668972258483580.2696486.189500
Dumivariabele1.716920496181520.1860749.227100
M1-0.06192788509038090.333148-0.18590.8530040.426502
M20.1889958861750690.3323220.56870.5711440.285572
M30.2878045954178270.3322610.86620.3889710.194486
M40.2741133046605840.3322190.82510.411770.205885
M50.3104220139033420.3321960.93450.3528810.176441
M60.34673072314610.3321911.04380.2997360.149868
M70.1809243703661670.3327530.54370.5881470.294073
M80.4068481416316150.3322381.22460.2243320.112166
M90.2410417888516830.3327720.72430.4709660.235483
M100.504465560117130.332361.51780.1330.0665
M110.01547700504295780.3430770.04510.964130.482065
t0.001191290757242290.0024970.47720.6345430.317271


Multiple Linear Regression - Regression Statistics
Multiple R0.73697632247545
R-squared0.543134099889437
Adjusted R-squared0.468893391121471
F-TEST (value)7.3158528373828
F-TEST (DF numerator)13
F-TEST (DF denominator)80
p-value3.32162364280464e-09
Multiple Linear Regression - Residual Statistics
Residual Standard Deviation0.641822164216338
Sum Squared Residuals32.9548552383475

\begin{tabular}{lllllllll}
\hline
Multiple Linear Regression - Regression Statistics \tabularnewline
Multiple R & 0.73697632247545 \tabularnewline
R-squared & 0.543134099889437 \tabularnewline
Adjusted R-squared & 0.468893391121471 \tabularnewline
F-TEST (value) & 7.3158528373828 \tabularnewline
F-TEST (DF numerator) & 13 \tabularnewline
F-TEST (DF denominator) & 80 \tabularnewline
p-value & 3.32162364280464e-09 \tabularnewline
Multiple Linear Regression - Residual Statistics \tabularnewline
Residual Standard Deviation & 0.641822164216338 \tabularnewline
Sum Squared Residuals & 32.9548552383475 \tabularnewline
\hline
\end{tabular}
%Source: https://freestatistics.org/blog/index.php?pk=25039&T=3

[TABLE]
[ROW][C]Multiple Linear Regression - Regression Statistics[/C][/ROW]
[ROW][C]Multiple R[/C][C]0.73697632247545[/C][/ROW]
[ROW][C]R-squared[/C][C]0.543134099889437[/C][/ROW]
[ROW][C]Adjusted R-squared[/C][C]0.468893391121471[/C][/ROW]
[ROW][C]F-TEST (value)[/C][C]7.3158528373828[/C][/ROW]
[ROW][C]F-TEST (DF numerator)[/C][C]13[/C][/ROW]
[ROW][C]F-TEST (DF denominator)[/C][C]80[/C][/ROW]
[ROW][C]p-value[/C][C]3.32162364280464e-09[/C][/ROW]
[ROW][C]Multiple Linear Regression - Residual Statistics[/C][/ROW]
[ROW][C]Residual Standard Deviation[/C][C]0.641822164216338[/C][/ROW]
[ROW][C]Sum Squared Residuals[/C][C]32.9548552383475[/C][/ROW]
[/TABLE]
Source: https://freestatistics.org/blog/index.php?pk=25039&T=3

Globally Unique Identifier (entire table): ba.freestatistics.org/blog/index.php?pk=25039&T=3

As an alternative you can also use a QR Code:  

The GUIDs for individual cells are displayed in the table below:

Multiple Linear Regression - Regression Statistics
Multiple R0.73697632247545
R-squared0.543134099889437
Adjusted R-squared0.468893391121471
F-TEST (value)7.3158528373828
F-TEST (DF numerator)13
F-TEST (DF denominator)80
p-value3.32162364280464e-09
Multiple Linear Regression - Residual Statistics
Residual Standard Deviation0.641822164216338
Sum Squared Residuals32.9548552383475


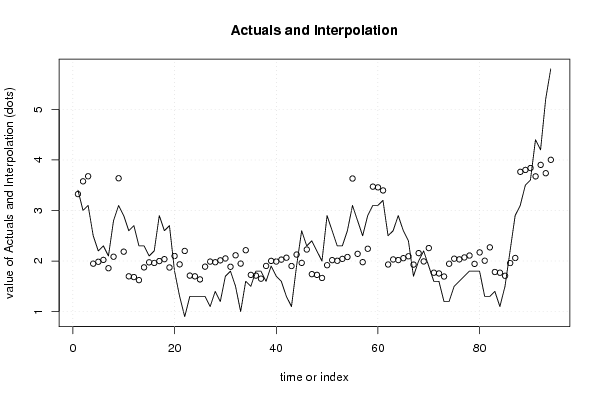
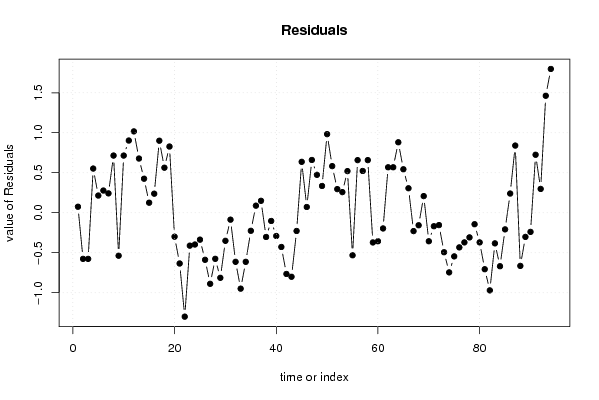
Multiple Linear Regression - Actuals, Interpolation, and Residuals
Time or IndexActualsInterpolationForecastResidualsPrediction Error
13.43.325156160331970.0748438396680255
233.57727122235465-0.577271222354654
33.13.67727122235465-0.577271222354654
42.51.947850726173130.552149273826867
52.21.985350726173130.214649273826866
62.32.022850726173130.277149273826866
72.11.858235664150440.241764335849557
82.82.085350726173130.714649273826866
93.13.63765616033196-0.537656160331963
102.92.185350726173130.714649273826866
112.61.697553461856200.902446538143796
122.71.683267747570491.01673225242951
132.31.622531153237350.67746884676265
142.31.874646215260040.425353784739959
152.11.974646215260040.125353784739959
162.21.962146215260040.237853784739959
172.91.999646215260040.900353784739959
182.62.037146215260040.562853784739959
192.71.872531153237350.827468846762649
201.82.09964621526004-0.299646215260041
211.31.93503115323735-0.635031153237351
220.92.19964621526004-1.29964621526004
231.31.71184895094311-0.411848950943111
241.31.69756323665740-0.397563236657395
251.31.63682664232426-0.336826642324257
261.31.88894170434695-0.588941704346949
271.11.98894170434695-0.888941704346949
281.41.97644170434695-0.576441704346949
291.22.01394170434695-0.813941704346949
301.72.05144170434695-0.351441704346949
311.81.88682664232426-0.0868266423242587
321.52.11394170434695-0.613941704346949
3311.94932664232426-0.949326642324259
341.62.21394170434695-0.613941704346949
351.51.72614444003002-0.226144440030018
361.81.711858725744300.0881412742556973
371.81.651122131411160.148877868588836
381.61.90323719343386-0.303237193433857
391.92.00323719343386-0.103237193433857
401.71.99073719343386-0.290737193433856
411.62.02823719343386-0.428237193433856
421.32.06573719343386-0.765737193433856
431.11.90112213141117-0.801122131411166
441.92.12823719343386-0.228237193433856
452.61.963622131411170.636377868588834
462.32.228237193433860.0717628065661436
472.41.740439929116930.659560070883074
482.21.726154214831210.47384578516879
4921.665417620498070.334582379501928
502.91.917532682520760.982467317479236
512.62.017532682520760.582467317479236
522.32.005032682520760.294967317479236
532.32.042532682520760.257467317479236
542.62.080032682520760.519967317479236
553.13.63233811667959-0.532338116679594
562.82.142532682520760.657467317479237
572.51.977917620498070.522082379501926
582.92.242532682520760.657467317479236
593.13.47165591438535-0.371655914385354
603.13.45737020009964-0.357370200099638
613.23.3966336057665-0.1966336057665
622.51.931828171607670.568171828392328
632.62.031828171607670.568171828392329
642.92.019328171607670.880671828392329
652.62.056828171607670.543171828392329
662.42.094328171607670.305671828392329
671.71.92971310958498-0.229713109584982
6822.15682817160767-0.156828171607671
692.21.992213109584980.207786890415019
701.92.25682817160767-0.356828171607671
711.61.76903090729074-0.169030907290741
721.61.75474519300503-0.154745193005025
731.21.69400859867189-0.494008598671887
741.21.94612366069458-0.74612366069458
751.52.04612366069458-0.546123660694579
761.62.03362366069458-0.433623660694579
771.72.07112366069458-0.371123660694579
781.82.10862366069458-0.308623660694579
791.81.94400859867189-0.144008598671889
801.82.17112366069458-0.371123660694579
811.32.00650859867189-0.706508598671889
821.32.27112366069458-0.971123660694578
831.41.78332639637765-0.383326396377649
841.11.76904068209193-0.669040682091933
851.51.70830408775879-0.208304087758795
862.21.960419149781490.239580850218513
872.92.060419149781490.839580850218513
883.13.76483964596301-0.664839645963007
893.53.80233964596301-0.302339645963007
903.63.83983964596301-0.239839645963007
914.43.675224583940320.724775416059683
924.23.902339645963010.297660354036993
935.23.737724583940321.46227541605968
945.84.002339645963011.79766035403699

\begin{tabular}{lllllllll}
\hline
Multiple Linear Regression - Actuals, Interpolation, and Residuals \tabularnewline
Time or Index & Actuals & InterpolationForecast & ResidualsPrediction Error \tabularnewline
1 & 3.4 & 3.32515616033197 & 0.0748438396680255 \tabularnewline
2 & 3 & 3.57727122235465 & -0.577271222354654 \tabularnewline
3 & 3.1 & 3.67727122235465 & -0.577271222354654 \tabularnewline
4 & 2.5 & 1.94785072617313 & 0.552149273826867 \tabularnewline
5 & 2.2 & 1.98535072617313 & 0.214649273826866 \tabularnewline
6 & 2.3 & 2.02285072617313 & 0.277149273826866 \tabularnewline
7 & 2.1 & 1.85823566415044 & 0.241764335849557 \tabularnewline
8 & 2.8 & 2.08535072617313 & 0.714649273826866 \tabularnewline
9 & 3.1 & 3.63765616033196 & -0.537656160331963 \tabularnewline
10 & 2.9 & 2.18535072617313 & 0.714649273826866 \tabularnewline
11 & 2.6 & 1.69755346185620 & 0.902446538143796 \tabularnewline
12 & 2.7 & 1.68326774757049 & 1.01673225242951 \tabularnewline
13 & 2.3 & 1.62253115323735 & 0.67746884676265 \tabularnewline
14 & 2.3 & 1.87464621526004 & 0.425353784739959 \tabularnewline
15 & 2.1 & 1.97464621526004 & 0.125353784739959 \tabularnewline
16 & 2.2 & 1.96214621526004 & 0.237853784739959 \tabularnewline
17 & 2.9 & 1.99964621526004 & 0.900353784739959 \tabularnewline
18 & 2.6 & 2.03714621526004 & 0.562853784739959 \tabularnewline
19 & 2.7 & 1.87253115323735 & 0.827468846762649 \tabularnewline
20 & 1.8 & 2.09964621526004 & -0.299646215260041 \tabularnewline
21 & 1.3 & 1.93503115323735 & -0.635031153237351 \tabularnewline
22 & 0.9 & 2.19964621526004 & -1.29964621526004 \tabularnewline
23 & 1.3 & 1.71184895094311 & -0.411848950943111 \tabularnewline
24 & 1.3 & 1.69756323665740 & -0.397563236657395 \tabularnewline
25 & 1.3 & 1.63682664232426 & -0.336826642324257 \tabularnewline
26 & 1.3 & 1.88894170434695 & -0.588941704346949 \tabularnewline
27 & 1.1 & 1.98894170434695 & -0.888941704346949 \tabularnewline
28 & 1.4 & 1.97644170434695 & -0.576441704346949 \tabularnewline
29 & 1.2 & 2.01394170434695 & -0.813941704346949 \tabularnewline
30 & 1.7 & 2.05144170434695 & -0.351441704346949 \tabularnewline
31 & 1.8 & 1.88682664232426 & -0.0868266423242587 \tabularnewline
32 & 1.5 & 2.11394170434695 & -0.613941704346949 \tabularnewline
33 & 1 & 1.94932664232426 & -0.949326642324259 \tabularnewline
34 & 1.6 & 2.21394170434695 & -0.613941704346949 \tabularnewline
35 & 1.5 & 1.72614444003002 & -0.226144440030018 \tabularnewline
36 & 1.8 & 1.71185872574430 & 0.0881412742556973 \tabularnewline
37 & 1.8 & 1.65112213141116 & 0.148877868588836 \tabularnewline
38 & 1.6 & 1.90323719343386 & -0.303237193433857 \tabularnewline
39 & 1.9 & 2.00323719343386 & -0.103237193433857 \tabularnewline
40 & 1.7 & 1.99073719343386 & -0.290737193433856 \tabularnewline
41 & 1.6 & 2.02823719343386 & -0.428237193433856 \tabularnewline
42 & 1.3 & 2.06573719343386 & -0.765737193433856 \tabularnewline
43 & 1.1 & 1.90112213141117 & -0.801122131411166 \tabularnewline
44 & 1.9 & 2.12823719343386 & -0.228237193433856 \tabularnewline
45 & 2.6 & 1.96362213141117 & 0.636377868588834 \tabularnewline
46 & 2.3 & 2.22823719343386 & 0.0717628065661436 \tabularnewline
47 & 2.4 & 1.74043992911693 & 0.659560070883074 \tabularnewline
48 & 2.2 & 1.72615421483121 & 0.47384578516879 \tabularnewline
49 & 2 & 1.66541762049807 & 0.334582379501928 \tabularnewline
50 & 2.9 & 1.91753268252076 & 0.982467317479236 \tabularnewline
51 & 2.6 & 2.01753268252076 & 0.582467317479236 \tabularnewline
52 & 2.3 & 2.00503268252076 & 0.294967317479236 \tabularnewline
53 & 2.3 & 2.04253268252076 & 0.257467317479236 \tabularnewline
54 & 2.6 & 2.08003268252076 & 0.519967317479236 \tabularnewline
55 & 3.1 & 3.63233811667959 & -0.532338116679594 \tabularnewline
56 & 2.8 & 2.14253268252076 & 0.657467317479237 \tabularnewline
57 & 2.5 & 1.97791762049807 & 0.522082379501926 \tabularnewline
58 & 2.9 & 2.24253268252076 & 0.657467317479236 \tabularnewline
59 & 3.1 & 3.47165591438535 & -0.371655914385354 \tabularnewline
60 & 3.1 & 3.45737020009964 & -0.357370200099638 \tabularnewline
61 & 3.2 & 3.3966336057665 & -0.1966336057665 \tabularnewline
62 & 2.5 & 1.93182817160767 & 0.568171828392328 \tabularnewline
63 & 2.6 & 2.03182817160767 & 0.568171828392329 \tabularnewline
64 & 2.9 & 2.01932817160767 & 0.880671828392329 \tabularnewline
65 & 2.6 & 2.05682817160767 & 0.543171828392329 \tabularnewline
66 & 2.4 & 2.09432817160767 & 0.305671828392329 \tabularnewline
67 & 1.7 & 1.92971310958498 & -0.229713109584982 \tabularnewline
68 & 2 & 2.15682817160767 & -0.156828171607671 \tabularnewline
69 & 2.2 & 1.99221310958498 & 0.207786890415019 \tabularnewline
70 & 1.9 & 2.25682817160767 & -0.356828171607671 \tabularnewline
71 & 1.6 & 1.76903090729074 & -0.169030907290741 \tabularnewline
72 & 1.6 & 1.75474519300503 & -0.154745193005025 \tabularnewline
73 & 1.2 & 1.69400859867189 & -0.494008598671887 \tabularnewline
74 & 1.2 & 1.94612366069458 & -0.74612366069458 \tabularnewline
75 & 1.5 & 2.04612366069458 & -0.546123660694579 \tabularnewline
76 & 1.6 & 2.03362366069458 & -0.433623660694579 \tabularnewline
77 & 1.7 & 2.07112366069458 & -0.371123660694579 \tabularnewline
78 & 1.8 & 2.10862366069458 & -0.308623660694579 \tabularnewline
79 & 1.8 & 1.94400859867189 & -0.144008598671889 \tabularnewline
80 & 1.8 & 2.17112366069458 & -0.371123660694579 \tabularnewline
81 & 1.3 & 2.00650859867189 & -0.706508598671889 \tabularnewline
82 & 1.3 & 2.27112366069458 & -0.971123660694578 \tabularnewline
83 & 1.4 & 1.78332639637765 & -0.383326396377649 \tabularnewline
84 & 1.1 & 1.76904068209193 & -0.669040682091933 \tabularnewline
85 & 1.5 & 1.70830408775879 & -0.208304087758795 \tabularnewline
86 & 2.2 & 1.96041914978149 & 0.239580850218513 \tabularnewline
87 & 2.9 & 2.06041914978149 & 0.839580850218513 \tabularnewline
88 & 3.1 & 3.76483964596301 & -0.664839645963007 \tabularnewline
89 & 3.5 & 3.80233964596301 & -0.302339645963007 \tabularnewline
90 & 3.6 & 3.83983964596301 & -0.239839645963007 \tabularnewline
91 & 4.4 & 3.67522458394032 & 0.724775416059683 \tabularnewline
92 & 4.2 & 3.90233964596301 & 0.297660354036993 \tabularnewline
93 & 5.2 & 3.73772458394032 & 1.46227541605968 \tabularnewline
94 & 5.8 & 4.00233964596301 & 1.79766035403699 \tabularnewline
\hline
\end{tabular}
%Source: https://freestatistics.org/blog/index.php?pk=25039&T=4

[TABLE]
[ROW][C]Multiple Linear Regression - Actuals, Interpolation, and Residuals[/C][/ROW]
[ROW][C]Time or Index[/C][C]Actuals[/C][C]InterpolationForecast[/C][C]ResidualsPrediction Error[/C][/ROW]
[ROW][C]1[/C][C]3.4[/C][C]3.32515616033197[/C][C]0.0748438396680255[/C][/ROW]
[ROW][C]2[/C][C]3[/C][C]3.57727122235465[/C][C]-0.577271222354654[/C][/ROW]
[ROW][C]3[/C][C]3.1[/C][C]3.67727122235465[/C][C]-0.577271222354654[/C][/ROW]
[ROW][C]4[/C][C]2.5[/C][C]1.94785072617313[/C][C]0.552149273826867[/C][/ROW]
[ROW][C]5[/C][C]2.2[/C][C]1.98535072617313[/C][C]0.214649273826866[/C][/ROW]
[ROW][C]6[/C][C]2.3[/C][C]2.02285072617313[/C][C]0.277149273826866[/C][/ROW]
[ROW][C]7[/C][C]2.1[/C][C]1.85823566415044[/C][C]0.241764335849557[/C][/ROW]
[ROW][C]8[/C][C]2.8[/C][C]2.08535072617313[/C][C]0.714649273826866[/C][/ROW]
[ROW][C]9[/C][C]3.1[/C][C]3.63765616033196[/C][C]-0.537656160331963[/C][/ROW]
[ROW][C]10[/C][C]2.9[/C][C]2.18535072617313[/C][C]0.714649273826866[/C][/ROW]
[ROW][C]11[/C][C]2.6[/C][C]1.69755346185620[/C][C]0.902446538143796[/C][/ROW]
[ROW][C]12[/C][C]2.7[/C][C]1.68326774757049[/C][C]1.01673225242951[/C][/ROW]
[ROW][C]13[/C][C]2.3[/C][C]1.62253115323735[/C][C]0.67746884676265[/C][/ROW]
[ROW][C]14[/C][C]2.3[/C][C]1.87464621526004[/C][C]0.425353784739959[/C][/ROW]
[ROW][C]15[/C][C]2.1[/C][C]1.97464621526004[/C][C]0.125353784739959[/C][/ROW]
[ROW][C]16[/C][C]2.2[/C][C]1.96214621526004[/C][C]0.237853784739959[/C][/ROW]
[ROW][C]17[/C][C]2.9[/C][C]1.99964621526004[/C][C]0.900353784739959[/C][/ROW]
[ROW][C]18[/C][C]2.6[/C][C]2.03714621526004[/C][C]0.562853784739959[/C][/ROW]
[ROW][C]19[/C][C]2.7[/C][C]1.87253115323735[/C][C]0.827468846762649[/C][/ROW]
[ROW][C]20[/C][C]1.8[/C][C]2.09964621526004[/C][C]-0.299646215260041[/C][/ROW]
[ROW][C]21[/C][C]1.3[/C][C]1.93503115323735[/C][C]-0.635031153237351[/C][/ROW]
[ROW][C]22[/C][C]0.9[/C][C]2.19964621526004[/C][C]-1.29964621526004[/C][/ROW]
[ROW][C]23[/C][C]1.3[/C][C]1.71184895094311[/C][C]-0.411848950943111[/C][/ROW]
[ROW][C]24[/C][C]1.3[/C][C]1.69756323665740[/C][C]-0.397563236657395[/C][/ROW]
[ROW][C]25[/C][C]1.3[/C][C]1.63682664232426[/C][C]-0.336826642324257[/C][/ROW]
[ROW][C]26[/C][C]1.3[/C][C]1.88894170434695[/C][C]-0.588941704346949[/C][/ROW]
[ROW][C]27[/C][C]1.1[/C][C]1.98894170434695[/C][C]-0.888941704346949[/C][/ROW]
[ROW][C]28[/C][C]1.4[/C][C]1.97644170434695[/C][C]-0.576441704346949[/C][/ROW]
[ROW][C]29[/C][C]1.2[/C][C]2.01394170434695[/C][C]-0.813941704346949[/C][/ROW]
[ROW][C]30[/C][C]1.7[/C][C]2.05144170434695[/C][C]-0.351441704346949[/C][/ROW]
[ROW][C]31[/C][C]1.8[/C][C]1.88682664232426[/C][C]-0.0868266423242587[/C][/ROW]
[ROW][C]32[/C][C]1.5[/C][C]2.11394170434695[/C][C]-0.613941704346949[/C][/ROW]
[ROW][C]33[/C][C]1[/C][C]1.94932664232426[/C][C]-0.949326642324259[/C][/ROW]
[ROW][C]34[/C][C]1.6[/C][C]2.21394170434695[/C][C]-0.613941704346949[/C][/ROW]
[ROW][C]35[/C][C]1.5[/C][C]1.72614444003002[/C][C]-0.226144440030018[/C][/ROW]
[ROW][C]36[/C][C]1.8[/C][C]1.71185872574430[/C][C]0.0881412742556973[/C][/ROW]
[ROW][C]37[/C][C]1.8[/C][C]1.65112213141116[/C][C]0.148877868588836[/C][/ROW]
[ROW][C]38[/C][C]1.6[/C][C]1.90323719343386[/C][C]-0.303237193433857[/C][/ROW]
[ROW][C]39[/C][C]1.9[/C][C]2.00323719343386[/C][C]-0.103237193433857[/C][/ROW]
[ROW][C]40[/C][C]1.7[/C][C]1.99073719343386[/C][C]-0.290737193433856[/C][/ROW]
[ROW][C]41[/C][C]1.6[/C][C]2.02823719343386[/C][C]-0.428237193433856[/C][/ROW]
[ROW][C]42[/C][C]1.3[/C][C]2.06573719343386[/C][C]-0.765737193433856[/C][/ROW]
[ROW][C]43[/C][C]1.1[/C][C]1.90112213141117[/C][C]-0.801122131411166[/C][/ROW]
[ROW][C]44[/C][C]1.9[/C][C]2.12823719343386[/C][C]-0.228237193433856[/C][/ROW]
[ROW][C]45[/C][C]2.6[/C][C]1.96362213141117[/C][C]0.636377868588834[/C][/ROW]
[ROW][C]46[/C][C]2.3[/C][C]2.22823719343386[/C][C]0.0717628065661436[/C][/ROW]
[ROW][C]47[/C][C]2.4[/C][C]1.74043992911693[/C][C]0.659560070883074[/C][/ROW]
[ROW][C]48[/C][C]2.2[/C][C]1.72615421483121[/C][C]0.47384578516879[/C][/ROW]
[ROW][C]49[/C][C]2[/C][C]1.66541762049807[/C][C]0.334582379501928[/C][/ROW]
[ROW][C]50[/C][C]2.9[/C][C]1.91753268252076[/C][C]0.982467317479236[/C][/ROW]
[ROW][C]51[/C][C]2.6[/C][C]2.01753268252076[/C][C]0.582467317479236[/C][/ROW]
[ROW][C]52[/C][C]2.3[/C][C]2.00503268252076[/C][C]0.294967317479236[/C][/ROW]
[ROW][C]53[/C][C]2.3[/C][C]2.04253268252076[/C][C]0.257467317479236[/C][/ROW]
[ROW][C]54[/C][C]2.6[/C][C]2.08003268252076[/C][C]0.519967317479236[/C][/ROW]
[ROW][C]55[/C][C]3.1[/C][C]3.63233811667959[/C][C]-0.532338116679594[/C][/ROW]
[ROW][C]56[/C][C]2.8[/C][C]2.14253268252076[/C][C]0.657467317479237[/C][/ROW]
[ROW][C]57[/C][C]2.5[/C][C]1.97791762049807[/C][C]0.522082379501926[/C][/ROW]
[ROW][C]58[/C][C]2.9[/C][C]2.24253268252076[/C][C]0.657467317479236[/C][/ROW]
[ROW][C]59[/C][C]3.1[/C][C]3.47165591438535[/C][C]-0.371655914385354[/C][/ROW]
[ROW][C]60[/C][C]3.1[/C][C]3.45737020009964[/C][C]-0.357370200099638[/C][/ROW]
[ROW][C]61[/C][C]3.2[/C][C]3.3966336057665[/C][C]-0.1966336057665[/C][/ROW]
[ROW][C]62[/C][C]2.5[/C][C]1.93182817160767[/C][C]0.568171828392328[/C][/ROW]
[ROW][C]63[/C][C]2.6[/C][C]2.03182817160767[/C][C]0.568171828392329[/C][/ROW]
[ROW][C]64[/C][C]2.9[/C][C]2.01932817160767[/C][C]0.880671828392329[/C][/ROW]
[ROW][C]65[/C][C]2.6[/C][C]2.05682817160767[/C][C]0.543171828392329[/C][/ROW]
[ROW][C]66[/C][C]2.4[/C][C]2.09432817160767[/C][C]0.305671828392329[/C][/ROW]
[ROW][C]67[/C][C]1.7[/C][C]1.92971310958498[/C][C]-0.229713109584982[/C][/ROW]
[ROW][C]68[/C][C]2[/C][C]2.15682817160767[/C][C]-0.156828171607671[/C][/ROW]
[ROW][C]69[/C][C]2.2[/C][C]1.99221310958498[/C][C]0.207786890415019[/C][/ROW]
[ROW][C]70[/C][C]1.9[/C][C]2.25682817160767[/C][C]-0.356828171607671[/C][/ROW]
[ROW][C]71[/C][C]1.6[/C][C]1.76903090729074[/C][C]-0.169030907290741[/C][/ROW]
[ROW][C]72[/C][C]1.6[/C][C]1.75474519300503[/C][C]-0.154745193005025[/C][/ROW]
[ROW][C]73[/C][C]1.2[/C][C]1.69400859867189[/C][C]-0.494008598671887[/C][/ROW]
[ROW][C]74[/C][C]1.2[/C][C]1.94612366069458[/C][C]-0.74612366069458[/C][/ROW]
[ROW][C]75[/C][C]1.5[/C][C]2.04612366069458[/C][C]-0.546123660694579[/C][/ROW]
[ROW][C]76[/C][C]1.6[/C][C]2.03362366069458[/C][C]-0.433623660694579[/C][/ROW]
[ROW][C]77[/C][C]1.7[/C][C]2.07112366069458[/C][C]-0.371123660694579[/C][/ROW]
[ROW][C]78[/C][C]1.8[/C][C]2.10862366069458[/C][C]-0.308623660694579[/C][/ROW]
[ROW][C]79[/C][C]1.8[/C][C]1.94400859867189[/C][C]-0.144008598671889[/C][/ROW]
[ROW][C]80[/C][C]1.8[/C][C]2.17112366069458[/C][C]-0.371123660694579[/C][/ROW]
[ROW][C]81[/C][C]1.3[/C][C]2.00650859867189[/C][C]-0.706508598671889[/C][/ROW]
[ROW][C]82[/C][C]1.3[/C][C]2.27112366069458[/C][C]-0.971123660694578[/C][/ROW]
[ROW][C]83[/C][C]1.4[/C][C]1.78332639637765[/C][C]-0.383326396377649[/C][/ROW]
[ROW][C]84[/C][C]1.1[/C][C]1.76904068209193[/C][C]-0.669040682091933[/C][/ROW]
[ROW][C]85[/C][C]1.5[/C][C]1.70830408775879[/C][C]-0.208304087758795[/C][/ROW]
[ROW][C]86[/C][C]2.2[/C][C]1.96041914978149[/C][C]0.239580850218513[/C][/ROW]
[ROW][C]87[/C][C]2.9[/C][C]2.06041914978149[/C][C]0.839580850218513[/C][/ROW]
[ROW][C]88[/C][C]3.1[/C][C]3.76483964596301[/C][C]-0.664839645963007[/C][/ROW]
[ROW][C]89[/C][C]3.5[/C][C]3.80233964596301[/C][C]-0.302339645963007[/C][/ROW]
[ROW][C]90[/C][C]3.6[/C][C]3.83983964596301[/C][C]-0.239839645963007[/C][/ROW]
[ROW][C]91[/C][C]4.4[/C][C]3.67522458394032[/C][C]0.724775416059683[/C][/ROW]
[ROW][C]92[/C][C]4.2[/C][C]3.90233964596301[/C][C]0.297660354036993[/C][/ROW]
[ROW][C]93[/C][C]5.2[/C][C]3.73772458394032[/C][C]1.46227541605968[/C][/ROW]
[ROW][C]94[/C][C]5.8[/C][C]4.00233964596301[/C][C]1.79766035403699[/C][/ROW]
[/TABLE]
Source: https://freestatistics.org/blog/index.php?pk=25039&T=4

Globally Unique Identifier (entire table): ba.freestatistics.org/blog/index.php?pk=25039&T=4

As an alternative you can also use a QR Code:  

The GUIDs for individual cells are displayed in the table below:

Multiple Linear Regression - Actuals, Interpolation, and Residuals
Time or IndexActualsInterpolationForecastResidualsPrediction Error
13.43.325156160331970.0748438396680255
233.57727122235465-0.577271222354654
33.13.67727122235465-0.577271222354654
42.51.947850726173130.552149273826867
52.21.985350726173130.214649273826866
62.32.022850726173130.277149273826866
72.11.858235664150440.241764335849557
82.82.085350726173130.714649273826866
93.13.63765616033196-0.537656160331963
102.92.185350726173130.714649273826866
112.61.697553461856200.902446538143796
122.71.683267747570491.01673225242951
132.31.622531153237350.67746884676265
142.31.874646215260040.425353784739959
152.11.974646215260040.125353784739959
162.21.962146215260040.237853784739959
172.91.999646215260040.900353784739959
182.62.037146215260040.562853784739959
192.71.872531153237350.827468846762649
201.82.09964621526004-0.299646215260041
211.31.93503115323735-0.635031153237351
220.92.19964621526004-1.29964621526004
231.31.71184895094311-0.411848950943111
241.31.69756323665740-0.397563236657395
251.31.63682664232426-0.336826642324257
261.31.88894170434695-0.588941704346949
271.11.98894170434695-0.888941704346949
281.41.97644170434695-0.576441704346949
291.22.01394170434695-0.813941704346949
301.72.05144170434695-0.351441704346949
311.81.88682664232426-0.0868266423242587
321.52.11394170434695-0.613941704346949
3311.94932664232426-0.949326642324259
341.62.21394170434695-0.613941704346949
351.51.72614444003002-0.226144440030018
361.81.711858725744300.0881412742556973
371.81.651122131411160.148877868588836
381.61.90323719343386-0.303237193433857
391.92.00323719343386-0.103237193433857
401.71.99073719343386-0.290737193433856
411.62.02823719343386-0.428237193433856
421.32.06573719343386-0.765737193433856
431.11.90112213141117-0.801122131411166
441.92.12823719343386-0.228237193433856
452.61.963622131411170.636377868588834
462.32.228237193433860.0717628065661436
472.41.740439929116930.659560070883074
482.21.726154214831210.47384578516879
4921.665417620498070.334582379501928
502.91.917532682520760.982467317479236
512.62.017532682520760.582467317479236
522.32.005032682520760.294967317479236
532.32.042532682520760.257467317479236
542.62.080032682520760.519967317479236
553.13.63233811667959-0.532338116679594
562.82.142532682520760.657467317479237
572.51.977917620498070.522082379501926
582.92.242532682520760.657467317479236
593.13.47165591438535-0.371655914385354
603.13.45737020009964-0.357370200099638
613.23.3966336057665-0.1966336057665
622.51.931828171607670.568171828392328
632.62.031828171607670.568171828392329
642.92.019328171607670.880671828392329
652.62.056828171607670.543171828392329
662.42.094328171607670.305671828392329
671.71.92971310958498-0.229713109584982
6822.15682817160767-0.156828171607671
692.21.992213109584980.207786890415019
701.92.25682817160767-0.356828171607671
711.61.76903090729074-0.169030907290741
721.61.75474519300503-0.154745193005025
731.21.69400859867189-0.494008598671887
741.21.94612366069458-0.74612366069458
751.52.04612366069458-0.546123660694579
761.62.03362366069458-0.433623660694579
771.72.07112366069458-0.371123660694579
781.82.10862366069458-0.308623660694579
791.81.94400859867189-0.144008598671889
801.82.17112366069458-0.371123660694579
811.32.00650859867189-0.706508598671889
821.32.27112366069458-0.971123660694578
831.41.78332639637765-0.383326396377649
841.11.76904068209193-0.669040682091933
851.51.70830408775879-0.208304087758795
862.21.960419149781490.239580850218513
872.92.060419149781490.839580850218513
883.13.76483964596301-0.664839645963007
893.53.80233964596301-0.302339645963007
903.63.83983964596301-0.239839645963007
914.43.675224583940320.724775416059683
924.23.902339645963010.297660354036993
935.23.737724583940321.46227541605968
945.84.002339645963011.79766035403699


Parameters (Session):
par1 = 1 ; par2 = Include Monthly Dummies ; par3 = Linear Trend ;
Parameters (R input):
par1 = 1 ; par2 = Include Monthly Dummies ; par3 = Linear Trend ;
R code (references can be found in the software module):
library(lattice)
par1 <- as.numeric(par1)
x <- t(y)
k <- length(x[1,])
n <- length(x[,1])
x1 <- cbind(x[,par1], x[,1:k!=par1])
mycolnames <- c(colnames(x)[par1], colnames(x)[1:k!=par1])
colnames(x1) <- mycolnames #colnames(x)[par1]
x <- x1
if (par3 == 'First Differences'){
x2 <- array(0, dim=c(n-1,k), dimnames=list(1:(n-1), paste('(1-B)',colnames(x),sep='')))
for (i in 1:n-1) {
for (j in 1:k) {
x2[i,j] <- x[i+1,j] - x[i,j]
}
}
x <- x2
}
if (par2 == 'Include Monthly Dummies'){
x2 <- array(0, dim=c(n,11), dimnames=list(1:n, paste('M', seq(1:11), sep ='')))
for (i in 1:11){
x2[seq(i,n,12),i] <- 1
}
x <- cbind(x, x2)
}
if (par2 == 'Include Quarterly Dummies'){
x2 <- array(0, dim=c(n,3), dimnames=list(1:n, paste('Q', seq(1:3), sep ='')))
for (i in 1:3){
x2[seq(i,n,4),i] <- 1
}
x <- cbind(x, x2)
}
k <- length(x[1,])
if (par3 == 'Linear Trend'){
x <- cbind(x, c(1:n))
colnames(x)[k+1] <- 't'
}
x
k <- length(x[1,])
df <- as.data.frame(x)
(mylm <- lm(df))
(mysum <- summary(mylm))
bitmap(file='test0.png')
plot(x[,1], type='l', main='Actuals and Interpolation', ylab='value of Actuals and Interpolation (dots)', xlab='time or index')
points(x[,1]-mysum$resid)
grid()
dev.off()
bitmap(file='test1.png')
plot(mysum$resid, type='b', pch=19, main='Residuals', ylab='value of Residuals', xlab='time or index')
grid()
dev.off()
bitmap(file='test2.png')
hist(mysum$resid, main='Residual Histogram', xlab='values of Residuals')
grid()
dev.off()
bitmap(file='test3.png')
densityplot(~mysum$resid,col='black',main='Residual Density Plot', xlab='values of Residuals')
dev.off()
bitmap(file='test4.png')
qqnorm(mysum$resid, main='Residual Normal Q-Q Plot')
grid()
dev.off()
(myerror <- as.ts(mysum$resid))
bitmap(file='test5.png')
dum <- cbind(lag(myerror,k=1),myerror)
dum
dum1 <- dum[2:length(myerror),]
dum1
z <- as.data.frame(dum1)
z
plot(z,main=paste('Residual Lag plot, lowess, and regression line'), ylab='values of Residuals', xlab='lagged values of Residuals')
lines(lowess(z))
abline(lm(z))
grid()
dev.off()
bitmap(file='test6.png')
acf(mysum$resid, lag.max=length(mysum$resid)/2, main='Residual Autocorrelation Function')
grid()
dev.off()
bitmap(file='test7.png')
pacf(mysum$resid, lag.max=length(mysum$resid)/2, main='Residual Partial Autocorrelation Function')
grid()
dev.off()
bitmap(file='test8.png')
opar <- par(mfrow = c(2,2), oma = c(0, 0, 1.1, 0))
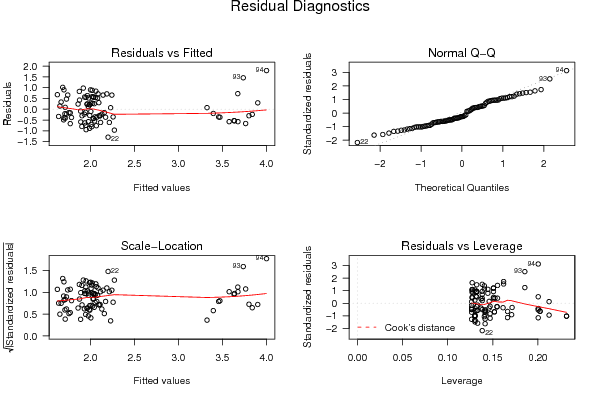
plot(mylm, las = 1, sub='Residual Diagnostics')
par(opar)
dev.off()
load(file='createtable')
a<-table.start()
a<-table.row.start(a)
a<-table.element(a, 'Multiple Linear Regression - Estimated Regression Equation', 1, TRUE)
a<-table.row.end(a)
myeq <- colnames(x)[1]
myeq <- paste(myeq, '[t] = ', sep='')
for (i in 1:k){
if (mysum$coefficients[i,1] > 0) myeq <- paste(myeq, '+', '')
myeq <- paste(myeq, mysum$coefficients[i,1], sep=' ')
if (rownames(mysum$coefficients)[i] != '(Intercept)') {
myeq <- paste(myeq, rownames(mysum$coefficients)[i], sep='')
if (rownames(mysum$coefficients)[i] != 't') myeq <- paste(myeq, '[t]', sep='')
}
}
myeq <- paste(myeq, ' + e[t]')
a<-table.row.start(a)
a<-table.element(a, myeq)
a<-table.row.end(a)
a<-table.end(a)
table.save(a,file='mytable1.tab')
a<-table.start()
a<-table.row.start(a)
a<-table.element(a,hyperlink('ols1.htm','Multiple Linear Regression - Ordinary Least Squares',''), 6, TRUE)
a<-table.row.end(a)
a<-table.row.start(a)
a<-table.element(a,'Variable',header=TRUE)
a<-table.element(a,'Parameter',header=TRUE)
a<-table.element(a,'S.D.',header=TRUE)
a<-table.element(a,'T-STAT
H0: parameter = 0',header=TRUE)
a<-table.element(a,'2-tail p-value',header=TRUE)
a<-table.element(a,'1-tail p-value',header=TRUE)
a<-table.row.end(a)
for (i in 1:k){
a<-table.row.start(a)
a<-table.element(a,rownames(mysum$coefficients)[i],header=TRUE)
a<-table.element(a,mysum$coefficients[i,1])
a<-table.element(a, round(mysum$coefficients[i,2],6))
a<-table.element(a, round(mysum$coefficients[i,3],4))
a<-table.element(a, round(mysum$coefficients[i,4],6))
a<-table.element(a, round(mysum$coefficients[i,4]/2,6))
a<-table.row.end(a)
}
a<-table.end(a)
table.save(a,file='mytable2.tab')
a<-table.start()
a<-table.row.start(a)
a<-table.element(a, 'Multiple Linear Regression - Regression Statistics', 2, TRUE)
a<-table.row.end(a)
a<-table.row.start(a)
a<-table.element(a, 'Multiple R',1,TRUE)
a<-table.element(a, sqrt(mysum$r.squared))
a<-table.row.end(a)
a<-table.row.start(a)
a<-table.element(a, 'R-squared',1,TRUE)
a<-table.element(a, mysum$r.squared)
a<-table.row.end(a)
a<-table.row.start(a)
a<-table.element(a, 'Adjusted R-squared',1,TRUE)
a<-table.element(a, mysum$adj.r.squared)
a<-table.row.end(a)
a<-table.row.start(a)
a<-table.element(a, 'F-TEST (value)',1,TRUE)
a<-table.element(a, mysum$fstatistic[1])
a<-table.row.end(a)
a<-table.row.start(a)
a<-table.element(a, 'F-TEST (DF numerator)',1,TRUE)
a<-table.element(a, mysum$fstatistic[2])
a<-table.row.end(a)
a<-table.row.start(a)
a<-table.element(a, 'F-TEST (DF denominator)',1,TRUE)
a<-table.element(a, mysum$fstatistic[3])
a<-table.row.end(a)
a<-table.row.start(a)
a<-table.element(a, 'p-value',1,TRUE)
a<-table.element(a, 1-pf(mysum$fstatistic[1],mysum$fstatistic[2],mysum$fstatistic[3]))
a<-table.row.end(a)
a<-table.row.start(a)
a<-table.element(a, 'Multiple Linear Regression - Residual Statistics', 2, TRUE)
a<-table.row.end(a)
a<-table.row.start(a)
a<-table.element(a, 'Residual Standard Deviation',1,TRUE)
a<-table.element(a, mysum$sigma)
a<-table.row.end(a)
a<-table.row.start(a)
a<-table.element(a, 'Sum Squared Residuals',1,TRUE)
a<-table.element(a, sum(myerror*myerror))
a<-table.row.end(a)
a<-table.end(a)
table.save(a,file='mytable3.tab')
a<-table.start()
a<-table.row.start(a)
a<-table.element(a, 'Multiple Linear Regression - Actuals, Interpolation, and Residuals', 4, TRUE)
a<-table.row.end(a)
a<-table.row.start(a)
a<-table.element(a, 'Time or Index', 1, TRUE)
a<-table.element(a, 'Actuals', 1, TRUE)
a<-table.element(a, 'Interpolation
Forecast', 1, TRUE)
a<-table.element(a, 'Residuals
Prediction Error', 1, TRUE)
a<-table.row.end(a)
for (i in 1:n) {
a<-table.row.start(a)
a<-table.element(a,i, 1, TRUE)
a<-table.element(a,x[i])
a<-table.element(a,x[i]-mysum$resid[i])
a<-table.element(a,mysum$resid[i])
a<-table.row.end(a)
}
a<-table.end(a)
table.save(a,file='mytable4.tab')