of Irreproducible Research!
Description of Statistical Computation | |||||||||||||||||||||||||||||||||||||||||||||||||||||||||||||||||||||||||||||||||||||||||||||||||||||||||||||||||||||||||||||||||
|---|---|---|---|---|---|---|---|---|---|---|---|---|---|---|---|---|---|---|---|---|---|---|---|---|---|---|---|---|---|---|---|---|---|---|---|---|---|---|---|---|---|---|---|---|---|---|---|---|---|---|---|---|---|---|---|---|---|---|---|---|---|---|---|---|---|---|---|---|---|---|---|---|---|---|---|---|---|---|---|---|---|---|---|---|---|---|---|---|---|---|---|---|---|---|---|---|---|---|---|---|---|---|---|---|---|---|---|---|---|---|---|---|---|---|---|---|---|---|---|---|---|---|---|---|---|---|---|---|---|
| Author's title | |||||||||||||||||||||||||||||||||||||||||||||||||||||||||||||||||||||||||||||||||||||||||||||||||||||||||||||||||||||||||||||||||
| Author | *The author of this computation has been verified* | ||||||||||||||||||||||||||||||||||||||||||||||||||||||||||||||||||||||||||||||||||||||||||||||||||||||||||||||||||||||||||||||||
| R Software Module | rwasp_smp.wasp | ||||||||||||||||||||||||||||||||||||||||||||||||||||||||||||||||||||||||||||||||||||||||||||||||||||||||||||||||||||||||||||||||
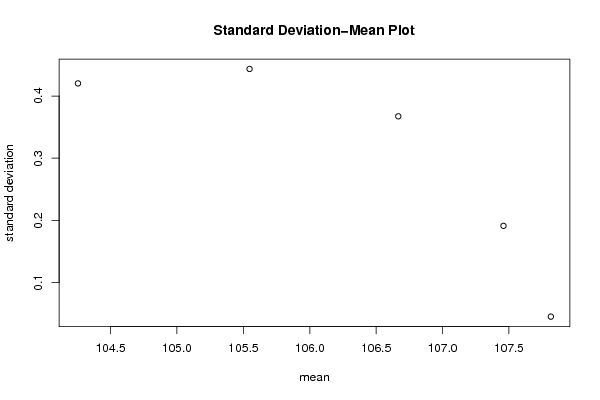
| Title produced by software | Standard Deviation-Mean Plot | ||||||||||||||||||||||||||||||||||||||||||||||||||||||||||||||||||||||||||||||||||||||||||||||||||||||||||||||||||||||||||||||||
| Date of computation | Tue, 20 Dec 2011 14:19:22 -0500 | ||||||||||||||||||||||||||||||||||||||||||||||||||||||||||||||||||||||||||||||||||||||||||||||||||||||||||||||||||||||||||||||||
| Cite this page as follows | Statistical Computations at FreeStatistics.org, Office for Research Development and Education, URL https://freestatistics.org/blog/index.php?v=date/2011/Dec/20/t13244088017z2bo5e4g7tfcok.htm/, Retrieved Mon, 10 Nov 2025 00:56:03 +0000 | ||||||||||||||||||||||||||||||||||||||||||||||||||||||||||||||||||||||||||||||||||||||||||||||||||||||||||||||||||||||||||||||||
| Statistical Computations at FreeStatistics.org, Office for Research Development and Education, URL https://freestatistics.org/blog/index.php?pk=158174, Retrieved Mon, 10 Nov 2025 00:56:03 +0000 | |||||||||||||||||||||||||||||||||||||||||||||||||||||||||||||||||||||||||||||||||||||||||||||||||||||||||||||||||||||||||||||||||
| QR Codes: | |||||||||||||||||||||||||||||||||||||||||||||||||||||||||||||||||||||||||||||||||||||||||||||||||||||||||||||||||||||||||||||||||
|
| |||||||||||||||||||||||||||||||||||||||||||||||||||||||||||||||||||||||||||||||||||||||||||||||||||||||||||||||||||||||||||||||||
| Original text written by user: | |||||||||||||||||||||||||||||||||||||||||||||||||||||||||||||||||||||||||||||||||||||||||||||||||||||||||||||||||||||||||||||||||
| IsPrivate? | No (this computation is public) | ||||||||||||||||||||||||||||||||||||||||||||||||||||||||||||||||||||||||||||||||||||||||||||||||||||||||||||||||||||||||||||||||
| User-defined keywords | |||||||||||||||||||||||||||||||||||||||||||||||||||||||||||||||||||||||||||||||||||||||||||||||||||||||||||||||||||||||||||||||||
| Estimated Impact | 343 | ||||||||||||||||||||||||||||||||||||||||||||||||||||||||||||||||||||||||||||||||||||||||||||||||||||||||||||||||||||||||||||||||
Tree of Dependent Computations | |||||||||||||||||||||||||||||||||||||||||||||||||||||||||||||||||||||||||||||||||||||||||||||||||||||||||||||||||||||||||||||||||
| Family? (F = Feedback message, R = changed R code, M = changed R Module, P = changed Parameters, D = changed Data) | |||||||||||||||||||||||||||||||||||||||||||||||||||||||||||||||||||||||||||||||||||||||||||||||||||||||||||||||||||||||||||||||||
| - [Univariate Explorative Data Analysis] [Run Sequence gebo...] [2008-12-12 13:32:37] [76963dc1903f0f612b6153510a3818cf] - R D [Univariate Explorative Data Analysis] [Run Sequence gebo...] [2008-12-17 12:14:40] [76963dc1903f0f612b6153510a3818cf] - [Univariate Explorative Data Analysis] [Run Sequence Plot...] [2008-12-22 18:19:51] [1ce0d16c8f4225c977b42c8fa93bc163] - RMP [Standard Deviation-Mean Plot] [Identifying Integ...] [2009-11-22 12:50:05] [b98453cac15ba1066b407e146608df68] - D [Standard Deviation-Mean Plot] [WS 8 30] [2009-11-22 15:55:09] [6e4e01d7eb22a9f33d58ebb35753a195] - D [Standard Deviation-Mean Plot] [Paper heteroskeda...] [2010-12-21 11:22:29] [a9e130f95bad0a0597234e75c6380c5a] - D [Standard Deviation-Mean Plot] [] [2011-12-20 19:19:22] [3b32143baae8ca4a077b118800e50af3] [Current] | |||||||||||||||||||||||||||||||||||||||||||||||||||||||||||||||||||||||||||||||||||||||||||||||||||||||||||||||||||||||||||||||||
| Feedback Forum | |||||||||||||||||||||||||||||||||||||||||||||||||||||||||||||||||||||||||||||||||||||||||||||||||||||||||||||||||||||||||||||||||
Post a new message | |||||||||||||||||||||||||||||||||||||||||||||||||||||||||||||||||||||||||||||||||||||||||||||||||||||||||||||||||||||||||||||||||
Dataset | |||||||||||||||||||||||||||||||||||||||||||||||||||||||||||||||||||||||||||||||||||||||||||||||||||||||||||||||||||||||||||||||||
| Dataseries X: | |||||||||||||||||||||||||||||||||||||||||||||||||||||||||||||||||||||||||||||||||||||||||||||||||||||||||||||||||||||||||||||||||
103.7 103.75 103.85 104.02 104.13 104.17 104.18 104.2 104.5 104.78 104.88 104.89 104.9 104.95 105.24 105.35 105.44 105.46 105.47 105.48 105.75 106.1 106.19 106.23 106.24 106.25 106.35 106.48 106.52 106.55 106.55 106.56 106.89 107.09 107.24 107.28 107.3 107.31 107.47 107.35 107.31 107.32 107.32 107.34 107.53 107.72 107.75 107.79 107.81 107.9 107.8 107.86 107.8 107.74 107.75 107.83 107.8 107.81 107.86 107.83 | |||||||||||||||||||||||||||||||||||||||||||||||||||||||||||||||||||||||||||||||||||||||||||||||||||||||||||||||||||||||||||||||||
Tables (Output of Computation) | |||||||||||||||||||||||||||||||||||||||||||||||||||||||||||||||||||||||||||||||||||||||||||||||||||||||||||||||||||||||||||||||||
\begin{tabular}{lllllllll}
\hline
Summary of computational transaction \tabularnewline
Raw Input & view raw input (R code) \tabularnewline
Raw Output & view raw output of R engine \tabularnewline
Computing time & 1 seconds \tabularnewline
R Server & 'Gertrude Mary Cox' @ cox.wessa.net \tabularnewline
\hline
\end{tabular}
%Source: https://freestatistics.org/blog/index.php?pk=158174&T=0[TABLE] [ROW][C]Summary of computational transaction[/C][/ROW] [ROW][C]Raw Input[/C][C]view raw input (R code) [/C][/ROW] [ROW][C]Raw Output[/C][C]view raw output of R engine [/C][/ROW] [ROW][C]Computing time[/C][C]1 seconds[/C][/ROW] [ROW][C]R Server[/C][C]'Gertrude Mary Cox' @ cox.wessa.net[/C][/ROW] [/TABLE] Source: https://freestatistics.org/blog/index.php?pk=158174&T=0
Globally Unique Identifier (entire table): ba.freestatistics.org/blog/index.php?pk=158174&T=0
As an alternative you can also use a QR Code: The GUIDs for individual cells are displayed in the table below:
\begin{tabular}{lllllllll}
\hline
Standard Deviation-Mean Plot \tabularnewline
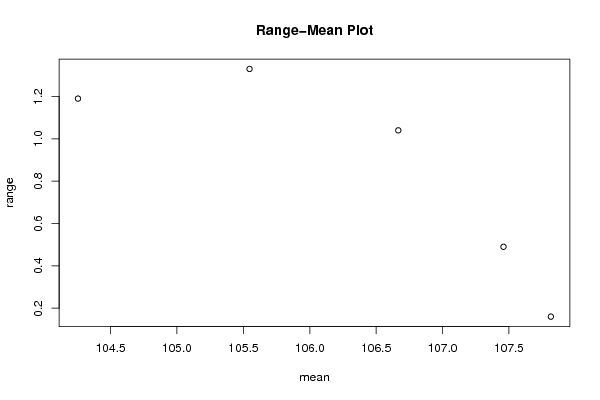
Section & Mean & Standard Deviation & Range \tabularnewline
1 & 104.254166666667 & 0.420312834431544 & 1.19 \tabularnewline
2 & 105.546666666667 & 0.443587304788692 & 1.33 \tabularnewline
3 & 106.666666666667 & 0.367406966166783 & 1.04000000000001 \tabularnewline
4 & 107.459166666667 & 0.191142894350292 & 0.490000000000009 \tabularnewline
5 & 107.815833333333 & 0.0450168318689278 & 0.160000000000011 \tabularnewline
\hline
\end{tabular}
%Source: https://freestatistics.org/blog/index.php?pk=158174&T=1[TABLE] [ROW][C]Standard Deviation-Mean Plot[/C][/ROW] [ROW][C]Section[/C][C]Mean[/C][C]Standard Deviation[/C][C]Range[/C][/ROW] [ROW][C]1[/C][C]104.254166666667[/C][C]0.420312834431544[/C][C]1.19[/C][/ROW] [ROW][C]2[/C][C]105.546666666667[/C][C]0.443587304788692[/C][C]1.33[/C][/ROW] [ROW][C]3[/C][C]106.666666666667[/C][C]0.367406966166783[/C][C]1.04000000000001[/C][/ROW] [ROW][C]4[/C][C]107.459166666667[/C][C]0.191142894350292[/C][C]0.490000000000009[/C][/ROW] [ROW][C]5[/C][C]107.815833333333[/C][C]0.0450168318689278[/C][C]0.160000000000011[/C][/ROW] [/TABLE] Source: https://freestatistics.org/blog/index.php?pk=158174&T=1
Globally Unique Identifier (entire table): ba.freestatistics.org/blog/index.php?pk=158174&T=1
As an alternative you can also use a QR Code: The GUIDs for individual cells are displayed in the table below:
\begin{tabular}{lllllllll}
\hline
Regression: S.E.(k) = alpha + beta * Mean(k) \tabularnewline
alpha & 10.7910692515507 \tabularnewline
beta & -0.0987092049744891 \tabularnewline
S.D. & 0.0361034652387599 \tabularnewline
T-STAT & -2.73406456476419 \tabularnewline
p-value & 0.0716951193758454 \tabularnewline
\hline
\end{tabular}
%Source: https://freestatistics.org/blog/index.php?pk=158174&T=2[TABLE] [ROW][C]Regression: S.E.(k) = alpha + beta * Mean(k)[/C][/ROW] [ROW][C]alpha[/C][C]10.7910692515507[/C][/ROW] [ROW][C]beta[/C][C]-0.0987092049744891[/C][/ROW] [ROW][C]S.D.[/C][C]0.0361034652387599[/C][/ROW] [ROW][C]T-STAT[/C][C]-2.73406456476419[/C][/ROW] [ROW][C]p-value[/C][C]0.0716951193758454[/C][/ROW] [/TABLE] Source: https://freestatistics.org/blog/index.php?pk=158174&T=2
Globally Unique Identifier (entire table): ba.freestatistics.org/blog/index.php?pk=158174&T=2
As an alternative you can also use a QR Code: The GUIDs for individual cells are displayed in the table below:
\begin{tabular}{lllllllll}
\hline
Regression: ln S.E.(k) = alpha + beta * ln Mean(k) \tabularnewline
alpha & 243.974771369762 \tabularnewline
beta & -52.5992438426602 \tabularnewline
S.D. & 26.6304621322218 \tabularnewline
T-STAT & -1.97515325049569 \tabularnewline
p-value & 0.142728873961931 \tabularnewline
Lambda & 53.5992438426602 \tabularnewline
\hline
\end{tabular}
%Source: https://freestatistics.org/blog/index.php?pk=158174&T=3[TABLE] [ROW][C]Regression: ln S.E.(k) = alpha + beta * ln Mean(k)[/C][/ROW] [ROW][C]alpha[/C][C]243.974771369762[/C][/ROW] [ROW][C]beta[/C][C]-52.5992438426602[/C][/ROW] [ROW][C]S.D.[/C][C]26.6304621322218[/C][/ROW] [ROW][C]T-STAT[/C][C]-1.97515325049569[/C][/ROW] [ROW][C]p-value[/C][C]0.142728873961931[/C][/ROW] [ROW][C]Lambda[/C][C]53.5992438426602[/C][/ROW] [/TABLE] Source: https://freestatistics.org/blog/index.php?pk=158174&T=3
Globally Unique Identifier (entire table): ba.freestatistics.org/blog/index.php?pk=158174&T=3
As an alternative you can also use a QR Code: The GUIDs for individual cells are displayed in the table below:
| |||||||||||||||||||||||||||||||||||||||||||||||||||||||||||||||||||||||||||||||||||||||||||||||||||||||||||||||||||||||||||||||||
Figures (Output of Computation) | |||||||||||||||||||||||||||||||||||||||||||||||||||||||||||||||||||||||||||||||||||||||||||||||||||||||||||||||||||||||||||||||||
Input Parameters & R Code | |||||||||||||||||||||||||||||||||||||||||||||||||||||||||||||||||||||||||||||||||||||||||||||||||||||||||||||||||||||||||||||||||
| Parameters (Session): | |||||||||||||||||||||||||||||||||||||||||||||||||||||||||||||||||||||||||||||||||||||||||||||||||||||||||||||||||||||||||||||||||
| par1 = 12 ; | |||||||||||||||||||||||||||||||||||||||||||||||||||||||||||||||||||||||||||||||||||||||||||||||||||||||||||||||||||||||||||||||||
| Parameters (R input): | |||||||||||||||||||||||||||||||||||||||||||||||||||||||||||||||||||||||||||||||||||||||||||||||||||||||||||||||||||||||||||||||||
| par1 = 12 ; | |||||||||||||||||||||||||||||||||||||||||||||||||||||||||||||||||||||||||||||||||||||||||||||||||||||||||||||||||||||||||||||||||
| R code (references can be found in the software module): | |||||||||||||||||||||||||||||||||||||||||||||||||||||||||||||||||||||||||||||||||||||||||||||||||||||||||||||||||||||||||||||||||
par1 <- as.numeric(par1) | |||||||||||||||||||||||||||||||||||||||||||||||||||||||||||||||||||||||||||||||||||||||||||||||||||||||||||||||||||||||||||||||||