Free Statistics

of Irreproducible Research!

Author's title

Author*The author of this computation has been verified*
R Software Modulerwasp_autocorrelation.wasp
Title produced by software(Partial) Autocorrelation Function
Date of computationWed, 23 Dec 2009 12:36:20 -0700
Cite this page as followsStatistical Computations at FreeStatistics.org, Office for Research Development and Education, URL https://freestatistics.org/blog/index.php?v=date/2009/Dec/23/t1261597096y3958hxzzed1q4q.htm/, Retrieved Thu, 31 Oct 2024 23:12:03 +0000
Statistical Computations at FreeStatistics.org, Office for Research Development and Education, URL https://freestatistics.org/blog/index.php?pk=70561, Retrieved Thu, 31 Oct 2024 23:12:03 +0000
QR Codes:

Original text written by user:
IsPrivate?No (this computation is public)
User-defined keywords
Estimated Impact147
Family? (F = Feedback message, R = changed R code, M = changed R Module, P = changed Parameters, D = changed Data)
-     [Univariate Explorative Data Analysis] [Run Sequence gebo...] [2008-12-12 13:32:37] [76963dc1903f0f612b6153510a3818cf]
- R  D  [Univariate Explorative Data Analysis] [Run Sequence gebo...] [2008-12-17 12:14:40] [76963dc1903f0f612b6153510a3818cf]
-         [Univariate Explorative Data Analysis] [Run Sequence Plot...] [2008-12-22 18:19:51] [1ce0d16c8f4225c977b42c8fa93bc163]
- RMP       [(Partial) Autocorrelation Function] [Identifying Integ...] [2009-11-22 12:16:10] [b98453cac15ba1066b407e146608df68]
-    D          [(Partial) Autocorrelation Function] [paper ind pr ACF] [2009-12-23 19:36:20] [ac4f1d4b47349b2602192853b2bc5b72] [Current]
Feedback Forum

Post a new message
Dataseries X:
95,1
97
112,7
102,9
97,4
111,4
87,4
96,8
114,1
110,3
103,9
101,6
94,6
95,9
104,7
102,8
98,1
113,9
80,9
95,7
113,2
105,9
108,8
102,3
99
100,7
115,5
100,7
109,9
114,6
85,4
100,5
114,8
116,5
112,9
102
106
105,3
118,8
106,1
109,3
117,2
92,5
104,2
112,5
122,4
113,3
100
110,7
112,8
109,8
117,3
109,1
115,9
96
99,8
116,8
115,7
99,4
94,3


Summary of computational transaction
Raw Inputview raw input (R code)
Raw Outputview raw output of R engine
Computing time2 seconds
R Server'Gwilym Jenkins' @ 72.249.127.135

\begin{tabular}{lllllllll}
\hline
Summary of computational transaction \tabularnewline
Raw Input & view raw input (R code)  \tabularnewline
Raw Output & view raw output of R engine  \tabularnewline
Computing time & 2 seconds \tabularnewline
R Server & 'Gwilym Jenkins' @ 72.249.127.135 \tabularnewline
\hline
\end{tabular}
%Source: https://freestatistics.org/blog/index.php?pk=70561&T=0

[TABLE]
[ROW][C]Summary of computational transaction[/C][/ROW]
[ROW][C]Raw Input[/C][C]view raw input (R code) [/C][/ROW]
[ROW][C]Raw Output[/C][C]view raw output of R engine [/C][/ROW]
[ROW][C]Computing time[/C][C]2 seconds[/C][/ROW]
[ROW][C]R Server[/C][C]'Gwilym Jenkins' @ 72.249.127.135[/C][/ROW]
[/TABLE]
Source: https://freestatistics.org/blog/index.php?pk=70561&T=0

Globally Unique Identifier (entire table): ba.freestatistics.org/blog/index.php?pk=70561&T=0

As an alternative you can also use a QR Code:  

The GUIDs for individual cells are displayed in the table below:

Summary of computational transaction
Raw Inputview raw input (R code)
Raw Outputview raw output of R engine
Computing time2 seconds
R Server'Gwilym Jenkins' @ 72.249.127.135


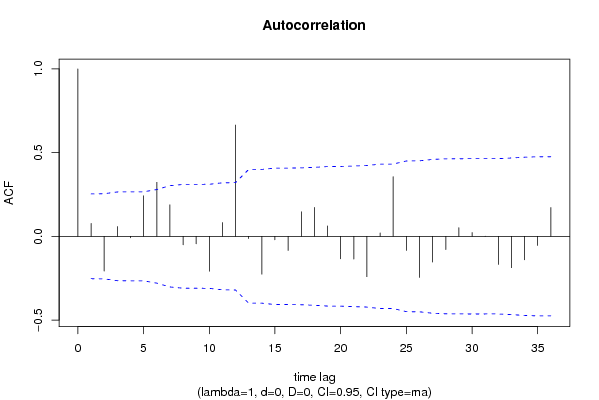
Autocorrelation Function
Time lag kACF(k)T-STATP-value
10.0768180.5950.277031
2-0.207379-1.60640.056724
30.0586450.45430.32564
4-0.008756-0.06780.473076
50.241811.8730.032968
60.323022.50210.007545
70.1880871.45690.075176
8-0.050881-0.39410.347445
9-0.045053-0.3490.364162
10-0.208203-1.61270.056025
110.0822810.63730.263163
120.664675.14852e-06
13-0.013131-0.10170.459663
14-0.226541-1.75480.042201
15-0.02089-0.16180.435997
16-0.084286-0.65290.258164
170.146121.13180.131103
180.1722541.33430.093578
190.0620010.48030.316395
20-0.13448-1.04170.150871
21-0.136071-1.0540.148054
22-0.241317-1.86920.033237
230.0199590.15460.438827
240.3563572.76030.003824
25-0.084569-0.65510.257463
26-0.2458-1.9040.030857
27-0.153622-1.190.119376
28-0.07915-0.61310.271065
290.0514050.39820.345954
300.0225460.17460.430975
310.0010610.00820.496734
32-0.168031-1.30160.09902
33-0.187117-1.44940.076216
34-0.140416-1.08770.140548
35-0.054875-0.42510.336156
360.1716171.32930.094385

\begin{tabular}{lllllllll}
\hline
Autocorrelation Function \tabularnewline
Time lag k & ACF(k) & T-STAT & P-value \tabularnewline
1 & 0.076818 & 0.595 & 0.277031 \tabularnewline
2 & -0.207379 & -1.6064 & 0.056724 \tabularnewline
3 & 0.058645 & 0.4543 & 0.32564 \tabularnewline
4 & -0.008756 & -0.0678 & 0.473076 \tabularnewline
5 & 0.24181 & 1.873 & 0.032968 \tabularnewline
6 & 0.32302 & 2.5021 & 0.007545 \tabularnewline
7 & 0.188087 & 1.4569 & 0.075176 \tabularnewline
8 & -0.050881 & -0.3941 & 0.347445 \tabularnewline
9 & -0.045053 & -0.349 & 0.364162 \tabularnewline
10 & -0.208203 & -1.6127 & 0.056025 \tabularnewline
11 & 0.082281 & 0.6373 & 0.263163 \tabularnewline
12 & 0.66467 & 5.1485 & 2e-06 \tabularnewline
13 & -0.013131 & -0.1017 & 0.459663 \tabularnewline
14 & -0.226541 & -1.7548 & 0.042201 \tabularnewline
15 & -0.02089 & -0.1618 & 0.435997 \tabularnewline
16 & -0.084286 & -0.6529 & 0.258164 \tabularnewline
17 & 0.14612 & 1.1318 & 0.131103 \tabularnewline
18 & 0.172254 & 1.3343 & 0.093578 \tabularnewline
19 & 0.062001 & 0.4803 & 0.316395 \tabularnewline
20 & -0.13448 & -1.0417 & 0.150871 \tabularnewline
21 & -0.136071 & -1.054 & 0.148054 \tabularnewline
22 & -0.241317 & -1.8692 & 0.033237 \tabularnewline
23 & 0.019959 & 0.1546 & 0.438827 \tabularnewline
24 & 0.356357 & 2.7603 & 0.003824 \tabularnewline
25 & -0.084569 & -0.6551 & 0.257463 \tabularnewline
26 & -0.2458 & -1.904 & 0.030857 \tabularnewline
27 & -0.153622 & -1.19 & 0.119376 \tabularnewline
28 & -0.07915 & -0.6131 & 0.271065 \tabularnewline
29 & 0.051405 & 0.3982 & 0.345954 \tabularnewline
30 & 0.022546 & 0.1746 & 0.430975 \tabularnewline
31 & 0.001061 & 0.0082 & 0.496734 \tabularnewline
32 & -0.168031 & -1.3016 & 0.09902 \tabularnewline
33 & -0.187117 & -1.4494 & 0.076216 \tabularnewline
34 & -0.140416 & -1.0877 & 0.140548 \tabularnewline
35 & -0.054875 & -0.4251 & 0.336156 \tabularnewline
36 & 0.171617 & 1.3293 & 0.094385 \tabularnewline
\hline
\end{tabular}
%Source: https://freestatistics.org/blog/index.php?pk=70561&T=1

[TABLE]
[ROW][C]Autocorrelation Function[/C][/ROW]
[ROW][C]Time lag k[/C][C]ACF(k)[/C][C]T-STAT[/C][C]P-value[/C][/ROW]
[ROW][C]1[/C][C]0.076818[/C][C]0.595[/C][C]0.277031[/C][/ROW]
[ROW][C]2[/C][C]-0.207379[/C][C]-1.6064[/C][C]0.056724[/C][/ROW]
[ROW][C]3[/C][C]0.058645[/C][C]0.4543[/C][C]0.32564[/C][/ROW]
[ROW][C]4[/C][C]-0.008756[/C][C]-0.0678[/C][C]0.473076[/C][/ROW]
[ROW][C]5[/C][C]0.24181[/C][C]1.873[/C][C]0.032968[/C][/ROW]
[ROW][C]6[/C][C]0.32302[/C][C]2.5021[/C][C]0.007545[/C][/ROW]
[ROW][C]7[/C][C]0.188087[/C][C]1.4569[/C][C]0.075176[/C][/ROW]
[ROW][C]8[/C][C]-0.050881[/C][C]-0.3941[/C][C]0.347445[/C][/ROW]
[ROW][C]9[/C][C]-0.045053[/C][C]-0.349[/C][C]0.364162[/C][/ROW]
[ROW][C]10[/C][C]-0.208203[/C][C]-1.6127[/C][C]0.056025[/C][/ROW]
[ROW][C]11[/C][C]0.082281[/C][C]0.6373[/C][C]0.263163[/C][/ROW]
[ROW][C]12[/C][C]0.66467[/C][C]5.1485[/C][C]2e-06[/C][/ROW]
[ROW][C]13[/C][C]-0.013131[/C][C]-0.1017[/C][C]0.459663[/C][/ROW]
[ROW][C]14[/C][C]-0.226541[/C][C]-1.7548[/C][C]0.042201[/C][/ROW]
[ROW][C]15[/C][C]-0.02089[/C][C]-0.1618[/C][C]0.435997[/C][/ROW]
[ROW][C]16[/C][C]-0.084286[/C][C]-0.6529[/C][C]0.258164[/C][/ROW]
[ROW][C]17[/C][C]0.14612[/C][C]1.1318[/C][C]0.131103[/C][/ROW]
[ROW][C]18[/C][C]0.172254[/C][C]1.3343[/C][C]0.093578[/C][/ROW]
[ROW][C]19[/C][C]0.062001[/C][C]0.4803[/C][C]0.316395[/C][/ROW]
[ROW][C]20[/C][C]-0.13448[/C][C]-1.0417[/C][C]0.150871[/C][/ROW]
[ROW][C]21[/C][C]-0.136071[/C][C]-1.054[/C][C]0.148054[/C][/ROW]
[ROW][C]22[/C][C]-0.241317[/C][C]-1.8692[/C][C]0.033237[/C][/ROW]
[ROW][C]23[/C][C]0.019959[/C][C]0.1546[/C][C]0.438827[/C][/ROW]
[ROW][C]24[/C][C]0.356357[/C][C]2.7603[/C][C]0.003824[/C][/ROW]
[ROW][C]25[/C][C]-0.084569[/C][C]-0.6551[/C][C]0.257463[/C][/ROW]
[ROW][C]26[/C][C]-0.2458[/C][C]-1.904[/C][C]0.030857[/C][/ROW]
[ROW][C]27[/C][C]-0.153622[/C][C]-1.19[/C][C]0.119376[/C][/ROW]
[ROW][C]28[/C][C]-0.07915[/C][C]-0.6131[/C][C]0.271065[/C][/ROW]
[ROW][C]29[/C][C]0.051405[/C][C]0.3982[/C][C]0.345954[/C][/ROW]
[ROW][C]30[/C][C]0.022546[/C][C]0.1746[/C][C]0.430975[/C][/ROW]
[ROW][C]31[/C][C]0.001061[/C][C]0.0082[/C][C]0.496734[/C][/ROW]
[ROW][C]32[/C][C]-0.168031[/C][C]-1.3016[/C][C]0.09902[/C][/ROW]
[ROW][C]33[/C][C]-0.187117[/C][C]-1.4494[/C][C]0.076216[/C][/ROW]
[ROW][C]34[/C][C]-0.140416[/C][C]-1.0877[/C][C]0.140548[/C][/ROW]
[ROW][C]35[/C][C]-0.054875[/C][C]-0.4251[/C][C]0.336156[/C][/ROW]
[ROW][C]36[/C][C]0.171617[/C][C]1.3293[/C][C]0.094385[/C][/ROW]
[/TABLE]
Source: https://freestatistics.org/blog/index.php?pk=70561&T=1

Globally Unique Identifier (entire table): ba.freestatistics.org/blog/index.php?pk=70561&T=1

As an alternative you can also use a QR Code:  

The GUIDs for individual cells are displayed in the table below:

Autocorrelation Function
Time lag kACF(k)T-STATP-value
10.0768180.5950.277031
2-0.207379-1.60640.056724
30.0586450.45430.32564
4-0.008756-0.06780.473076
50.241811.8730.032968
60.323022.50210.007545
70.1880871.45690.075176
8-0.050881-0.39410.347445
9-0.045053-0.3490.364162
10-0.208203-1.61270.056025
110.0822810.63730.263163
120.664675.14852e-06
13-0.013131-0.10170.459663
14-0.226541-1.75480.042201
15-0.02089-0.16180.435997
16-0.084286-0.65290.258164
170.146121.13180.131103
180.1722541.33430.093578
190.0620010.48030.316395
20-0.13448-1.04170.150871
21-0.136071-1.0540.148054
22-0.241317-1.86920.033237
230.0199590.15460.438827
240.3563572.76030.003824
25-0.084569-0.65510.257463
26-0.2458-1.9040.030857
27-0.153622-1.190.119376
28-0.07915-0.61310.271065
290.0514050.39820.345954
300.0225460.17460.430975
310.0010610.00820.496734
32-0.168031-1.30160.09902
33-0.187117-1.44940.076216
34-0.140416-1.08770.140548
35-0.054875-0.42510.336156
360.1716171.32930.094385


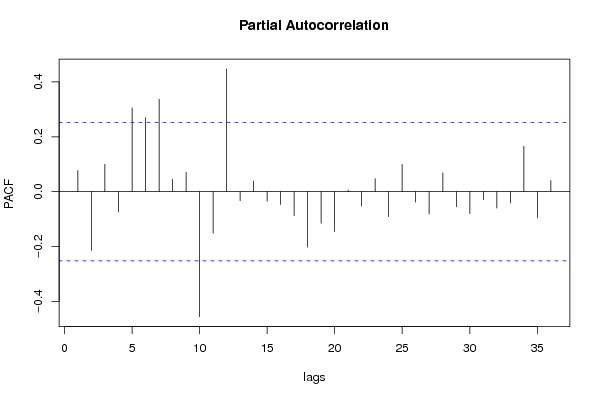
Partial Autocorrelation Function
Time lag kPACF(k)T-STATP-value
10.0768180.5950.277031
2-0.214546-1.66190.050878
30.0996210.77170.221673
4-0.074078-0.57380.284123
50.3053082.36490.010643
60.2698072.08990.020436
70.3371262.61140.005688
80.0453630.35140.363266
90.0704090.54540.293755
10-0.456076-3.53270.000399
11-0.15128-1.17180.122952
120.4475023.46630.000491
13-0.033608-0.26030.397752
140.0383480.2970.383731
15-0.034689-0.26870.394542
16-0.046676-0.36160.359478
17-0.087121-0.67480.251187
18-0.202428-1.5680.06107
19-0.115624-0.89560.187017
20-0.145525-1.12720.132065
210.0056840.0440.482515
22-0.05272-0.40840.342228
230.0478710.37080.356042
24-0.091026-0.70510.241743
250.0991410.76790.222767
26-0.038145-0.29550.384326
27-0.081534-0.63160.265036
280.0682690.52880.299444
29-0.055295-0.42830.334978
30-0.079857-0.61860.269269
31-0.029347-0.22730.410474
32-0.060043-0.46510.321775
33-0.041435-0.3210.37468
340.1657231.28370.102093
35-0.095644-0.74090.230835
360.0403910.31290.377734

\begin{tabular}{lllllllll}
\hline
Partial Autocorrelation Function \tabularnewline
Time lag k & PACF(k) & T-STAT & P-value \tabularnewline
1 & 0.076818 & 0.595 & 0.277031 \tabularnewline
2 & -0.214546 & -1.6619 & 0.050878 \tabularnewline
3 & 0.099621 & 0.7717 & 0.221673 \tabularnewline
4 & -0.074078 & -0.5738 & 0.284123 \tabularnewline
5 & 0.305308 & 2.3649 & 0.010643 \tabularnewline
6 & 0.269807 & 2.0899 & 0.020436 \tabularnewline
7 & 0.337126 & 2.6114 & 0.005688 \tabularnewline
8 & 0.045363 & 0.3514 & 0.363266 \tabularnewline
9 & 0.070409 & 0.5454 & 0.293755 \tabularnewline
10 & -0.456076 & -3.5327 & 0.000399 \tabularnewline
11 & -0.15128 & -1.1718 & 0.122952 \tabularnewline
12 & 0.447502 & 3.4663 & 0.000491 \tabularnewline
13 & -0.033608 & -0.2603 & 0.397752 \tabularnewline
14 & 0.038348 & 0.297 & 0.383731 \tabularnewline
15 & -0.034689 & -0.2687 & 0.394542 \tabularnewline
16 & -0.046676 & -0.3616 & 0.359478 \tabularnewline
17 & -0.087121 & -0.6748 & 0.251187 \tabularnewline
18 & -0.202428 & -1.568 & 0.06107 \tabularnewline
19 & -0.115624 & -0.8956 & 0.187017 \tabularnewline
20 & -0.145525 & -1.1272 & 0.132065 \tabularnewline
21 & 0.005684 & 0.044 & 0.482515 \tabularnewline
22 & -0.05272 & -0.4084 & 0.342228 \tabularnewline
23 & 0.047871 & 0.3708 & 0.356042 \tabularnewline
24 & -0.091026 & -0.7051 & 0.241743 \tabularnewline
25 & 0.099141 & 0.7679 & 0.222767 \tabularnewline
26 & -0.038145 & -0.2955 & 0.384326 \tabularnewline
27 & -0.081534 & -0.6316 & 0.265036 \tabularnewline
28 & 0.068269 & 0.5288 & 0.299444 \tabularnewline
29 & -0.055295 & -0.4283 & 0.334978 \tabularnewline
30 & -0.079857 & -0.6186 & 0.269269 \tabularnewline
31 & -0.029347 & -0.2273 & 0.410474 \tabularnewline
32 & -0.060043 & -0.4651 & 0.321775 \tabularnewline
33 & -0.041435 & -0.321 & 0.37468 \tabularnewline
34 & 0.165723 & 1.2837 & 0.102093 \tabularnewline
35 & -0.095644 & -0.7409 & 0.230835 \tabularnewline
36 & 0.040391 & 0.3129 & 0.377734 \tabularnewline
\hline
\end{tabular}
%Source: https://freestatistics.org/blog/index.php?pk=70561&T=2

[TABLE]
[ROW][C]Partial Autocorrelation Function[/C][/ROW]
[ROW][C]Time lag k[/C][C]PACF(k)[/C][C]T-STAT[/C][C]P-value[/C][/ROW]
[ROW][C]1[/C][C]0.076818[/C][C]0.595[/C][C]0.277031[/C][/ROW]
[ROW][C]2[/C][C]-0.214546[/C][C]-1.6619[/C][C]0.050878[/C][/ROW]
[ROW][C]3[/C][C]0.099621[/C][C]0.7717[/C][C]0.221673[/C][/ROW]
[ROW][C]4[/C][C]-0.074078[/C][C]-0.5738[/C][C]0.284123[/C][/ROW]
[ROW][C]5[/C][C]0.305308[/C][C]2.3649[/C][C]0.010643[/C][/ROW]
[ROW][C]6[/C][C]0.269807[/C][C]2.0899[/C][C]0.020436[/C][/ROW]
[ROW][C]7[/C][C]0.337126[/C][C]2.6114[/C][C]0.005688[/C][/ROW]
[ROW][C]8[/C][C]0.045363[/C][C]0.3514[/C][C]0.363266[/C][/ROW]
[ROW][C]9[/C][C]0.070409[/C][C]0.5454[/C][C]0.293755[/C][/ROW]
[ROW][C]10[/C][C]-0.456076[/C][C]-3.5327[/C][C]0.000399[/C][/ROW]
[ROW][C]11[/C][C]-0.15128[/C][C]-1.1718[/C][C]0.122952[/C][/ROW]
[ROW][C]12[/C][C]0.447502[/C][C]3.4663[/C][C]0.000491[/C][/ROW]
[ROW][C]13[/C][C]-0.033608[/C][C]-0.2603[/C][C]0.397752[/C][/ROW]
[ROW][C]14[/C][C]0.038348[/C][C]0.297[/C][C]0.383731[/C][/ROW]
[ROW][C]15[/C][C]-0.034689[/C][C]-0.2687[/C][C]0.394542[/C][/ROW]
[ROW][C]16[/C][C]-0.046676[/C][C]-0.3616[/C][C]0.359478[/C][/ROW]
[ROW][C]17[/C][C]-0.087121[/C][C]-0.6748[/C][C]0.251187[/C][/ROW]
[ROW][C]18[/C][C]-0.202428[/C][C]-1.568[/C][C]0.06107[/C][/ROW]
[ROW][C]19[/C][C]-0.115624[/C][C]-0.8956[/C][C]0.187017[/C][/ROW]
[ROW][C]20[/C][C]-0.145525[/C][C]-1.1272[/C][C]0.132065[/C][/ROW]
[ROW][C]21[/C][C]0.005684[/C][C]0.044[/C][C]0.482515[/C][/ROW]
[ROW][C]22[/C][C]-0.05272[/C][C]-0.4084[/C][C]0.342228[/C][/ROW]
[ROW][C]23[/C][C]0.047871[/C][C]0.3708[/C][C]0.356042[/C][/ROW]
[ROW][C]24[/C][C]-0.091026[/C][C]-0.7051[/C][C]0.241743[/C][/ROW]
[ROW][C]25[/C][C]0.099141[/C][C]0.7679[/C][C]0.222767[/C][/ROW]
[ROW][C]26[/C][C]-0.038145[/C][C]-0.2955[/C][C]0.384326[/C][/ROW]
[ROW][C]27[/C][C]-0.081534[/C][C]-0.6316[/C][C]0.265036[/C][/ROW]
[ROW][C]28[/C][C]0.068269[/C][C]0.5288[/C][C]0.299444[/C][/ROW]
[ROW][C]29[/C][C]-0.055295[/C][C]-0.4283[/C][C]0.334978[/C][/ROW]
[ROW][C]30[/C][C]-0.079857[/C][C]-0.6186[/C][C]0.269269[/C][/ROW]
[ROW][C]31[/C][C]-0.029347[/C][C]-0.2273[/C][C]0.410474[/C][/ROW]
[ROW][C]32[/C][C]-0.060043[/C][C]-0.4651[/C][C]0.321775[/C][/ROW]
[ROW][C]33[/C][C]-0.041435[/C][C]-0.321[/C][C]0.37468[/C][/ROW]
[ROW][C]34[/C][C]0.165723[/C][C]1.2837[/C][C]0.102093[/C][/ROW]
[ROW][C]35[/C][C]-0.095644[/C][C]-0.7409[/C][C]0.230835[/C][/ROW]
[ROW][C]36[/C][C]0.040391[/C][C]0.3129[/C][C]0.377734[/C][/ROW]
[/TABLE]
Source: https://freestatistics.org/blog/index.php?pk=70561&T=2

Globally Unique Identifier (entire table): ba.freestatistics.org/blog/index.php?pk=70561&T=2

As an alternative you can also use a QR Code:  

The GUIDs for individual cells are displayed in the table below:

Partial Autocorrelation Function
Time lag kPACF(k)T-STATP-value
10.0768180.5950.277031
2-0.214546-1.66190.050878
30.0996210.77170.221673
4-0.074078-0.57380.284123
50.3053082.36490.010643
60.2698072.08990.020436
70.3371262.61140.005688
80.0453630.35140.363266
90.0704090.54540.293755
10-0.456076-3.53270.000399
11-0.15128-1.17180.122952
120.4475023.46630.000491
13-0.033608-0.26030.397752
140.0383480.2970.383731
15-0.034689-0.26870.394542
16-0.046676-0.36160.359478
17-0.087121-0.67480.251187
18-0.202428-1.5680.06107
19-0.115624-0.89560.187017
20-0.145525-1.12720.132065
210.0056840.0440.482515
22-0.05272-0.40840.342228
230.0478710.37080.356042
24-0.091026-0.70510.241743
250.0991410.76790.222767
26-0.038145-0.29550.384326
27-0.081534-0.63160.265036
280.0682690.52880.299444
29-0.055295-0.42830.334978
30-0.079857-0.61860.269269
31-0.029347-0.22730.410474
32-0.060043-0.46510.321775
33-0.041435-0.3210.37468
340.1657231.28370.102093
35-0.095644-0.74090.230835
360.0403910.31290.377734


Parameters (Session):
par1 = 36 ; par2 = 1 ; par3 = 0 ; par4 = 0 ; par5 = 12 ; par6 = MA ; par7 = 0.95 ;
Parameters (R input):
par1 = 36 ; par2 = 1 ; par3 = 0 ; par4 = 0 ; par5 = 12 ; par6 = MA ; par7 = 0.95 ;
R code (references can be found in the software module):
if (par1 == 'Default') {
par1 = 10*log10(length(x))
} else {
par1 <- as.numeric(par1)
}
par2 <- as.numeric(par2)
par3 <- as.numeric(par3)
par4 <- as.numeric(par4)
par5 <- as.numeric(par5)
if (par6 == 'White Noise') par6 <- 'white' else par6 <- 'ma'
par7 <- as.numeric(par7)
if (par2 == 0) {
x <- log(x)
} else {
x <- (x ^ par2 - 1) / par2
}
if (par3 > 0) x <- diff(x,lag=1,difference=par3)
if (par4 > 0) x <- diff(x,lag=par5,difference=par4)
bitmap(file='pic1.png')
racf <- acf(x, par1, main='Autocorrelation', xlab='time lag', ylab='ACF', ci.type=par6, ci=par7, sub=paste('(lambda=',par2,', d=',par3,', D=',par4,', CI=', par7, ', CI type=',par6,')',sep=''))
dev.off()
bitmap(file='pic2.png')
rpacf <- pacf(x,par1,main='Partial Autocorrelation',xlab='lags',ylab='PACF')
dev.off()
(myacf <- c(racf$acf))
(mypacf <- c(rpacf$acf))
lengthx <- length(x)
sqrtn <- sqrt(lengthx)
load(file='createtable')
a<-table.start()
a<-table.row.start(a)
a<-table.element(a,'Autocorrelation Function',4,TRUE)
a<-table.row.end(a)
a<-table.row.start(a)
a<-table.element(a,'Time lag k',header=TRUE)
a<-table.element(a,hyperlink('basics.htm','ACF(k)','click here for more information about the Autocorrelation Function'),header=TRUE)
a<-table.element(a,'T-STAT',header=TRUE)
a<-table.element(a,'P-value',header=TRUE)
a<-table.row.end(a)
for (i in 2:(par1+1)) {
a<-table.row.start(a)
a<-table.element(a,i-1,header=TRUE)
a<-table.element(a,round(myacf[i],6))
mytstat <- myacf[i]*sqrtn
a<-table.element(a,round(mytstat,4))
a<-table.element(a,round(1-pt(abs(mytstat),lengthx),6))
a<-table.row.end(a)
}
a<-table.end(a)
table.save(a,file='mytable.tab')
a<-table.start()
a<-table.row.start(a)
a<-table.element(a,'Partial Autocorrelation Function',4,TRUE)
a<-table.row.end(a)
a<-table.row.start(a)
a<-table.element(a,'Time lag k',header=TRUE)
a<-table.element(a,hyperlink('basics.htm','PACF(k)','click here for more information about the Partial Autocorrelation Function'),header=TRUE)
a<-table.element(a,'T-STAT',header=TRUE)
a<-table.element(a,'P-value',header=TRUE)
a<-table.row.end(a)
for (i in 1:par1) {
a<-table.row.start(a)
a<-table.element(a,i,header=TRUE)
a<-table.element(a,round(mypacf[i],6))
mytstat <- mypacf[i]*sqrtn
a<-table.element(a,round(mytstat,4))
a<-table.element(a,round(1-pt(abs(mytstat),lengthx),6))
a<-table.row.end(a)
}
a<-table.end(a)
table.save(a,file='mytable1.tab')