Free Statistics

of Irreproducible Research!

Author's title

Author*The author of this computation has been verified*
R Software Modulerwasp_multipleregression.wasp
Title produced by softwareMultiple Regression
Date of computationWed, 26 Jan 2011 14:15:00 +0000
Cite this page as followsStatistical Computations at FreeStatistics.org, Office for Research Development and Education, URL https://freestatistics.org/blog/index.php?v=date/2011/Jan/26/t1296051400oexe56v5qx3smxq.htm/, Retrieved Thu, 31 Oct 2024 23:37:14 +0000
Statistical Computations at FreeStatistics.org, Office for Research Development and Education, URL https://freestatistics.org/blog/index.php?pk=117802, Retrieved Thu, 31 Oct 2024 23:37:14 +0000
QR Codes:

Original text written by user:
IsPrivate?No (this computation is public)
User-defined keywords
Estimated Impact255
Family? (F = Feedback message, R = changed R code, M = changed R Module, P = changed Parameters, D = changed Data)
-     [Multiple Regression] [LKI vertraagd] [2010-12-24 14:12:01] [6bc4f9343b7ea3ef5a59412d1f72bb2b]
-         [Multiple Regression] [Finaal model - ve...] [2011-01-26 14:15:00] [3d48a36d4fd92c6d0575261eb9c7ce45] [Current]
Feedback Forum

Post a new message
Dataseries X:
90,09	85,61	87,703	81,71
100,639	85,52	90,09	87,703
83,042	86,51	100,639	90,09
89,956	86,66	83,042	100,639
89,561	87,27	89,956	83,042
105,38	87,62	89,561	89,956
86,554	88,17	105,38	89,561
93,131	87,99	86,554	105,38
92,812	88,83	93,131	86,554
102,195	88,75	92,812	93,131
88,925	88,81	102,195	92,812
94,184	89,43	88,925	102,195
94,196	89,5	94,184	88,925
108,932	89,34	94,196	94,184
91,134	89,75	108,932	94,196
97,149	90,26	91,134	108,932
96,415	90,32	97,149	91,134
112,432	90,76	96,415	97,149
92,47	91,53	112,432	96,415
98,61410515	92,35	92,47	112,432
97,80117197	93,04	98,61410515	92,47
111,8560178	93,35	97,80117197	98,61410515
95,63981455	93,54	111,8560178	97,80117197
104,1120262	95,07	95,63981455	111,8560178
104,0148224	95,39	104,1120262	95,63981455
118,1743476	95,43	104,0148224	104,1120262
102,033431	96,09	118,1743476	104,0148224
109,3138852	96,35	102,033431	118,1743476
108,1523649	96,6	109,3138852	102,033431
121,30381	96,62	108,1523649	109,3138852
103,8725146	97,6	121,30381	108,1523649
112,7185207	97,67	103,8725146	121,30381
109,0381253	98,23	112,7185207	103,8725146
122,4434864	98,29	109,0381253	112,7185207
106,6325686	98,89	122,4434864	109,0381253
113,8153852	99,88	106,6325686	122,4434864
111,1071252	100,42	113,8153852	106,6325686
130,039536	100,81	111,1071252	113,8153852
109,6121057	101,5	130,039536	111,1071252
116,8592117	102,59	109,6121057	130,039536
113,8982545	103,58	116,8592117	109,6121057
128,9375926	103,47	113,8982545	116,8592117
111,8120023	103,77	128,9375926	113,8982545
119,9689463	104,65	111,8120023	128,9375926
117,018539	105,12	119,9689463	111,8120023
132,4743387	104,97	117,018539	119,9689463
116,3369106	105,58	132,4743387	117,018539
124,6405636	106,17	116,3369106	132,4743387
121,025249	106,52	124,6405636	116,3369106
137,2054829	107,87	121,025249	124,6405636
120,0187687	109,63	137,2054829	121,025249
127,0443429	111,54	120,0187687	137,2054829
124,349043	112,47	127,0443429	120,0187687
143,6114438	111,63	124,349043	127,0443429


Summary of computational transaction
Raw Inputview raw input (R code)
Raw Outputview raw output of R engine
Computing time4 seconds
R Server'Gwilym Jenkins' @ www.wessa.org

\begin{tabular}{lllllllll}
\hline
Summary of computational transaction \tabularnewline
Raw Input & view raw input (R code)  \tabularnewline
Raw Output & view raw output of R engine  \tabularnewline
Computing time & 4 seconds \tabularnewline
R Server & 'Gwilym Jenkins' @ www.wessa.org \tabularnewline
\hline
\end{tabular}
%Source: https://freestatistics.org/blog/index.php?pk=117802&T=0

[TABLE]
[ROW][C]Summary of computational transaction[/C][/ROW]
[ROW][C]Raw Input[/C][C]view raw input (R code) [/C][/ROW]
[ROW][C]Raw Output[/C][C]view raw output of R engine [/C][/ROW]
[ROW][C]Computing time[/C][C]4 seconds[/C][/ROW]
[ROW][C]R Server[/C][C]'Gwilym Jenkins' @ www.wessa.org[/C][/ROW]
[/TABLE]
Source: https://freestatistics.org/blog/index.php?pk=117802&T=0

Globally Unique Identifier (entire table): ba.freestatistics.org/blog/index.php?pk=117802&T=0

As an alternative you can also use a QR Code:  

The GUIDs for individual cells are displayed in the table below:

Summary of computational transaction
Raw Inputview raw input (R code)
Raw Outputview raw output of R engine
Computing time4 seconds
R Server'Gwilym Jenkins' @ www.wessa.org


Multiple Linear Regression - Estimated Regression Equation
LKI[t] = -17.2457869176623 + 0.508784678881672CPI[t] + 0.307209058050048LKI_1[t] + 0.380198032535317LKI_2[t] + 2.62067959823466Q1[t] + 15.0228547971945Q2[t] -6.65102587567938Q3[t] + e[t]

\begin{tabular}{lllllllll}
\hline
Multiple Linear Regression - Estimated Regression Equation \tabularnewline
LKI[t] =  -17.2457869176623 +  0.508784678881672CPI[t] +  0.307209058050048LKI_1[t] +  0.380198032535317LKI_2[t] +  2.62067959823466Q1[t] +  15.0228547971945Q2[t] -6.65102587567938Q3[t]  + e[t] \tabularnewline
\hline
\end{tabular}
%Source: https://freestatistics.org/blog/index.php?pk=117802&T=1

[TABLE]
[ROW][C]Multiple Linear Regression - Estimated Regression Equation[/C][/ROW]
[ROW][C]LKI[t] =  -17.2457869176623 +  0.508784678881672CPI[t] +  0.307209058050048LKI_1[t] +  0.380198032535317LKI_2[t] +  2.62067959823466Q1[t] +  15.0228547971945Q2[t] -6.65102587567938Q3[t]  + e[t][/C][/ROW]
[/TABLE]
Source: https://freestatistics.org/blog/index.php?pk=117802&T=1

Globally Unique Identifier (entire table): ba.freestatistics.org/blog/index.php?pk=117802&T=1

As an alternative you can also use a QR Code:  

The GUIDs for individual cells are displayed in the table below:

Multiple Linear Regression - Estimated Regression Equation
LKI[t] = -17.2457869176623 + 0.508784678881672CPI[t] + 0.307209058050048LKI_1[t] + 0.380198032535317LKI_2[t] + 2.62067959823466Q1[t] + 15.0228547971945Q2[t] -6.65102587567938Q3[t] + e[t]


Multiple Linear Regression - Ordinary Least Squares
VariableParameterS.D.T-STATH0: parameter = 02-tail p-value1-tail p-value
(Intercept)-17.24578691766236.345783-2.71770.0091760.004588
CPI0.5087846788816720.2059882.470.0171990.008599
LKI_10.3072090580500480.1398952.1960.0330620.016531
LKI_20.3801980325353170.1428022.66240.0105880.005294
Q12.620679598234663.2148010.81520.4190740.209537
Q215.02285479719452.1232967.075300
Q3-6.651025875679383.999931-1.66280.1030110.051506

\begin{tabular}{lllllllll}
\hline
Multiple Linear Regression - Ordinary Least Squares \tabularnewline
Variable & Parameter & S.D. & T-STATH0: parameter = 0 & 2-tail p-value & 1-tail p-value \tabularnewline
(Intercept) & -17.2457869176623 & 6.345783 & -2.7177 & 0.009176 & 0.004588 \tabularnewline
CPI & 0.508784678881672 & 0.205988 & 2.47 & 0.017199 & 0.008599 \tabularnewline
LKI_1 & 0.307209058050048 & 0.139895 & 2.196 & 0.033062 & 0.016531 \tabularnewline
LKI_2 & 0.380198032535317 & 0.142802 & 2.6624 & 0.010588 & 0.005294 \tabularnewline
Q1 & 2.62067959823466 & 3.214801 & 0.8152 & 0.419074 & 0.209537 \tabularnewline
Q2 & 15.0228547971945 & 2.123296 & 7.0753 & 0 & 0 \tabularnewline
Q3 & -6.65102587567938 & 3.999931 & -1.6628 & 0.103011 & 0.051506 \tabularnewline
\hline
\end{tabular}
%Source: https://freestatistics.org/blog/index.php?pk=117802&T=2

[TABLE]
[ROW][C]Multiple Linear Regression - Ordinary Least Squares[/C][/ROW]
[ROW][C]Variable[/C][C]Parameter[/C][C]S.D.[/C][C]T-STATH0: parameter = 0[/C][C]2-tail p-value[/C][C]1-tail p-value[/C][/ROW]
[ROW][C](Intercept)[/C][C]-17.2457869176623[/C][C]6.345783[/C][C]-2.7177[/C][C]0.009176[/C][C]0.004588[/C][/ROW]
[ROW][C]CPI[/C][C]0.508784678881672[/C][C]0.205988[/C][C]2.47[/C][C]0.017199[/C][C]0.008599[/C][/ROW]
[ROW][C]LKI_1[/C][C]0.307209058050048[/C][C]0.139895[/C][C]2.196[/C][C]0.033062[/C][C]0.016531[/C][/ROW]
[ROW][C]LKI_2[/C][C]0.380198032535317[/C][C]0.142802[/C][C]2.6624[/C][C]0.010588[/C][C]0.005294[/C][/ROW]
[ROW][C]Q1[/C][C]2.62067959823466[/C][C]3.214801[/C][C]0.8152[/C][C]0.419074[/C][C]0.209537[/C][/ROW]
[ROW][C]Q2[/C][C]15.0228547971945[/C][C]2.123296[/C][C]7.0753[/C][C]0[/C][C]0[/C][/ROW]
[ROW][C]Q3[/C][C]-6.65102587567938[/C][C]3.999931[/C][C]-1.6628[/C][C]0.103011[/C][C]0.051506[/C][/ROW]
[/TABLE]
Source: https://freestatistics.org/blog/index.php?pk=117802&T=2

Globally Unique Identifier (entire table): ba.freestatistics.org/blog/index.php?pk=117802&T=2

As an alternative you can also use a QR Code:  

The GUIDs for individual cells are displayed in the table below:

Multiple Linear Regression - Ordinary Least Squares
VariableParameterS.D.T-STATH0: parameter = 02-tail p-value1-tail p-value
(Intercept)-17.24578691766236.345783-2.71770.0091760.004588
CPI0.5087846788816720.2059882.470.0171990.008599
LKI_10.3072090580500480.1398952.1960.0330620.016531
LKI_20.3801980325353170.1428022.66240.0105880.005294
Q12.620679598234663.2148010.81520.4190740.209537
Q215.02285479719452.1232967.075300
Q3-6.651025875679383.999931-1.66280.1030110.051506


Multiple Linear Regression - Regression Statistics
Multiple R0.994087973665726
R-squared0.98821089938683
Adjusted R-squared0.98670590781919
F-TEST (value)656.622216785721
F-TEST (DF numerator)6
F-TEST (DF denominator)47
p-value0
Multiple Linear Regression - Residual Statistics
Residual Standard Deviation1.6184093348068
Sum Squared Residuals123.10469242452

\begin{tabular}{lllllllll}
\hline
Multiple Linear Regression - Regression Statistics \tabularnewline
Multiple R & 0.994087973665726 \tabularnewline
R-squared & 0.98821089938683 \tabularnewline
Adjusted R-squared & 0.98670590781919 \tabularnewline
F-TEST (value) & 656.622216785721 \tabularnewline
F-TEST (DF numerator) & 6 \tabularnewline
F-TEST (DF denominator) & 47 \tabularnewline
p-value & 0 \tabularnewline
Multiple Linear Regression - Residual Statistics \tabularnewline
Residual Standard Deviation & 1.6184093348068 \tabularnewline
Sum Squared Residuals & 123.10469242452 \tabularnewline
\hline
\end{tabular}
%Source: https://freestatistics.org/blog/index.php?pk=117802&T=3

[TABLE]
[ROW][C]Multiple Linear Regression - Regression Statistics[/C][/ROW]
[ROW][C]Multiple R[/C][C]0.994087973665726[/C][/ROW]
[ROW][C]R-squared[/C][C]0.98821089938683[/C][/ROW]
[ROW][C]Adjusted R-squared[/C][C]0.98670590781919[/C][/ROW]
[ROW][C]F-TEST (value)[/C][C]656.622216785721[/C][/ROW]
[ROW][C]F-TEST (DF numerator)[/C][C]6[/C][/ROW]
[ROW][C]F-TEST (DF denominator)[/C][C]47[/C][/ROW]
[ROW][C]p-value[/C][C]0[/C][/ROW]
[ROW][C]Multiple Linear Regression - Residual Statistics[/C][/ROW]
[ROW][C]Residual Standard Deviation[/C][C]1.6184093348068[/C][/ROW]
[ROW][C]Sum Squared Residuals[/C][C]123.10469242452[/C][/ROW]
[/TABLE]
Source: https://freestatistics.org/blog/index.php?pk=117802&T=3

Globally Unique Identifier (entire table): ba.freestatistics.org/blog/index.php?pk=117802&T=3

As an alternative you can also use a QR Code:  

The GUIDs for individual cells are displayed in the table below:

Multiple Linear Regression - Regression Statistics
Multiple R0.994087973665726
R-squared0.98821089938683
Adjusted R-squared0.98670590781919
F-TEST (value)656.622216785721
F-TEST (DF numerator)6
F-TEST (DF denominator)47
p-value0
Multiple Linear Regression - Residual Statistics
Residual Standard Deviation1.6184093348068
Sum Squared Residuals123.10469242452


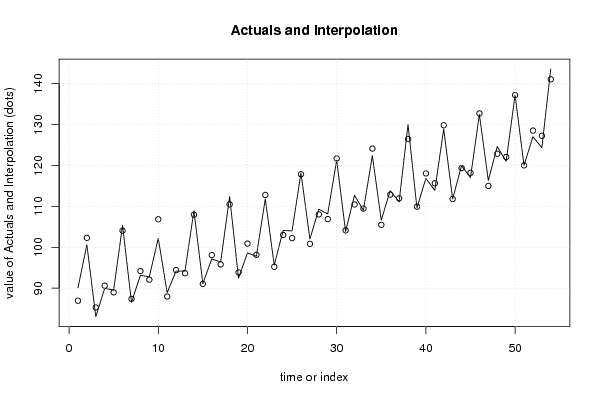
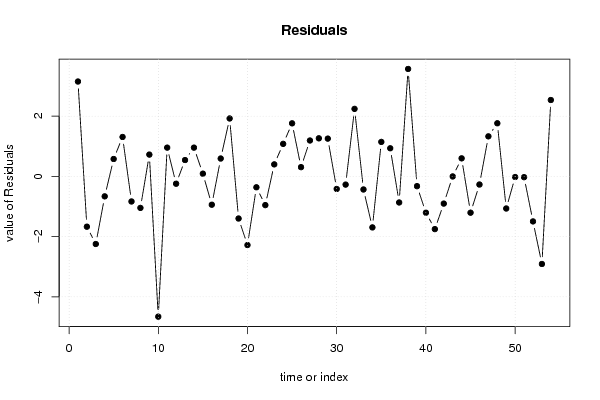
Multiple Linear Regression - Actuals, Interpolation, and Residuals
Time or IndexActualsInterpolationForecastResidualsPrediction Error
190.0986.94108629625693.1489137037431
2100.639102.309305704667-1.67030570466656
383.04285.2874029209173-2.24540292091734
489.95690.6194977491373-0.663497749137338
589.56188.98423465032390.576765349676142
6105.38104.0718261059121.30817389408831
786.55487.387338872865-0.833338872865004
893.13194.1776184561717-1.04661845617166
992.81292.08858299895220.723417001047783
10102.195106.852618194068-4.65761819406831
1188.92587.97052402123220.954475978767807
1294.18494.427730336773-0.243730336772957
1394.19693.65440940707090.541590592929128
14108.932107.9783270192090.95367298079056
1591.13491.0446431204930.0893568795069851
1697.14998.0900405746677-0.941040574667734
1796.41595.82234515474270.59265484525726
18112.432110.5097853295021.9222146704983
1992.4793.8691709862734-1.39917098627343
2098.61410515100.894524968959-2.2804198189589
2197.8011719798.1642776258439-0.363105655843864
22111.8560178112.810412328492-0.954394528491658
2395.6398145595.24190109745960.397913452540391
24104.1120262103.0332277384011.07879846159948
25104.0148224102.2540900236321.76073237636836
26118.1743476117.8678729224630.306474677537374
27102.033431100.8427678432641.19066315673635
28109.3138852108.0508655733761.26301962662388
29108.1523649106.8986180836531.25374681634693
30121.30381121.722153781725-0.418343781724991
31103.8725146104.145517422513-0.273002822513262
32112.7185207110.4772599373042.24126076269553
33109.0381253109.473087941577-0.434962641576914
34122.4434864124.138373532199-1.69488713219932
35106.6325686105.4887329329741.14383566702581
36113.8153852112.8828903921470.932494807852829
37111.1071252111.973660198673-0.86653499867255
38130.039536126.4731521582243.56638384177639
39109.6121057109.936865878669-0.324760178668566
40116.8592117118.065040770793-1.20582907079335
41113.8982545115.649324999157-1.7510704991574
42128.9375926129.841236453877-0.903643853876615
43111.8120023111.814461974203-0.00245967420316595
44119.9689463119.3700086589380.598937641062172
45117.018539118.224588400988-1.20604940098795
46132.4743387132.745308110919-0.270969410919278
47116.3369106115.0082087087731.32870189122736
48124.6405636122.8781180962411.76244550375922
49121.025249122.092411334788-1.06716233478832
50137.2054829137.227820990874-0.0223380908737981
51120.0187687120.045580270364-0.0268115703639352
52127.0443429128.540163697091-1.49582079709117
53124.349043127.257978154342-2.9089351543417
54143.6114438141.075863167872.53558063212959

\begin{tabular}{lllllllll}
\hline
Multiple Linear Regression - Actuals, Interpolation, and Residuals \tabularnewline
Time or Index & Actuals & InterpolationForecast & ResidualsPrediction Error \tabularnewline
1 & 90.09 & 86.9410862962569 & 3.1489137037431 \tabularnewline
2 & 100.639 & 102.309305704667 & -1.67030570466656 \tabularnewline
3 & 83.042 & 85.2874029209173 & -2.24540292091734 \tabularnewline
4 & 89.956 & 90.6194977491373 & -0.663497749137338 \tabularnewline
5 & 89.561 & 88.9842346503239 & 0.576765349676142 \tabularnewline
6 & 105.38 & 104.071826105912 & 1.30817389408831 \tabularnewline
7 & 86.554 & 87.387338872865 & -0.833338872865004 \tabularnewline
8 & 93.131 & 94.1776184561717 & -1.04661845617166 \tabularnewline
9 & 92.812 & 92.0885829989522 & 0.723417001047783 \tabularnewline
10 & 102.195 & 106.852618194068 & -4.65761819406831 \tabularnewline
11 & 88.925 & 87.9705240212322 & 0.954475978767807 \tabularnewline
12 & 94.184 & 94.427730336773 & -0.243730336772957 \tabularnewline
13 & 94.196 & 93.6544094070709 & 0.541590592929128 \tabularnewline
14 & 108.932 & 107.978327019209 & 0.95367298079056 \tabularnewline
15 & 91.134 & 91.044643120493 & 0.0893568795069851 \tabularnewline
16 & 97.149 & 98.0900405746677 & -0.941040574667734 \tabularnewline
17 & 96.415 & 95.8223451547427 & 0.59265484525726 \tabularnewline
18 & 112.432 & 110.509785329502 & 1.9222146704983 \tabularnewline
19 & 92.47 & 93.8691709862734 & -1.39917098627343 \tabularnewline
20 & 98.61410515 & 100.894524968959 & -2.2804198189589 \tabularnewline
21 & 97.80117197 & 98.1642776258439 & -0.363105655843864 \tabularnewline
22 & 111.8560178 & 112.810412328492 & -0.954394528491658 \tabularnewline
23 & 95.63981455 & 95.2419010974596 & 0.397913452540391 \tabularnewline
24 & 104.1120262 & 103.033227738401 & 1.07879846159948 \tabularnewline
25 & 104.0148224 & 102.254090023632 & 1.76073237636836 \tabularnewline
26 & 118.1743476 & 117.867872922463 & 0.306474677537374 \tabularnewline
27 & 102.033431 & 100.842767843264 & 1.19066315673635 \tabularnewline
28 & 109.3138852 & 108.050865573376 & 1.26301962662388 \tabularnewline
29 & 108.1523649 & 106.898618083653 & 1.25374681634693 \tabularnewline
30 & 121.30381 & 121.722153781725 & -0.418343781724991 \tabularnewline
31 & 103.8725146 & 104.145517422513 & -0.273002822513262 \tabularnewline
32 & 112.7185207 & 110.477259937304 & 2.24126076269553 \tabularnewline
33 & 109.0381253 & 109.473087941577 & -0.434962641576914 \tabularnewline
34 & 122.4434864 & 124.138373532199 & -1.69488713219932 \tabularnewline
35 & 106.6325686 & 105.488732932974 & 1.14383566702581 \tabularnewline
36 & 113.8153852 & 112.882890392147 & 0.932494807852829 \tabularnewline
37 & 111.1071252 & 111.973660198673 & -0.86653499867255 \tabularnewline
38 & 130.039536 & 126.473152158224 & 3.56638384177639 \tabularnewline
39 & 109.6121057 & 109.936865878669 & -0.324760178668566 \tabularnewline
40 & 116.8592117 & 118.065040770793 & -1.20582907079335 \tabularnewline
41 & 113.8982545 & 115.649324999157 & -1.7510704991574 \tabularnewline
42 & 128.9375926 & 129.841236453877 & -0.903643853876615 \tabularnewline
43 & 111.8120023 & 111.814461974203 & -0.00245967420316595 \tabularnewline
44 & 119.9689463 & 119.370008658938 & 0.598937641062172 \tabularnewline
45 & 117.018539 & 118.224588400988 & -1.20604940098795 \tabularnewline
46 & 132.4743387 & 132.745308110919 & -0.270969410919278 \tabularnewline
47 & 116.3369106 & 115.008208708773 & 1.32870189122736 \tabularnewline
48 & 124.6405636 & 122.878118096241 & 1.76244550375922 \tabularnewline
49 & 121.025249 & 122.092411334788 & -1.06716233478832 \tabularnewline
50 & 137.2054829 & 137.227820990874 & -0.0223380908737981 \tabularnewline
51 & 120.0187687 & 120.045580270364 & -0.0268115703639352 \tabularnewline
52 & 127.0443429 & 128.540163697091 & -1.49582079709117 \tabularnewline
53 & 124.349043 & 127.257978154342 & -2.9089351543417 \tabularnewline
54 & 143.6114438 & 141.07586316787 & 2.53558063212959 \tabularnewline
\hline
\end{tabular}
%Source: https://freestatistics.org/blog/index.php?pk=117802&T=4

[TABLE]
[ROW][C]Multiple Linear Regression - Actuals, Interpolation, and Residuals[/C][/ROW]
[ROW][C]Time or Index[/C][C]Actuals[/C][C]InterpolationForecast[/C][C]ResidualsPrediction Error[/C][/ROW]
[ROW][C]1[/C][C]90.09[/C][C]86.9410862962569[/C][C]3.1489137037431[/C][/ROW]
[ROW][C]2[/C][C]100.639[/C][C]102.309305704667[/C][C]-1.67030570466656[/C][/ROW]
[ROW][C]3[/C][C]83.042[/C][C]85.2874029209173[/C][C]-2.24540292091734[/C][/ROW]
[ROW][C]4[/C][C]89.956[/C][C]90.6194977491373[/C][C]-0.663497749137338[/C][/ROW]
[ROW][C]5[/C][C]89.561[/C][C]88.9842346503239[/C][C]0.576765349676142[/C][/ROW]
[ROW][C]6[/C][C]105.38[/C][C]104.071826105912[/C][C]1.30817389408831[/C][/ROW]
[ROW][C]7[/C][C]86.554[/C][C]87.387338872865[/C][C]-0.833338872865004[/C][/ROW]
[ROW][C]8[/C][C]93.131[/C][C]94.1776184561717[/C][C]-1.04661845617166[/C][/ROW]
[ROW][C]9[/C][C]92.812[/C][C]92.0885829989522[/C][C]0.723417001047783[/C][/ROW]
[ROW][C]10[/C][C]102.195[/C][C]106.852618194068[/C][C]-4.65761819406831[/C][/ROW]
[ROW][C]11[/C][C]88.925[/C][C]87.9705240212322[/C][C]0.954475978767807[/C][/ROW]
[ROW][C]12[/C][C]94.184[/C][C]94.427730336773[/C][C]-0.243730336772957[/C][/ROW]
[ROW][C]13[/C][C]94.196[/C][C]93.6544094070709[/C][C]0.541590592929128[/C][/ROW]
[ROW][C]14[/C][C]108.932[/C][C]107.978327019209[/C][C]0.95367298079056[/C][/ROW]
[ROW][C]15[/C][C]91.134[/C][C]91.044643120493[/C][C]0.0893568795069851[/C][/ROW]
[ROW][C]16[/C][C]97.149[/C][C]98.0900405746677[/C][C]-0.941040574667734[/C][/ROW]
[ROW][C]17[/C][C]96.415[/C][C]95.8223451547427[/C][C]0.59265484525726[/C][/ROW]
[ROW][C]18[/C][C]112.432[/C][C]110.509785329502[/C][C]1.9222146704983[/C][/ROW]
[ROW][C]19[/C][C]92.47[/C][C]93.8691709862734[/C][C]-1.39917098627343[/C][/ROW]
[ROW][C]20[/C][C]98.61410515[/C][C]100.894524968959[/C][C]-2.2804198189589[/C][/ROW]
[ROW][C]21[/C][C]97.80117197[/C][C]98.1642776258439[/C][C]-0.363105655843864[/C][/ROW]
[ROW][C]22[/C][C]111.8560178[/C][C]112.810412328492[/C][C]-0.954394528491658[/C][/ROW]
[ROW][C]23[/C][C]95.63981455[/C][C]95.2419010974596[/C][C]0.397913452540391[/C][/ROW]
[ROW][C]24[/C][C]104.1120262[/C][C]103.033227738401[/C][C]1.07879846159948[/C][/ROW]
[ROW][C]25[/C][C]104.0148224[/C][C]102.254090023632[/C][C]1.76073237636836[/C][/ROW]
[ROW][C]26[/C][C]118.1743476[/C][C]117.867872922463[/C][C]0.306474677537374[/C][/ROW]
[ROW][C]27[/C][C]102.033431[/C][C]100.842767843264[/C][C]1.19066315673635[/C][/ROW]
[ROW][C]28[/C][C]109.3138852[/C][C]108.050865573376[/C][C]1.26301962662388[/C][/ROW]
[ROW][C]29[/C][C]108.1523649[/C][C]106.898618083653[/C][C]1.25374681634693[/C][/ROW]
[ROW][C]30[/C][C]121.30381[/C][C]121.722153781725[/C][C]-0.418343781724991[/C][/ROW]
[ROW][C]31[/C][C]103.8725146[/C][C]104.145517422513[/C][C]-0.273002822513262[/C][/ROW]
[ROW][C]32[/C][C]112.7185207[/C][C]110.477259937304[/C][C]2.24126076269553[/C][/ROW]
[ROW][C]33[/C][C]109.0381253[/C][C]109.473087941577[/C][C]-0.434962641576914[/C][/ROW]
[ROW][C]34[/C][C]122.4434864[/C][C]124.138373532199[/C][C]-1.69488713219932[/C][/ROW]
[ROW][C]35[/C][C]106.6325686[/C][C]105.488732932974[/C][C]1.14383566702581[/C][/ROW]
[ROW][C]36[/C][C]113.8153852[/C][C]112.882890392147[/C][C]0.932494807852829[/C][/ROW]
[ROW][C]37[/C][C]111.1071252[/C][C]111.973660198673[/C][C]-0.86653499867255[/C][/ROW]
[ROW][C]38[/C][C]130.039536[/C][C]126.473152158224[/C][C]3.56638384177639[/C][/ROW]
[ROW][C]39[/C][C]109.6121057[/C][C]109.936865878669[/C][C]-0.324760178668566[/C][/ROW]
[ROW][C]40[/C][C]116.8592117[/C][C]118.065040770793[/C][C]-1.20582907079335[/C][/ROW]
[ROW][C]41[/C][C]113.8982545[/C][C]115.649324999157[/C][C]-1.7510704991574[/C][/ROW]
[ROW][C]42[/C][C]128.9375926[/C][C]129.841236453877[/C][C]-0.903643853876615[/C][/ROW]
[ROW][C]43[/C][C]111.8120023[/C][C]111.814461974203[/C][C]-0.00245967420316595[/C][/ROW]
[ROW][C]44[/C][C]119.9689463[/C][C]119.370008658938[/C][C]0.598937641062172[/C][/ROW]
[ROW][C]45[/C][C]117.018539[/C][C]118.224588400988[/C][C]-1.20604940098795[/C][/ROW]
[ROW][C]46[/C][C]132.4743387[/C][C]132.745308110919[/C][C]-0.270969410919278[/C][/ROW]
[ROW][C]47[/C][C]116.3369106[/C][C]115.008208708773[/C][C]1.32870189122736[/C][/ROW]
[ROW][C]48[/C][C]124.6405636[/C][C]122.878118096241[/C][C]1.76244550375922[/C][/ROW]
[ROW][C]49[/C][C]121.025249[/C][C]122.092411334788[/C][C]-1.06716233478832[/C][/ROW]
[ROW][C]50[/C][C]137.2054829[/C][C]137.227820990874[/C][C]-0.0223380908737981[/C][/ROW]
[ROW][C]51[/C][C]120.0187687[/C][C]120.045580270364[/C][C]-0.0268115703639352[/C][/ROW]
[ROW][C]52[/C][C]127.0443429[/C][C]128.540163697091[/C][C]-1.49582079709117[/C][/ROW]
[ROW][C]53[/C][C]124.349043[/C][C]127.257978154342[/C][C]-2.9089351543417[/C][/ROW]
[ROW][C]54[/C][C]143.6114438[/C][C]141.07586316787[/C][C]2.53558063212959[/C][/ROW]
[/TABLE]
Source: https://freestatistics.org/blog/index.php?pk=117802&T=4

Globally Unique Identifier (entire table): ba.freestatistics.org/blog/index.php?pk=117802&T=4

As an alternative you can also use a QR Code:  

The GUIDs for individual cells are displayed in the table below:

Multiple Linear Regression - Actuals, Interpolation, and Residuals
Time or IndexActualsInterpolationForecastResidualsPrediction Error
190.0986.94108629625693.1489137037431
2100.639102.309305704667-1.67030570466656
383.04285.2874029209173-2.24540292091734
489.95690.6194977491373-0.663497749137338
589.56188.98423465032390.576765349676142
6105.38104.0718261059121.30817389408831
786.55487.387338872865-0.833338872865004
893.13194.1776184561717-1.04661845617166
992.81292.08858299895220.723417001047783
10102.195106.852618194068-4.65761819406831
1188.92587.97052402123220.954475978767807
1294.18494.427730336773-0.243730336772957
1394.19693.65440940707090.541590592929128
14108.932107.9783270192090.95367298079056
1591.13491.0446431204930.0893568795069851
1697.14998.0900405746677-0.941040574667734
1796.41595.82234515474270.59265484525726
18112.432110.5097853295021.9222146704983
1992.4793.8691709862734-1.39917098627343
2098.61410515100.894524968959-2.2804198189589
2197.8011719798.1642776258439-0.363105655843864
22111.8560178112.810412328492-0.954394528491658
2395.6398145595.24190109745960.397913452540391
24104.1120262103.0332277384011.07879846159948
25104.0148224102.2540900236321.76073237636836
26118.1743476117.8678729224630.306474677537374
27102.033431100.8427678432641.19066315673635
28109.3138852108.0508655733761.26301962662388
29108.1523649106.8986180836531.25374681634693
30121.30381121.722153781725-0.418343781724991
31103.8725146104.145517422513-0.273002822513262
32112.7185207110.4772599373042.24126076269553
33109.0381253109.473087941577-0.434962641576914
34122.4434864124.138373532199-1.69488713219932
35106.6325686105.4887329329741.14383566702581
36113.8153852112.8828903921470.932494807852829
37111.1071252111.973660198673-0.86653499867255
38130.039536126.4731521582243.56638384177639
39109.6121057109.936865878669-0.324760178668566
40116.8592117118.065040770793-1.20582907079335
41113.8982545115.649324999157-1.7510704991574
42128.9375926129.841236453877-0.903643853876615
43111.8120023111.814461974203-0.00245967420316595
44119.9689463119.3700086589380.598937641062172
45117.018539118.224588400988-1.20604940098795
46132.4743387132.745308110919-0.270969410919278
47116.3369106115.0082087087731.32870189122736
48124.6405636122.8781180962411.76244550375922
49121.025249122.092411334788-1.06716233478832
50137.2054829137.227820990874-0.0223380908737981
51120.0187687120.045580270364-0.0268115703639352
52127.0443429128.540163697091-1.49582079709117
53124.349043127.257978154342-2.9089351543417
54143.6114438141.075863167872.53558063212959


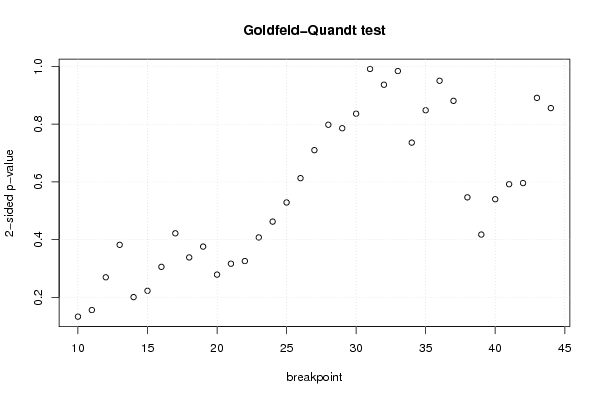
Goldfeld-Quandt test for Heteroskedasticity
p-valuesAlternative Hypothesis
breakpoint indexgreater2-sidedless
100.9333849860356240.1332300279287510.0666150139643757
110.9219377950087020.1561244099825960.0780622049912979
120.86521755949910.2695648810017980.134782440500899
130.808980626628990.382038746742020.19101937337101
140.899552145437520.2008957091249590.10044785456248
150.8886025841234320.2227948317531350.111397415876568
160.8470955215812330.3058089568375330.152904478418767
170.7890266823971220.4219466352057550.210973317602878
180.8308029057609540.3383941884780920.169197094239046
190.8120341407042340.3759317185915320.187965859295766
200.8605684559671240.2788630880657530.139431544032876
210.8416970327235620.3166059345528760.158302967276438
220.8370784814174070.3258430371651860.162921518582593
230.796180054851470.4076398902970580.203819945148529
240.7687759602126390.4624480795747230.231224039787361
250.7356315661605670.5287368676788660.264368433839433
260.6935192336987670.6129615326024660.306480766301233
270.6450351185512830.7099297628974340.354964881448717
280.6010162171436760.7979675657126480.398983782856324
290.6070525262319260.7858949475361480.392947473768074
300.5818895956979850.836220808604030.418110404302015
310.4956284560694410.9912569121388830.504371543930559
320.5317176080473710.9365647839052590.468282391952629
330.4919875772558090.9839751545116180.508012422744191
340.6319816236683480.7360367526633040.368018376331652
350.5759134189739180.8481731620521640.424086581026082
360.4751958133743150.950391626748630.524804186625685
370.4404134875528730.8808269751057450.559586512447127
380.7267168103003760.5465663793992490.273283189699624
390.791190975965760.4176180480684810.20880902403424
400.7299876852196690.5400246295606630.270012314780331
410.704024123322440.5919517533551210.295975876677561
420.7020133288165250.5959733423669510.297986671183475
430.5544858387481450.891028322503710.445514161251855
440.4278184576130530.8556369152261060.572181542386947

\begin{tabular}{lllllllll}
\hline
Goldfeld-Quandt test for Heteroskedasticity \tabularnewline
p-values & Alternative Hypothesis \tabularnewline
breakpoint index & greater & 2-sided & less \tabularnewline
10 & 0.933384986035624 & 0.133230027928751 & 0.0666150139643757 \tabularnewline
11 & 0.921937795008702 & 0.156124409982596 & 0.0780622049912979 \tabularnewline
12 & 0.8652175594991 & 0.269564881001798 & 0.134782440500899 \tabularnewline
13 & 0.80898062662899 & 0.38203874674202 & 0.19101937337101 \tabularnewline
14 & 0.89955214543752 & 0.200895709124959 & 0.10044785456248 \tabularnewline
15 & 0.888602584123432 & 0.222794831753135 & 0.111397415876568 \tabularnewline
16 & 0.847095521581233 & 0.305808956837533 & 0.152904478418767 \tabularnewline
17 & 0.789026682397122 & 0.421946635205755 & 0.210973317602878 \tabularnewline
18 & 0.830802905760954 & 0.338394188478092 & 0.169197094239046 \tabularnewline
19 & 0.812034140704234 & 0.375931718591532 & 0.187965859295766 \tabularnewline
20 & 0.860568455967124 & 0.278863088065753 & 0.139431544032876 \tabularnewline
21 & 0.841697032723562 & 0.316605934552876 & 0.158302967276438 \tabularnewline
22 & 0.837078481417407 & 0.325843037165186 & 0.162921518582593 \tabularnewline
23 & 0.79618005485147 & 0.407639890297058 & 0.203819945148529 \tabularnewline
24 & 0.768775960212639 & 0.462448079574723 & 0.231224039787361 \tabularnewline
25 & 0.735631566160567 & 0.528736867678866 & 0.264368433839433 \tabularnewline
26 & 0.693519233698767 & 0.612961532602466 & 0.306480766301233 \tabularnewline
27 & 0.645035118551283 & 0.709929762897434 & 0.354964881448717 \tabularnewline
28 & 0.601016217143676 & 0.797967565712648 & 0.398983782856324 \tabularnewline
29 & 0.607052526231926 & 0.785894947536148 & 0.392947473768074 \tabularnewline
30 & 0.581889595697985 & 0.83622080860403 & 0.418110404302015 \tabularnewline
31 & 0.495628456069441 & 0.991256912138883 & 0.504371543930559 \tabularnewline
32 & 0.531717608047371 & 0.936564783905259 & 0.468282391952629 \tabularnewline
33 & 0.491987577255809 & 0.983975154511618 & 0.508012422744191 \tabularnewline
34 & 0.631981623668348 & 0.736036752663304 & 0.368018376331652 \tabularnewline
35 & 0.575913418973918 & 0.848173162052164 & 0.424086581026082 \tabularnewline
36 & 0.475195813374315 & 0.95039162674863 & 0.524804186625685 \tabularnewline
37 & 0.440413487552873 & 0.880826975105745 & 0.559586512447127 \tabularnewline
38 & 0.726716810300376 & 0.546566379399249 & 0.273283189699624 \tabularnewline
39 & 0.79119097596576 & 0.417618048068481 & 0.20880902403424 \tabularnewline
40 & 0.729987685219669 & 0.540024629560663 & 0.270012314780331 \tabularnewline
41 & 0.70402412332244 & 0.591951753355121 & 0.295975876677561 \tabularnewline
42 & 0.702013328816525 & 0.595973342366951 & 0.297986671183475 \tabularnewline
43 & 0.554485838748145 & 0.89102832250371 & 0.445514161251855 \tabularnewline
44 & 0.427818457613053 & 0.855636915226106 & 0.572181542386947 \tabularnewline
\hline
\end{tabular}
%Source: https://freestatistics.org/blog/index.php?pk=117802&T=5

[TABLE]
[ROW][C]Goldfeld-Quandt test for Heteroskedasticity[/C][/ROW]
[ROW][C]p-values[/C][C]Alternative Hypothesis[/C][/ROW]
[ROW][C]breakpoint index[/C][C]greater[/C][C]2-sided[/C][C]less[/C][/ROW]
[ROW][C]10[/C][C]0.933384986035624[/C][C]0.133230027928751[/C][C]0.0666150139643757[/C][/ROW]
[ROW][C]11[/C][C]0.921937795008702[/C][C]0.156124409982596[/C][C]0.0780622049912979[/C][/ROW]
[ROW][C]12[/C][C]0.8652175594991[/C][C]0.269564881001798[/C][C]0.134782440500899[/C][/ROW]
[ROW][C]13[/C][C]0.80898062662899[/C][C]0.38203874674202[/C][C]0.19101937337101[/C][/ROW]
[ROW][C]14[/C][C]0.89955214543752[/C][C]0.200895709124959[/C][C]0.10044785456248[/C][/ROW]
[ROW][C]15[/C][C]0.888602584123432[/C][C]0.222794831753135[/C][C]0.111397415876568[/C][/ROW]
[ROW][C]16[/C][C]0.847095521581233[/C][C]0.305808956837533[/C][C]0.152904478418767[/C][/ROW]
[ROW][C]17[/C][C]0.789026682397122[/C][C]0.421946635205755[/C][C]0.210973317602878[/C][/ROW]
[ROW][C]18[/C][C]0.830802905760954[/C][C]0.338394188478092[/C][C]0.169197094239046[/C][/ROW]
[ROW][C]19[/C][C]0.812034140704234[/C][C]0.375931718591532[/C][C]0.187965859295766[/C][/ROW]
[ROW][C]20[/C][C]0.860568455967124[/C][C]0.278863088065753[/C][C]0.139431544032876[/C][/ROW]
[ROW][C]21[/C][C]0.841697032723562[/C][C]0.316605934552876[/C][C]0.158302967276438[/C][/ROW]
[ROW][C]22[/C][C]0.837078481417407[/C][C]0.325843037165186[/C][C]0.162921518582593[/C][/ROW]
[ROW][C]23[/C][C]0.79618005485147[/C][C]0.407639890297058[/C][C]0.203819945148529[/C][/ROW]
[ROW][C]24[/C][C]0.768775960212639[/C][C]0.462448079574723[/C][C]0.231224039787361[/C][/ROW]
[ROW][C]25[/C][C]0.735631566160567[/C][C]0.528736867678866[/C][C]0.264368433839433[/C][/ROW]
[ROW][C]26[/C][C]0.693519233698767[/C][C]0.612961532602466[/C][C]0.306480766301233[/C][/ROW]
[ROW][C]27[/C][C]0.645035118551283[/C][C]0.709929762897434[/C][C]0.354964881448717[/C][/ROW]
[ROW][C]28[/C][C]0.601016217143676[/C][C]0.797967565712648[/C][C]0.398983782856324[/C][/ROW]
[ROW][C]29[/C][C]0.607052526231926[/C][C]0.785894947536148[/C][C]0.392947473768074[/C][/ROW]
[ROW][C]30[/C][C]0.581889595697985[/C][C]0.83622080860403[/C][C]0.418110404302015[/C][/ROW]
[ROW][C]31[/C][C]0.495628456069441[/C][C]0.991256912138883[/C][C]0.504371543930559[/C][/ROW]
[ROW][C]32[/C][C]0.531717608047371[/C][C]0.936564783905259[/C][C]0.468282391952629[/C][/ROW]
[ROW][C]33[/C][C]0.491987577255809[/C][C]0.983975154511618[/C][C]0.508012422744191[/C][/ROW]
[ROW][C]34[/C][C]0.631981623668348[/C][C]0.736036752663304[/C][C]0.368018376331652[/C][/ROW]
[ROW][C]35[/C][C]0.575913418973918[/C][C]0.848173162052164[/C][C]0.424086581026082[/C][/ROW]
[ROW][C]36[/C][C]0.475195813374315[/C][C]0.95039162674863[/C][C]0.524804186625685[/C][/ROW]
[ROW][C]37[/C][C]0.440413487552873[/C][C]0.880826975105745[/C][C]0.559586512447127[/C][/ROW]
[ROW][C]38[/C][C]0.726716810300376[/C][C]0.546566379399249[/C][C]0.273283189699624[/C][/ROW]
[ROW][C]39[/C][C]0.79119097596576[/C][C]0.417618048068481[/C][C]0.20880902403424[/C][/ROW]
[ROW][C]40[/C][C]0.729987685219669[/C][C]0.540024629560663[/C][C]0.270012314780331[/C][/ROW]
[ROW][C]41[/C][C]0.70402412332244[/C][C]0.591951753355121[/C][C]0.295975876677561[/C][/ROW]
[ROW][C]42[/C][C]0.702013328816525[/C][C]0.595973342366951[/C][C]0.297986671183475[/C][/ROW]
[ROW][C]43[/C][C]0.554485838748145[/C][C]0.89102832250371[/C][C]0.445514161251855[/C][/ROW]
[ROW][C]44[/C][C]0.427818457613053[/C][C]0.855636915226106[/C][C]0.572181542386947[/C][/ROW]
[/TABLE]
Source: https://freestatistics.org/blog/index.php?pk=117802&T=5

Globally Unique Identifier (entire table): ba.freestatistics.org/blog/index.php?pk=117802&T=5

As an alternative you can also use a QR Code:  

The GUIDs for individual cells are displayed in the table below:

Goldfeld-Quandt test for Heteroskedasticity
p-valuesAlternative Hypothesis
breakpoint indexgreater2-sidedless
100.9333849860356240.1332300279287510.0666150139643757
110.9219377950087020.1561244099825960.0780622049912979
120.86521755949910.2695648810017980.134782440500899
130.808980626628990.382038746742020.19101937337101
140.899552145437520.2008957091249590.10044785456248
150.8886025841234320.2227948317531350.111397415876568
160.8470955215812330.3058089568375330.152904478418767
170.7890266823971220.4219466352057550.210973317602878
180.8308029057609540.3383941884780920.169197094239046
190.8120341407042340.3759317185915320.187965859295766
200.8605684559671240.2788630880657530.139431544032876
210.8416970327235620.3166059345528760.158302967276438
220.8370784814174070.3258430371651860.162921518582593
230.796180054851470.4076398902970580.203819945148529
240.7687759602126390.4624480795747230.231224039787361
250.7356315661605670.5287368676788660.264368433839433
260.6935192336987670.6129615326024660.306480766301233
270.6450351185512830.7099297628974340.354964881448717
280.6010162171436760.7979675657126480.398983782856324
290.6070525262319260.7858949475361480.392947473768074
300.5818895956979850.836220808604030.418110404302015
310.4956284560694410.9912569121388830.504371543930559
320.5317176080473710.9365647839052590.468282391952629
330.4919875772558090.9839751545116180.508012422744191
340.6319816236683480.7360367526633040.368018376331652
350.5759134189739180.8481731620521640.424086581026082
360.4751958133743150.950391626748630.524804186625685
370.4404134875528730.8808269751057450.559586512447127
380.7267168103003760.5465663793992490.273283189699624
390.791190975965760.4176180480684810.20880902403424
400.7299876852196690.5400246295606630.270012314780331
410.704024123322440.5919517533551210.295975876677561
420.7020133288165250.5959733423669510.297986671183475
430.5544858387481450.891028322503710.445514161251855
440.4278184576130530.8556369152261060.572181542386947


Meta Analysis of Goldfeld-Quandt test for Heteroskedasticity
Description# significant tests% significant testsOK/NOK
1% type I error level00OK
5% type I error level00OK
10% type I error level00OK

\begin{tabular}{lllllllll}
\hline
Meta Analysis of Goldfeld-Quandt test for Heteroskedasticity \tabularnewline
Description & # significant tests & % significant tests & OK/NOK \tabularnewline
1% type I error level & 0 & 0 & OK \tabularnewline
5% type I error level & 0 & 0 & OK \tabularnewline
10% type I error level & 0 & 0 & OK \tabularnewline
\hline
\end{tabular}
%Source: https://freestatistics.org/blog/index.php?pk=117802&T=6

[TABLE]
[ROW][C]Meta Analysis of Goldfeld-Quandt test for Heteroskedasticity[/C][/ROW]
[ROW][C]Description[/C][C]# significant tests[/C][C]% significant tests[/C][C]OK/NOK[/C][/ROW]
[ROW][C]1% type I error level[/C][C]0[/C][C]0[/C][C]OK[/C][/ROW]
[ROW][C]5% type I error level[/C][C]0[/C][C]0[/C][C]OK[/C][/ROW]
[ROW][C]10% type I error level[/C][C]0[/C][C]0[/C][C]OK[/C][/ROW]
[/TABLE]
Source: https://freestatistics.org/blog/index.php?pk=117802&T=6

Globally Unique Identifier (entire table): ba.freestatistics.org/blog/index.php?pk=117802&T=6

As an alternative you can also use a QR Code:  

The GUIDs for individual cells are displayed in the table below:

Meta Analysis of Goldfeld-Quandt test for Heteroskedasticity
Description# significant tests% significant testsOK/NOK
1% type I error level00OK
5% type I error level00OK
10% type I error level00OK


Parameters (Session):
par1 = 1 ; par2 = Include Quarterly Dummies ; par3 = No Linear Trend ;
Parameters (R input):
par1 = 1 ; par2 = Include Quarterly Dummies ; par3 = No Linear Trend ; par4 = ; par5 = ; par6 = ; par7 = ; par8 = ; par9 = ; par10 = ; par11 = ; par12 = ; par13 = ; par14 = ; par15 = ; par16 = ; par17 = ; par18 = ; par19 = ; par20 = ;
R code (references can be found in the software module):
library(lattice)
library(lmtest)
n25 <- 25 #minimum number of obs. for Goldfeld-Quandt test
par1 <- as.numeric(par1)
x <- t(y)
k <- length(x[1,])
n <- length(x[,1])
x1 <- cbind(x[,par1], x[,1:k!=par1])
mycolnames <- c(colnames(x)[par1], colnames(x)[1:k!=par1])
colnames(x1) <- mycolnames #colnames(x)[par1]
x <- x1
if (par3 == 'First Differences'){
x2 <- array(0, dim=c(n-1,k), dimnames=list(1:(n-1), paste('(1-B)',colnames(x),sep='')))
for (i in 1:n-1) {
for (j in 1:k) {
x2[i,j] <- x[i+1,j] - x[i,j]
}
}
x <- x2
}
if (par2 == 'Include Monthly Dummies'){
x2 <- array(0, dim=c(n,11), dimnames=list(1:n, paste('M', seq(1:11), sep ='')))
for (i in 1:11){
x2[seq(i,n,12),i] <- 1
}
x <- cbind(x, x2)
}
if (par2 == 'Include Quarterly Dummies'){
x2 <- array(0, dim=c(n,3), dimnames=list(1:n, paste('Q', seq(1:3), sep ='')))
for (i in 1:3){
x2[seq(i,n,4),i] <- 1
}
x <- cbind(x, x2)
}
k <- length(x[1,])
if (par3 == 'Linear Trend'){
x <- cbind(x, c(1:n))
colnames(x)[k+1] <- 't'
}
x
k <- length(x[1,])
df <- as.data.frame(x)
(mylm <- lm(df))
(mysum <- summary(mylm))
if (n > n25) {
kp3 <- k + 3
nmkm3 <- n - k - 3
gqarr <- array(NA, dim=c(nmkm3-kp3+1,3))
numgqtests <- 0
numsignificant1 <- 0
numsignificant5 <- 0
numsignificant10 <- 0
for (mypoint in kp3:nmkm3) {
j <- 0
numgqtests <- numgqtests + 1
for (myalt in c('greater', 'two.sided', 'less')) {
j <- j + 1
gqarr[mypoint-kp3+1,j] <- gqtest(mylm, point=mypoint, alternative=myalt)$p.value
}
if (gqarr[mypoint-kp3+1,2] < 0.01) numsignificant1 <- numsignificant1 + 1
if (gqarr[mypoint-kp3+1,2] < 0.05) numsignificant5 <- numsignificant5 + 1
if (gqarr[mypoint-kp3+1,2] < 0.10) numsignificant10 <- numsignificant10 + 1
}
gqarr
}
bitmap(file='test0.png')
plot(x[,1], type='l', main='Actuals and Interpolation', ylab='value of Actuals and Interpolation (dots)', xlab='time or index')
points(x[,1]-mysum$resid)
grid()
dev.off()
bitmap(file='test1.png')
plot(mysum$resid, type='b', pch=19, main='Residuals', ylab='value of Residuals', xlab='time or index')
grid()
dev.off()
bitmap(file='test2.png')
hist(mysum$resid, main='Residual Histogram', xlab='values of Residuals')
grid()
dev.off()
bitmap(file='test3.png')
densityplot(~mysum$resid,col='black',main='Residual Density Plot', xlab='values of Residuals')
dev.off()
bitmap(file='test4.png')
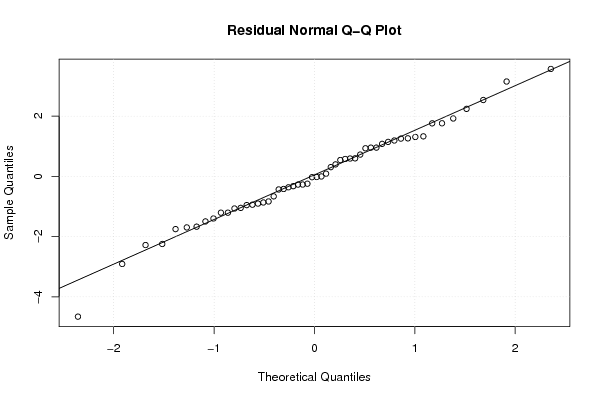
qqnorm(mysum$resid, main='Residual Normal Q-Q Plot')
qqline(mysum$resid)
grid()
dev.off()
(myerror <- as.ts(mysum$resid))
bitmap(file='test5.png')
dum <- cbind(lag(myerror,k=1),myerror)
dum
dum1 <- dum[2:length(myerror),]
dum1
z <- as.data.frame(dum1)
z
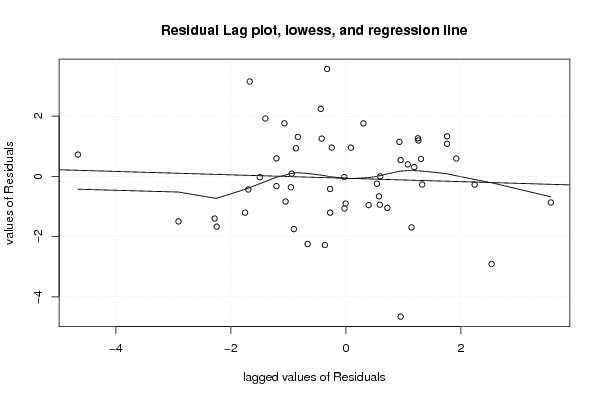
plot(z,main=paste('Residual Lag plot, lowess, and regression line'), ylab='values of Residuals', xlab='lagged values of Residuals')
lines(lowess(z))
abline(lm(z))
grid()
dev.off()
bitmap(file='test6.png')
acf(mysum$resid, lag.max=length(mysum$resid)/2, main='Residual Autocorrelation Function')
grid()
dev.off()
bitmap(file='test7.png')
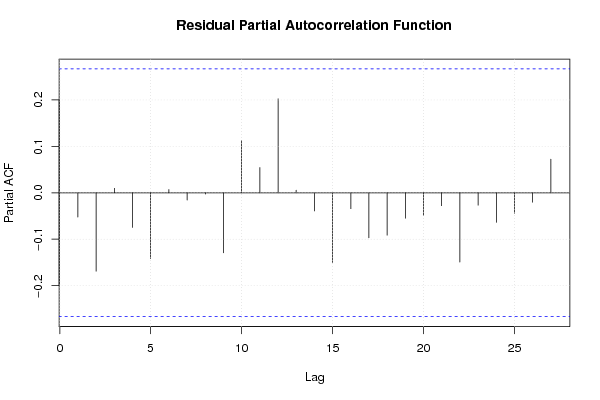
pacf(mysum$resid, lag.max=length(mysum$resid)/2, main='Residual Partial Autocorrelation Function')
grid()
dev.off()
bitmap(file='test8.png')
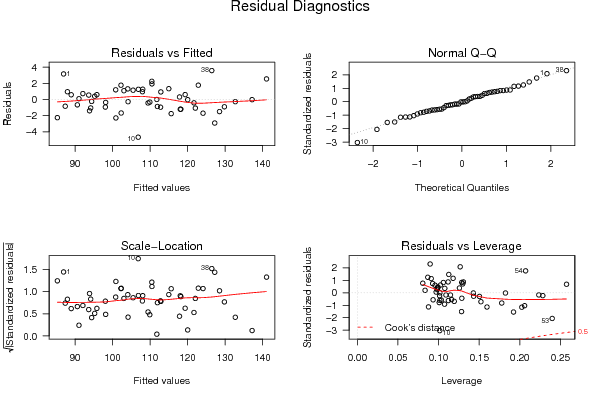
opar <- par(mfrow = c(2,2), oma = c(0, 0, 1.1, 0))
plot(mylm, las = 1, sub='Residual Diagnostics')
par(opar)
dev.off()
if (n > n25) {
bitmap(file='test9.png')
plot(kp3:nmkm3,gqarr[,2], main='Goldfeld-Quandt test',ylab='2-sided p-value',xlab='breakpoint')
grid()
dev.off()
}
load(file='createtable')
a<-table.start()
a<-table.row.start(a)
a<-table.element(a, 'Multiple Linear Regression - Estimated Regression Equation', 1, TRUE)
a<-table.row.end(a)
myeq <- colnames(x)[1]
myeq <- paste(myeq, '[t] = ', sep='')
for (i in 1:k){
if (mysum$coefficients[i,1] > 0) myeq <- paste(myeq, '+', '')
myeq <- paste(myeq, mysum$coefficients[i,1], sep=' ')
if (rownames(mysum$coefficients)[i] != '(Intercept)') {
myeq <- paste(myeq, rownames(mysum$coefficients)[i], sep='')
if (rownames(mysum$coefficients)[i] != 't') myeq <- paste(myeq, '[t]', sep='')
}
}
myeq <- paste(myeq, ' + e[t]')
a<-table.row.start(a)
a<-table.element(a, myeq)
a<-table.row.end(a)
a<-table.end(a)
table.save(a,file='mytable1.tab')
a<-table.start()
a<-table.row.start(a)
a<-table.element(a,hyperlink('ols1.htm','Multiple Linear Regression - Ordinary Least Squares',''), 6, TRUE)
a<-table.row.end(a)
a<-table.row.start(a)
a<-table.element(a,'Variable',header=TRUE)
a<-table.element(a,'Parameter',header=TRUE)
a<-table.element(a,'S.D.',header=TRUE)
a<-table.element(a,'T-STAT
H0: parameter = 0',header=TRUE)
a<-table.element(a,'2-tail p-value',header=TRUE)
a<-table.element(a,'1-tail p-value',header=TRUE)
a<-table.row.end(a)
for (i in 1:k){
a<-table.row.start(a)
a<-table.element(a,rownames(mysum$coefficients)[i],header=TRUE)
a<-table.element(a,mysum$coefficients[i,1])
a<-table.element(a, round(mysum$coefficients[i,2],6))
a<-table.element(a, round(mysum$coefficients[i,3],4))
a<-table.element(a, round(mysum$coefficients[i,4],6))
a<-table.element(a, round(mysum$coefficients[i,4]/2,6))
a<-table.row.end(a)
}
a<-table.end(a)
table.save(a,file='mytable2.tab')
a<-table.start()
a<-table.row.start(a)
a<-table.element(a, 'Multiple Linear Regression - Regression Statistics', 2, TRUE)
a<-table.row.end(a)
a<-table.row.start(a)
a<-table.element(a, 'Multiple R',1,TRUE)
a<-table.element(a, sqrt(mysum$r.squared))
a<-table.row.end(a)
a<-table.row.start(a)
a<-table.element(a, 'R-squared',1,TRUE)
a<-table.element(a, mysum$r.squared)
a<-table.row.end(a)
a<-table.row.start(a)
a<-table.element(a, 'Adjusted R-squared',1,TRUE)
a<-table.element(a, mysum$adj.r.squared)
a<-table.row.end(a)
a<-table.row.start(a)
a<-table.element(a, 'F-TEST (value)',1,TRUE)
a<-table.element(a, mysum$fstatistic[1])
a<-table.row.end(a)
a<-table.row.start(a)
a<-table.element(a, 'F-TEST (DF numerator)',1,TRUE)
a<-table.element(a, mysum$fstatistic[2])
a<-table.row.end(a)
a<-table.row.start(a)
a<-table.element(a, 'F-TEST (DF denominator)',1,TRUE)
a<-table.element(a, mysum$fstatistic[3])
a<-table.row.end(a)
a<-table.row.start(a)
a<-table.element(a, 'p-value',1,TRUE)
a<-table.element(a, 1-pf(mysum$fstatistic[1],mysum$fstatistic[2],mysum$fstatistic[3]))
a<-table.row.end(a)
a<-table.row.start(a)
a<-table.element(a, 'Multiple Linear Regression - Residual Statistics', 2, TRUE)
a<-table.row.end(a)
a<-table.row.start(a)
a<-table.element(a, 'Residual Standard Deviation',1,TRUE)
a<-table.element(a, mysum$sigma)
a<-table.row.end(a)
a<-table.row.start(a)
a<-table.element(a, 'Sum Squared Residuals',1,TRUE)
a<-table.element(a, sum(myerror*myerror))
a<-table.row.end(a)
a<-table.end(a)
table.save(a,file='mytable3.tab')
a<-table.start()
a<-table.row.start(a)
a<-table.element(a, 'Multiple Linear Regression - Actuals, Interpolation, and Residuals', 4, TRUE)
a<-table.row.end(a)
a<-table.row.start(a)
a<-table.element(a, 'Time or Index', 1, TRUE)
a<-table.element(a, 'Actuals', 1, TRUE)
a<-table.element(a, 'Interpolation
Forecast', 1, TRUE)
a<-table.element(a, 'Residuals
Prediction Error', 1, TRUE)
a<-table.row.end(a)
for (i in 1:n) {
a<-table.row.start(a)
a<-table.element(a,i, 1, TRUE)
a<-table.element(a,x[i])
a<-table.element(a,x[i]-mysum$resid[i])
a<-table.element(a,mysum$resid[i])
a<-table.row.end(a)
}
a<-table.end(a)
table.save(a,file='mytable4.tab')
if (n > n25) {
a<-table.start()
a<-table.row.start(a)
a<-table.element(a,'Goldfeld-Quandt test for Heteroskedasticity',4,TRUE)
a<-table.row.end(a)
a<-table.row.start(a)
a<-table.element(a,'p-values',header=TRUE)
a<-table.element(a,'Alternative Hypothesis',3,header=TRUE)
a<-table.row.end(a)
a<-table.row.start(a)
a<-table.element(a,'breakpoint index',header=TRUE)
a<-table.element(a,'greater',header=TRUE)
a<-table.element(a,'2-sided',header=TRUE)
a<-table.element(a,'less',header=TRUE)
a<-table.row.end(a)
for (mypoint in kp3:nmkm3) {
a<-table.row.start(a)
a<-table.element(a,mypoint,header=TRUE)
a<-table.element(a,gqarr[mypoint-kp3+1,1])
a<-table.element(a,gqarr[mypoint-kp3+1,2])
a<-table.element(a,gqarr[mypoint-kp3+1,3])
a<-table.row.end(a)
}
a<-table.end(a)
table.save(a,file='mytable5.tab')
a<-table.start()
a<-table.row.start(a)
a<-table.element(a,'Meta Analysis of Goldfeld-Quandt test for Heteroskedasticity',4,TRUE)
a<-table.row.end(a)
a<-table.row.start(a)
a<-table.element(a,'Description',header=TRUE)
a<-table.element(a,'# significant tests',header=TRUE)
a<-table.element(a,'% significant tests',header=TRUE)
a<-table.element(a,'OK/NOK',header=TRUE)
a<-table.row.end(a)
a<-table.row.start(a)
a<-table.element(a,'1% type I error level',header=TRUE)
a<-table.element(a,numsignificant1)
a<-table.element(a,numsignificant1/numgqtests)
if (numsignificant1/numgqtests < 0.01) dum <- 'OK' else dum <- 'NOK'
a<-table.element(a,dum)
a<-table.row.end(a)
a<-table.row.start(a)
a<-table.element(a,'5% type I error level',header=TRUE)
a<-table.element(a,numsignificant5)
a<-table.element(a,numsignificant5/numgqtests)
if (numsignificant5/numgqtests < 0.05) dum <- 'OK' else dum <- 'NOK'
a<-table.element(a,dum)
a<-table.row.end(a)
a<-table.row.start(a)
a<-table.element(a,'10% type I error level',header=TRUE)
a<-table.element(a,numsignificant10)
a<-table.element(a,numsignificant10/numgqtests)
if (numsignificant10/numgqtests < 0.1) dum <- 'OK' else dum <- 'NOK'
a<-table.element(a,dum)
a<-table.row.end(a)
a<-table.end(a)
table.save(a,file='mytable6.tab')
}