Free Statistics
of Irreproducible Research!
Description of Statistical Computation | |||||||||||||||||||||||||||||||||||||||||
|---|---|---|---|---|---|---|---|---|---|---|---|---|---|---|---|---|---|---|---|---|---|---|---|---|---|---|---|---|---|---|---|---|---|---|---|---|---|---|---|---|---|
| Author's title | |||||||||||||||||||||||||||||||||||||||||
| Author | *Unverified author* | ||||||||||||||||||||||||||||||||||||||||
| R Software Module | rwasp_univariatedataseries.wasp | ||||||||||||||||||||||||||||||||||||||||
| Title produced by software | Univariate Data Series | ||||||||||||||||||||||||||||||||||||||||
| Date of computation | Tue, 27 Sep 2011 09:45:44 -0400 | ||||||||||||||||||||||||||||||||||||||||
| Cite this page as follows | Statistical Computations at FreeStatistics.org, Office for Research Development and Education, URL https://freestatistics.org/blog/index.php?v=date/2011/Sep/27/t13171314537cfqlgeed98jfth.htm/, Retrieved Thu, 18 Jun 2026 13:24:38 +0000 | ||||||||||||||||||||||||||||||||||||||||
| Statistical Computations at FreeStatistics.org, Office for Research Development and Education, URL https://freestatistics.org/blog/index.php?pk=124448, Retrieved Thu, 18 Jun 2026 13:24:38 +0000 | |||||||||||||||||||||||||||||||||||||||||
| QR Codes: | |||||||||||||||||||||||||||||||||||||||||
|
| |||||||||||||||||||||||||||||||||||||||||
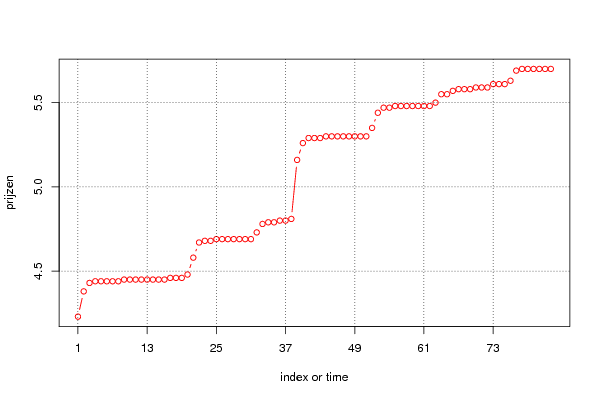
| Original text written by user: | De grafiek geeft de stijging van de tabakprijzen weer vanaf 2004 tot 2010. Daaruit kunnen we afleiden dat de prijzen gestegen zijn de laatste jaren. | ||||||||||||||||||||||||||||||||||||||||
| IsPrivate? | No (this computation is public) | ||||||||||||||||||||||||||||||||||||||||
| User-defined keywords | KDGP1W1 | ||||||||||||||||||||||||||||||||||||||||
| Estimated Impact | 414 | ||||||||||||||||||||||||||||||||||||||||
Tree of Dependent Computations | |||||||||||||||||||||||||||||||||||||||||
| Family? (F = Feedback message, R = changed R code, M = changed R Module, P = changed Parameters, D = changed Data) | |||||||||||||||||||||||||||||||||||||||||
| - [Univariate Data Series] [evolutie tabakpri...] [2011-09-27 13:45:44] [de3755f9a1b164103f4acd66d3337cdc] [Current] | |||||||||||||||||||||||||||||||||||||||||
| Feedback Forum | |||||||||||||||||||||||||||||||||||||||||
Post a new message | |||||||||||||||||||||||||||||||||||||||||
Dataset | |||||||||||||||||||||||||||||||||||||||||
| Dataseries X: | |||||||||||||||||||||||||||||||||||||||||
4,23 4,38 4,43 4,44 4,44 4,44 4,44 4,44 4,45 4,45 4,45 4,45 4,45 4,45 4,45 4,45 4,46 4,46 4,46 4,48 4,58 4,67 4,68 4,68 4,69 4,69 4,69 4,69 4,69 4,69 4,69 4,73 4,78 4,79 4,79 4,8 4,8 4,81 5,16 5,26 5,29 5,29 5,29 5,3 5,3 5,3 5,3 5,3 5,3 5,3 5,3 5,35 5,44 5,47 5,47 5,48 5,48 5,48 5,48 5,48 5,48 5,48 5,5 5,55 5,55 5,57 5,58 5,58 5,58 5,59 5,59 5,59 5,61 5,61 5,61 5,63 5,69 5,7 5,7 5,7 5,7 5,7 5,7 | |||||||||||||||||||||||||||||||||||||||||
Tables (Output of Computation) | |||||||||||||||||||||||||||||||||||||||||
| |||||||||||||||||||||||||||||||||||||||||
Figures (Output of Computation) | |||||||||||||||||||||||||||||||||||||||||
Input Parameters & R Code | |||||||||||||||||||||||||||||||||||||||||
| Parameters (Session): | |||||||||||||||||||||||||||||||||||||||||
| par1 = Evolutie tabakprijzen ; par2 = http://www.nbb.be/belgostat/PublicatieSelectieLinker?LinkID=696000057|910000082&Lang=N ; par3 = evolutie tabakprijzen ; par4 = 12 ; | |||||||||||||||||||||||||||||||||||||||||
| Parameters (R input): | |||||||||||||||||||||||||||||||||||||||||
| par1 = Evolutie tabakprijzen ; par2 = http://www.nbb.be/belgostat/PublicatieSelectieLinker?LinkID=696000057|910000082&Lang=N ; par3 = evolutie tabakprijzen ; par4 = 12 ; | |||||||||||||||||||||||||||||||||||||||||
| R code (references can be found in the software module): | |||||||||||||||||||||||||||||||||||||||||
if (par4 != 'No season') { | |||||||||||||||||||||||||||||||||||||||||