Free Statistics
of Irreproducible Research!
Description of Statistical Computation | ||||||||||||||||||||||||||||||
|---|---|---|---|---|---|---|---|---|---|---|---|---|---|---|---|---|---|---|---|---|---|---|---|---|---|---|---|---|---|---|
| Author's title | ||||||||||||||||||||||||||||||
| Author | *Unverified author* | |||||||||||||||||||||||||||||
| R Software Module | -- | |||||||||||||||||||||||||||||
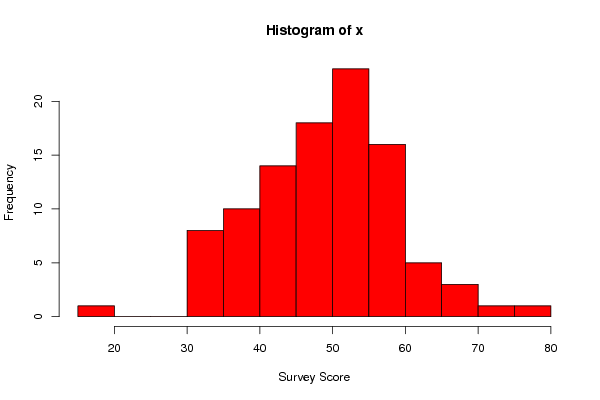
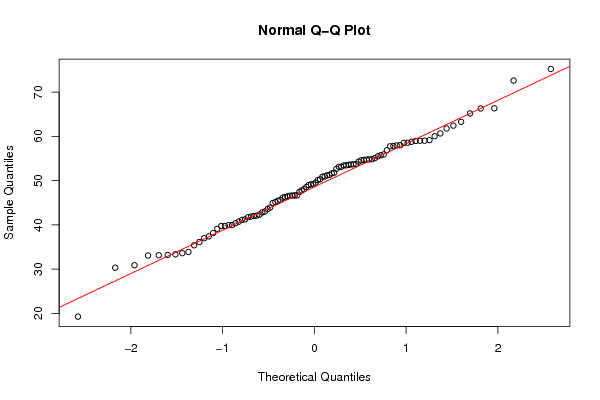
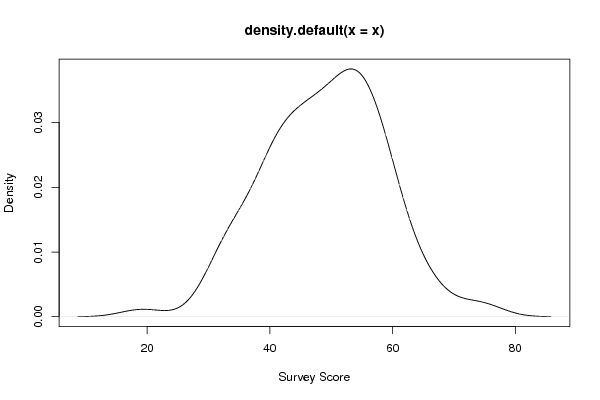
| Title produced by software | Histogram, QQplot and Density | |||||||||||||||||||||||||||||
| Date of computation | Mon, 24 Oct 2011 06:52:49 -0400 | |||||||||||||||||||||||||||||
| Cite this page as follows | Statistical Computations at FreeStatistics.org, Office for Research Development and Education, URL https://freestatistics.org/blog/index.php?v=date/2011/Oct/24/t1319454289b4kyuakoih3572r.htm/, Retrieved Wed, 15 May 2024 03:13:16 +0000 | |||||||||||||||||||||||||||||
| Statistical Computations at FreeStatistics.org, Office for Research Development and Education, URL https://freestatistics.org/blog/index.php?pk=134331, Retrieved Wed, 15 May 2024 03:13:16 +0000 | ||||||||||||||||||||||||||||||
| QR Codes: | ||||||||||||||||||||||||||||||
|
| ||||||||||||||||||||||||||||||
| Original text written by user: | ||||||||||||||||||||||||||||||
| IsPrivate? | No (this computation is public) | |||||||||||||||||||||||||||||
| User-defined keywords | ||||||||||||||||||||||||||||||
| Estimated Impact | 142 | |||||||||||||||||||||||||||||
Tree of Dependent Computations | ||||||||||||||||||||||||||||||
| Family? (F = Feedback message, R = changed R code, M = changed R Module, P = changed Parameters, D = changed Data) | ||||||||||||||||||||||||||||||
| - [Histogram, QQplot and Density] [Workshop 1 ] [2010-09-29 15:04:17] [98fd0e87c3eb04e0cc2efde01dbafab6] - D [Histogram, QQplot and Density] [QQplot N=100, Mea...] [2010-10-11 10:18:17] [98fd0e87c3eb04e0cc2efde01dbafab6] - RM [Histogram, QQplot and Density] [maternal iq data] [2011-10-24 10:52:49] [63044c77f6b2977d73bdbf448a4e14a4] [Current] | ||||||||||||||||||||||||||||||
| Feedback Forum | ||||||||||||||||||||||||||||||
Post a new message | ||||||||||||||||||||||||||||||
Dataset | ||||||||||||||||||||||||||||||
| Dataseries X: | ||||||||||||||||||||||||||||||
39.12448 33.0798 53.45432 53.1487 30.87978 46.44731 53.47016 52.68011 55.75793 59.17661 43.60416 19.25811 54.70652 46.16678 61.80364 51.6503 54.31479 57.96348 59.037 57.81371 49.19084 46.67529 50.9092 33.87344 66.36902 46.6383 36.99759 50.32119 49.19435 56.88627 63.30752 41.7377 60.05671 51.22368 33.19752 42.01993 37.40613 60.69045 45.19376 42.82525 39.73621 58.79602 51.30244 47.78152 47.46399 43.02434 58.01858 43.93111 48.9974 42.11096 58.99042 54.60322 42.32016 53.66529 41.89467 58.5597 59.02196 53.58498 53.75636 65.21254 41.14882 48.07883 38.1637 33.14679 33.35573 50.96306 41.26001 46.59853 40.74395 33.60979 54.86365 51.8094 48.59293 55.49863 57.77813 45.44277 49.54784 50.12593 55.10592 39.95971 55.93567 35.39927 53.1346 39.768 40.38378 53.71358 44.93907 54.81885 54.77115 75.2662 62.4517 46.69103 30.33013 45.64357 39.94453 66.33093 58.58105 46.27558 72.6433 36.12574 | ||||||||||||||||||||||||||||||
Tables (Output of Computation) | ||||||||||||||||||||||||||||||
| ||||||||||||||||||||||||||||||
Figures (Output of Computation) | ||||||||||||||||||||||||||||||
Input Parameters & R Code | ||||||||||||||||||||||||||||||
| Parameters (Session): | ||||||||||||||||||||||||||||||
| par1 = 15 ; | ||||||||||||||||||||||||||||||
| Parameters (R input): | ||||||||||||||||||||||||||||||
| par1 = 15 ; par2 = ; par3 = ; par4 = ; par5 = ; par6 = ; par7 = ; par8 = ; par9 = ; par10 = ; par11 = ; par12 = ; par13 = ; par14 = ; par15 = ; par16 = ; par17 = ; par18 = ; par19 = ; par20 = ; | ||||||||||||||||||||||||||||||
| R code (references can be found in the software module): | ||||||||||||||||||||||||||||||
bitmap(file='test1.png') | ||||||||||||||||||||||||||||||