Free Statistics
of Irreproducible Research!
Description of Statistical Computation | |
|---|---|
| Author's title | |
| Author | *The author of this computation has been verified* |
| R Software Module | Rscript (source code is shown below) |
| Title produced by software | R console |
| Date of computation | Thu, 18 Sep 2008 01:45:48 -0600 |
| Cite this page as follows | Statistical Computations at FreeStatistics.org, Office for Research Development and Education, URL https://freestatistics.org/blog/index.php?v=date/2008/Sep/18/t1221723949qaa8qjnltr0d849.htm/, Retrieved Thu, 30 Jul 2026 04:20:54 +0000 |
| Statistical Computations at FreeStatistics.org, Office for Research Development and Education, URL https://freestatistics.org/blog/index.php?pk=14722, Retrieved Thu, 30 Jul 2026 04:20:54 +0000 | |
| QR Codes: | |
|
| |
| Original text written by user: | |
| IsPrivate? | No (this computation is public) |
| User-defined keywords | |
| Estimated Impact | 494 |
Tree of Dependent Computations | |
| Family? (F = Feedback message, R = changed R code, M = changed R Module, P = changed Parameters, D = changed Data) | |
| - [R console] [test] [2008-09-18 07:45:48] [9871d3a2c554b27151cacf1422eec048] [Current] | |
| Feedback Forum | |
Post a new message | |
Dataset | |
| Dataseries X: | |
-1.37892677811827 1.5885251437746 -0.160373054736101 0.182644084721356 0.171080149753426 -1.25181392548835 -0.417223792259148 1.45486004006654 -0.708767658174765 0.000154588514562652 -0.245323300856037 -1.71186030006208 0.632254569503843 1.49680183971388 0.861184424558952 -0.338171381144084 0.606268762205993 -0.074345917600602 0.59663104658361 -0.078085980695875 -1.09617504515889 0.347597136396164 -1.46739766261771 -0.299254937734012 -0.408727109949117 0.617348844429227 0.211342324378127 -2.41168519843832 0.151824750874404 -0.261666465213489 0.828513091594685 0.241921164011346 0.21140853555673 -1.12228671552864 -0.180374970118449 1.7991896950986 -0.810963846216835 -0.184592318949581 -1.59874046244588 1.78676741574367 0.740269711003549 -1.76765116629635 0.46993945361942 -0.222075431863147 1.09348048064720 -3.27661659379652 -0.538244143870965 -1.60464377209887 -0.703443950154842 -0.533067369675291 -1.4277754830977 0.283177685880466 -0.846719609175436 1.53733520234545 1.15723120732926 2.38845529820562 -0.365224246866928 1.05445720594003 0.764359663062489 0.225489711752844 1.34602889933805 -0.347494579010098 -0.740204538911391 -0.558060279714299 -1.19665352116949 0.334440417104309 -0.569583223131072 -0.000823470960915638 -1.85585177251218 -0.914772204379378 0.782334006702391 -1.07743554495610 0.384788205972531 -0.495226981409914 -2.33024656722159 0.211359017794828 -1.13382719007452 -0.0727122792239617 -0.857091529958396 -0.352992887972012 0.140779292868762 -0.305230895075902 -0.208658370795305 -0.58853096881774 -0.0552309395394969 -0.945681046626793 1.47879671790118 0.77572073830028 0.687692965692021 0.730921286316718 0.116062165003992 -0.194279132432601 -0.488095942836684 0.168885607122091 1.55417084153541 0.961327703147316 0.140042165619829 -1.00611351937471 -0.929635733560794 1.38156266388357 | |
Tables (Output of Computation) | |
> first_number = 5
> second_number = 7
> strpar = 'hello'
> {
+ myfun <- function(x, y) {
+ x + y
+ }
+
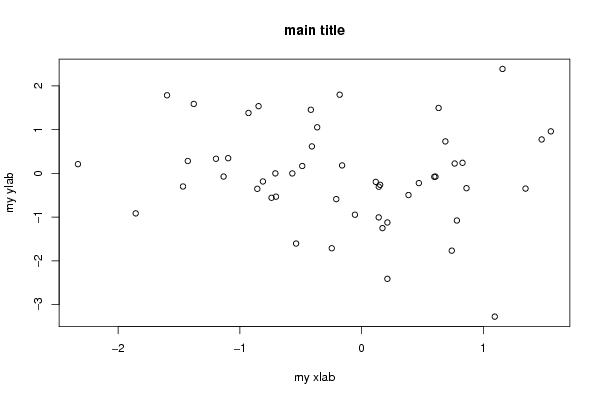
+ plot(RCx, main = 'main title', xlab = 'my xlab', ylab = 'my ylab')
+ .... [TRUNCATED]
[1] 12
| |
Figures (Output of Computation) | |
Input Parameters & R Code | |
| Parameters (Session): | |
| par1 = 5 ; par2 = 7 ; par3 = hello ; | |
| Parameters (R input): | |
| R code (body of R function): | |
{ | |