Free Statistics

of Irreproducible Research!

Author's title

Author*The author of this computation has been verified*
R Software Modulerwasp_pairs.wasp
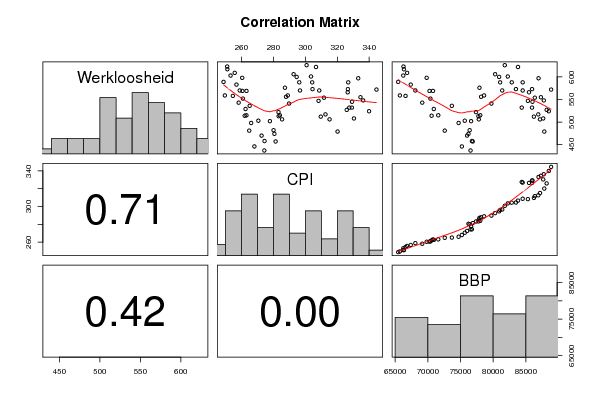
Title produced by softwareKendall tau Correlation Matrix
Date of computationSat, 17 Dec 2011 09:28:10 -0500
Cite this page as followsStatistical Computations at FreeStatistics.org, Office for Research Development and Education, URL https://freestatistics.org/blog/index.php?v=date/2011/Dec/17/t1324132176edhjv3xxa92od7g.htm/, Retrieved Tue, 30 Apr 2024 11:31:17 +0000
Statistical Computations at FreeStatistics.org, Office for Research Development and Education, URL https://freestatistics.org/blog/index.php?pk=156339, Retrieved Tue, 30 Apr 2024 11:31:17 +0000
QR Codes:

Original text written by user:
IsPrivate?No (this computation is public)
User-defined keywords
Estimated Impact124
Family? (F = Feedback message, R = changed R code, M = changed R Module, P = changed Parameters, D = changed Data)
-     [Univariate Data Series] [Paper] [2011-12-16 18:26:06] [43239ed98a62e091c70785d80176537f]
- RMPD  [Kendall tau Correlation Matrix] [Paper] [2011-12-17 00:10:32] [43239ed98a62e091c70785d80176537f]
-   PD      [Kendall tau Correlation Matrix] [Paper] [2011-12-17 14:28:10] [6e647d331a8f33aa61a2d78ef323178e] [Current]
Feedback Forum

Post a new message
Dataseries X:
589	248.85	65453
559	249.68	65715
623	251.13	66261
617	251.24	66332
603	253.24	66229
558	254.66	66579
609	255.85	66817
583	256.93	67373
570	258.99	68078
543	258.30	69137
598	260.53	69816
569	260.65	70252
552	260.98	70389
514	262.09	70572
569	263.18	70780
529	262.62	70912
515	263.18	71594
481	264.91	72587
536	265.20	73677
498	266.14	74712
446	268.15	75208
503	270.62	75657
470	272.65	76011
458	274.50	76748
437	274.37	76537
502	277.85	76622
482	280.15	76404
474	280.67	76219
457	281.42	76875
522	283.23	77374
513	283.34	77743
515	284.09	78030
506	285.47	77805
576	287.27	77905
556	287.96	78158
559	289.05	78616
541	289.84	79740
606	292.68	80312
600	294.61	80921
588	296.22	81078
570	296.70	81394
626	300.82	81787
601	303.57	82252
588	304.32	82854
573	304.52	83498
622	306.69	83811
570	308.73	84531
547	308.30	85330
512	309.67	86247
554	311.68	86386
517	312.62	86918
506	315.18	87184
479	320.19	87843
527	325.96	88204
508	330.45	87675
532	329.16	85964
532	327.53	84387
588	326.87	84530
566	326.52	85497
573	326.65	85968
545	329.25	86030
597	333.11	86963
555	334.51	87324
548	336.21	87770
524	339.91	88534
572	344.53	88888


Summary of computational transaction
Raw Inputview raw input (R code)
Raw Outputview raw output of R engine
Computing time1 seconds
R Server'Gwilym Jenkins' @ jenkins.wessa.net

\begin{tabular}{lllllllll}
\hline
Summary of computational transaction \tabularnewline
Raw Input & view raw input (R code)  \tabularnewline
Raw Output & view raw output of R engine  \tabularnewline
Computing time & 1 seconds \tabularnewline
R Server & 'Gwilym Jenkins' @ jenkins.wessa.net \tabularnewline
\hline
\end{tabular}
%Source: https://freestatistics.org/blog/index.php?pk=156339&T=0

[TABLE]
[ROW][C]Summary of computational transaction[/C][/ROW]
[ROW][C]Raw Input[/C][C]view raw input (R code) [/C][/ROW]
[ROW][C]Raw Output[/C][C]view raw output of R engine [/C][/ROW]
[ROW][C]Computing time[/C][C]1 seconds[/C][/ROW]
[ROW][C]R Server[/C][C]'Gwilym Jenkins' @ jenkins.wessa.net[/C][/ROW]
[/TABLE]
Source: https://freestatistics.org/blog/index.php?pk=156339&T=0

Globally Unique Identifier (entire table): ba.freestatistics.org/blog/index.php?pk=156339&T=0

As an alternative you can also use a QR Code:  

The GUIDs for individual cells are displayed in the table below:

Summary of computational transaction
Raw Inputview raw input (R code)
Raw Outputview raw output of R engine
Computing time1 seconds
R Server'Gwilym Jenkins' @ jenkins.wessa.net


Correlations for all pairs of data series (method=kendall)
WerkloosheidCPIBBP
Werkloosheid1-0.031-0.069
CPI-0.03110.933
BBP-0.0690.9331

\begin{tabular}{lllllllll}
\hline
Correlations for all pairs of data series (method=kendall) \tabularnewline
  & Werkloosheid & CPI & BBP \tabularnewline
Werkloosheid & 1 & -0.031 & -0.069 \tabularnewline
CPI & -0.031 & 1 & 0.933 \tabularnewline
BBP & -0.069 & 0.933 & 1 \tabularnewline
\hline
\end{tabular}
%Source: https://freestatistics.org/blog/index.php?pk=156339&T=1

[TABLE]
[ROW][C]Correlations for all pairs of data series (method=kendall)[/C][/ROW]
[ROW][C] [/C][C]Werkloosheid[/C][C]CPI[/C][C]BBP[/C][/ROW]
[ROW][C]Werkloosheid[/C][C]1[/C][C]-0.031[/C][C]-0.069[/C][/ROW]
[ROW][C]CPI[/C][C]-0.031[/C][C]1[/C][C]0.933[/C][/ROW]
[ROW][C]BBP[/C][C]-0.069[/C][C]0.933[/C][C]1[/C][/ROW]
[/TABLE]
Source: https://freestatistics.org/blog/index.php?pk=156339&T=1

Globally Unique Identifier (entire table): ba.freestatistics.org/blog/index.php?pk=156339&T=1

As an alternative you can also use a QR Code:  

The GUIDs for individual cells are displayed in the table below:

Correlations for all pairs of data series (method=kendall)
WerkloosheidCPIBBP
Werkloosheid1-0.031-0.069
CPI-0.03110.933
BBP-0.0690.9331


Correlations for all pairs of data series with p-values
pairPearson rSpearman rhoKendall tau
Werkloosheid;CPI0.0262-0.0397-0.0309
p-value(0.8346)(0.7518)(0.7149)
Werkloosheid;BBP-0.0926-0.0792-0.0687
p-value(0.4595)(0.5271)(0.4158)
CPI;BBP0.96560.98410.9326
p-value(0)(0)(0)

\begin{tabular}{lllllllll}
\hline
Correlations for all pairs of data series with p-values \tabularnewline
pair & Pearson r & Spearman rho & Kendall tau \tabularnewline
Werkloosheid;CPI & 0.0262 & -0.0397 & -0.0309 \tabularnewline
p-value & (0.8346) & (0.7518) & (0.7149) \tabularnewline
Werkloosheid;BBP & -0.0926 & -0.0792 & -0.0687 \tabularnewline
p-value & (0.4595) & (0.5271) & (0.4158) \tabularnewline
CPI;BBP & 0.9656 & 0.9841 & 0.9326 \tabularnewline
p-value & (0) & (0) & (0) \tabularnewline
\hline
\end{tabular}
%Source: https://freestatistics.org/blog/index.php?pk=156339&T=2

[TABLE]
[ROW][C]Correlations for all pairs of data series with p-values[/C][/ROW]
[ROW][C]pair[/C][C]Pearson r[/C][C]Spearman rho[/C][C]Kendall tau[/C][/ROW]
[ROW][C]Werkloosheid;CPI[/C][C]0.0262[/C][C]-0.0397[/C][C]-0.0309[/C][/ROW]
[ROW][C]p-value[/C][C](0.8346)[/C][C](0.7518)[/C][C](0.7149)[/C][/ROW]
[ROW][C]Werkloosheid;BBP[/C][C]-0.0926[/C][C]-0.0792[/C][C]-0.0687[/C][/ROW]
[ROW][C]p-value[/C][C](0.4595)[/C][C](0.5271)[/C][C](0.4158)[/C][/ROW]
[ROW][C]CPI;BBP[/C][C]0.9656[/C][C]0.9841[/C][C]0.9326[/C][/ROW]
[ROW][C]p-value[/C][C](0)[/C][C](0)[/C][C](0)[/C][/ROW]
[/TABLE]
Source: https://freestatistics.org/blog/index.php?pk=156339&T=2

Globally Unique Identifier (entire table): ba.freestatistics.org/blog/index.php?pk=156339&T=2

As an alternative you can also use a QR Code:  

The GUIDs for individual cells are displayed in the table below:

Correlations for all pairs of data series with p-values
pairPearson rSpearman rhoKendall tau
Werkloosheid;CPI0.0262-0.0397-0.0309
p-value(0.8346)(0.7518)(0.7149)
Werkloosheid;BBP-0.0926-0.0792-0.0687
p-value(0.4595)(0.5271)(0.4158)
CPI;BBP0.96560.98410.9326
p-value(0)(0)(0)


Parameters (Session):
par1 = kendall ;
Parameters (R input):
par1 = kendall ;
R code (references can be found in the software module):
panel.tau <- function(x, y, digits=2, prefix='', cex.cor)
{
usr <- par('usr'); on.exit(par(usr))
par(usr = c(0, 1, 0, 1))
rr <- cor.test(x, y, method=par1)
r <- round(rr$p.value,2)
txt <- format(c(r, 0.123456789), digits=digits)[1]
txt <- paste(prefix, txt, sep='')
if(missing(cex.cor)) cex <- 0.5/strwidth(txt)
text(0.5, 0.5, txt, cex = cex)
}
panel.hist <- function(x, ...)
{
usr <- par('usr'); on.exit(par(usr))
par(usr = c(usr[1:2], 0, 1.5) )
h <- hist(x, plot = FALSE)
breaks <- h$breaks; nB <- length(breaks)
y <- h$counts; y <- y/max(y)
rect(breaks[-nB], 0, breaks[-1], y, col='grey', ...)
}
bitmap(file='test1.png')
pairs(t(y),diag.panel=panel.hist, upper.panel=panel.smooth, lower.panel=panel.tau, main=main)
dev.off()
load(file='createtable')
n <- length(y[,1])
n
a<-table.start()
a<-table.row.start(a)
a<-table.element(a,paste('Correlations for all pairs of data series (method=',par1,')',sep=''),n+1,TRUE)
a<-table.row.end(a)
a<-table.row.start(a)
a<-table.element(a,' ',header=TRUE)
for (i in 1:n) {
a<-table.element(a,dimnames(t(x))[[2]][i],header=TRUE)
}
a<-table.row.end(a)
for (i in 1:n) {
a<-table.row.start(a)
a<-table.element(a,dimnames(t(x))[[2]][i],header=TRUE)
for (j in 1:n) {
r <- cor.test(y[i,],y[j,],method=par1)
a<-table.element(a,round(r$estimate,3))
}
a<-table.row.end(a)
}
a<-table.end(a)
table.save(a,file='mytable.tab')
a<-table.start()
a<-table.row.start(a)
a<-table.element(a,'Correlations for all pairs of data series with p-values',4,TRUE)
a<-table.row.end(a)
a<-table.row.start(a)
a<-table.element(a,'pair',1,TRUE)
a<-table.element(a,'Pearson r',1,TRUE)
a<-table.element(a,'Spearman rho',1,TRUE)
a<-table.element(a,'Kendall tau',1,TRUE)
a<-table.row.end(a)
cor.test(y[1,],y[2,],method=par1)
for (i in 1:(n-1))
{
for (j in (i+1):n)
{
a<-table.row.start(a)
dum <- paste(dimnames(t(x))[[2]][i],';',dimnames(t(x))[[2]][j],sep='')
a<-table.element(a,dum,header=TRUE)
rp <- cor.test(y[i,],y[j,],method='pearson')
a<-table.element(a,round(rp$estimate,4))
rs <- cor.test(y[i,],y[j,],method='spearman')
a<-table.element(a,round(rs$estimate,4))
rk <- cor.test(y[i,],y[j,],method='kendall')
a<-table.element(a,round(rk$estimate,4))
a<-table.row.end(a)
a<-table.row.start(a)
a<-table.element(a,'p-value',header=T)
a<-table.element(a,paste('(',round(rp$p.value,4),')',sep=''))
a<-table.element(a,paste('(',round(rs$p.value,4),')',sep=''))
a<-table.element(a,paste('(',round(rk$p.value,4),')',sep=''))
a<-table.row.end(a)
}
}
a<-table.end(a)
table.save(a,file='mytable1.tab')