Free Statistics

of Irreproducible Research!

Author's title

Author*Unverified author*
R Software Modulerwasp_exponentialsmoothing.wasp
Title produced by softwareExponential Smoothing
Date of computationTue, 27 Dec 2011 11:55:16 -0500
Cite this page as followsStatistical Computations at FreeStatistics.org, Office for Research Development and Education, URL https://freestatistics.org/blog/index.php?v=date/2011/Dec/27/t1325005212ku7pdnghvjluaj9.htm/, Retrieved Fri, 01 Nov 2024 00:08:55 +0000
Statistical Computations at FreeStatistics.org, Office for Research Development and Education, URL https://freestatistics.org/blog/index.php?pk=160863, Retrieved Fri, 01 Nov 2024 00:08:55 +0000
QR Codes:

Original text written by user:
IsPrivate?No (this computation is public)
User-defined keywordsKDGP2W101
Estimated Impact150
Family? (F = Feedback message, R = changed R code, M = changed R Module, P = changed Parameters, D = changed Data)
-       [Exponential Smoothing] [] [2011-12-27 16:55:16] [76c30f62b7052b57088120e90a652e05] [Current]
Feedback Forum

Post a new message
Dataseries X:
41086
39690
43129
37863
35953
29133
24693
22205
21725
27192
21790
13253
37702
30364
32609
30212
29965
28352
25814
22414
20506
28806
22228
13971
36845
35338
35022
34777
26887
23970
22780
17351
21382
24561
17409
11514
31514
27071
29462
26105
22397
23843
21705
18089
20764
25316
17704
15548
28029
29383
36438
32034
22679
24319
18004
17537
20366
22782
19169
13807
29743
25591
29096
26482
22405
27044
17970
18730
19684
19785
18479
10698


Summary of computational transaction
Raw Inputview raw input (R code)
Raw Outputview raw output of R engine
Computing time2 seconds
R Server'Herman Ole Andreas Wold' @ wold.wessa.net

\begin{tabular}{lllllllll}
\hline
Summary of computational transaction \tabularnewline
Raw Input & view raw input (R code)  \tabularnewline
Raw Output & view raw output of R engine  \tabularnewline
Computing time & 2 seconds \tabularnewline
R Server & 'Herman Ole Andreas Wold' @ wold.wessa.net \tabularnewline
\hline
\end{tabular}
%Source: https://freestatistics.org/blog/index.php?pk=160863&T=0

[TABLE]
[ROW][C]Summary of computational transaction[/C][/ROW]
[ROW][C]Raw Input[/C][C]view raw input (R code) [/C][/ROW]
[ROW][C]Raw Output[/C][C]view raw output of R engine [/C][/ROW]
[ROW][C]Computing time[/C][C]2 seconds[/C][/ROW]
[ROW][C]R Server[/C][C]'Herman Ole Andreas Wold' @ wold.wessa.net[/C][/ROW]
[/TABLE]
Source: https://freestatistics.org/blog/index.php?pk=160863&T=0

Globally Unique Identifier (entire table): ba.freestatistics.org/blog/index.php?pk=160863&T=0

As an alternative you can also use a QR Code:  

The GUIDs for individual cells are displayed in the table below:

Summary of computational transaction
Raw Inputview raw input (R code)
Raw Outputview raw output of R engine
Computing time2 seconds
R Server'Herman Ole Andreas Wold' @ wold.wessa.net


Estimated Parameters of Exponential Smoothing
ParameterValue
alpha0.225679028753381
beta0.00094149628695353
gamma0.443442884267109

\begin{tabular}{lllllllll}
\hline
Estimated Parameters of Exponential Smoothing \tabularnewline
Parameter & Value \tabularnewline
alpha & 0.225679028753381 \tabularnewline
beta & 0.00094149628695353 \tabularnewline
gamma & 0.443442884267109 \tabularnewline
\hline
\end{tabular}
%Source: https://freestatistics.org/blog/index.php?pk=160863&T=1

[TABLE]
[ROW][C]Estimated Parameters of Exponential Smoothing[/C][/ROW]
[ROW][C]Parameter[/C][C]Value[/C][/ROW]
[ROW][C]alpha[/C][C]0.225679028753381[/C][/ROW]
[ROW][C]beta[/C][C]0.00094149628695353[/C][/ROW]
[ROW][C]gamma[/C][C]0.443442884267109[/C][/ROW]
[/TABLE]
Source: https://freestatistics.org/blog/index.php?pk=160863&T=1

Globally Unique Identifier (entire table): ba.freestatistics.org/blog/index.php?pk=160863&T=1

As an alternative you can also use a QR Code:  

The GUIDs for individual cells are displayed in the table below:

Estimated Parameters of Exponential Smoothing
ParameterValue
alpha0.225679028753381
beta0.00094149628695353
gamma0.443442884267109


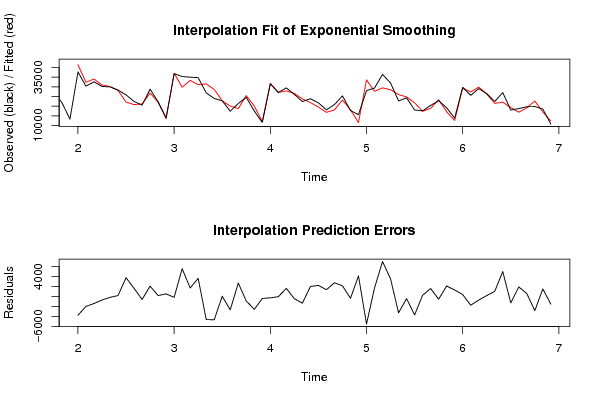
Interpolation Forecasts of Exponential Smoothing
tObservedFittedResiduals
133770241487.9961256582-3785.99612565825
143036432384.2423306442-2020.24233064425
153260934048.8239474299-1439.82394742995
163021230953.0817784332-741.081778433225
172996530167.1615625255-202.161562525485
182835228194.2876712476157.712328752361
192581422076.54434447443737.45565552559
202241420801.92075326851612.07924673147
212050621128.7820231163-622.782023116299
222880626754.52591915812051.47408084186
232222822076.0673309998151.932669000234
241397113470.8643970093500.135602990666
253684537059.4733194597-214.473319459685
263533829795.48397040955542.51602959053
273502233348.72441949351673.27558050646
283477731163.74413083353613.25586916654
292688731542.0186569764-4655.01865697637
302397028668.3449958547-4698.34499585466
312278022752.225994222927.7740057771371
321735120061.3545527706-2710.35455277056
332138218709.0425300732672.95746992701
342456125498.9960342697-937.996034269712
351740920022.1189854636-2613.11898546363
361151411945.6711210862-431.671121086232
373151431811.1427395255-297.14273952548
382707127135.2239715721-64.2239715721189
392946227863.0241804421598.975819558
402610526585.9480635962-480.948063596174
412239723768.4474504742-1371.44745047418
422384321869.56385517791973.43614482211
432170519509.10820626692195.89179373314
441808916761.28097596471327.71902403528
452076418040.74222789112723.25777210893
462531623196.82850721112119.17149278885
471770418102.3007276653-398.300727665312
481554811461.22353787064086.77646212937
492802933585.8002125519-5556.80021255188
502938327714.04861898321668.95138101676
513643829460.21037802626977.78962197377
523203428524.13301245523509.8669875448
532267925984.1070779224-3305.1070779224
542431924768.3603312258-449.360331225813
551800421738.5190502803-3734.51905028026
561753717326.1475284396210.852471560382
572036618790.7238567431575.27614325702
582278223364.3485694359-582.348569435911
591916917096.14672940742072.85327059258
601380712536.44630626091270.55369373915
612974329375.0615334885367.938466511536
622559127375.1673514976-1784.16735149756
632909629845.1799392545-749.179939254514
642648226329.5061513019152.493848698105
652240521403.18892294961001.81107705045
662704422062.65158253584981.3484174642
671797019291.1739870878-1321.17398708778
681873016843.79259252211886.20740747787
691968419125.9670975998558.032902400162
701978522648.0790967229-2863.07909672288
711847916985.57738857341493.42261142662
721069812280.7803828333-1582.7803828333

\begin{tabular}{lllllllll}
\hline
Interpolation Forecasts of Exponential Smoothing \tabularnewline
t & Observed & Fitted & Residuals \tabularnewline
13 & 37702 & 41487.9961256582 & -3785.99612565825 \tabularnewline
14 & 30364 & 32384.2423306442 & -2020.24233064425 \tabularnewline
15 & 32609 & 34048.8239474299 & -1439.82394742995 \tabularnewline
16 & 30212 & 30953.0817784332 & -741.081778433225 \tabularnewline
17 & 29965 & 30167.1615625255 & -202.161562525485 \tabularnewline
18 & 28352 & 28194.2876712476 & 157.712328752361 \tabularnewline
19 & 25814 & 22076.5443444744 & 3737.45565552559 \tabularnewline
20 & 22414 & 20801.9207532685 & 1612.07924673147 \tabularnewline
21 & 20506 & 21128.7820231163 & -622.782023116299 \tabularnewline
22 & 28806 & 26754.5259191581 & 2051.47408084186 \tabularnewline
23 & 22228 & 22076.0673309998 & 151.932669000234 \tabularnewline
24 & 13971 & 13470.8643970093 & 500.135602990666 \tabularnewline
25 & 36845 & 37059.4733194597 & -214.473319459685 \tabularnewline
26 & 35338 & 29795.4839704095 & 5542.51602959053 \tabularnewline
27 & 35022 & 33348.7244194935 & 1673.27558050646 \tabularnewline
28 & 34777 & 31163.7441308335 & 3613.25586916654 \tabularnewline
29 & 26887 & 31542.0186569764 & -4655.01865697637 \tabularnewline
30 & 23970 & 28668.3449958547 & -4698.34499585466 \tabularnewline
31 & 22780 & 22752.2259942229 & 27.7740057771371 \tabularnewline
32 & 17351 & 20061.3545527706 & -2710.35455277056 \tabularnewline
33 & 21382 & 18709.042530073 & 2672.95746992701 \tabularnewline
34 & 24561 & 25498.9960342697 & -937.996034269712 \tabularnewline
35 & 17409 & 20022.1189854636 & -2613.11898546363 \tabularnewline
36 & 11514 & 11945.6711210862 & -431.671121086232 \tabularnewline
37 & 31514 & 31811.1427395255 & -297.14273952548 \tabularnewline
38 & 27071 & 27135.2239715721 & -64.2239715721189 \tabularnewline
39 & 29462 & 27863.024180442 & 1598.975819558 \tabularnewline
40 & 26105 & 26585.9480635962 & -480.948063596174 \tabularnewline
41 & 22397 & 23768.4474504742 & -1371.44745047418 \tabularnewline
42 & 23843 & 21869.5638551779 & 1973.43614482211 \tabularnewline
43 & 21705 & 19509.1082062669 & 2195.89179373314 \tabularnewline
44 & 18089 & 16761.2809759647 & 1327.71902403528 \tabularnewline
45 & 20764 & 18040.7422278911 & 2723.25777210893 \tabularnewline
46 & 25316 & 23196.8285072111 & 2119.17149278885 \tabularnewline
47 & 17704 & 18102.3007276653 & -398.300727665312 \tabularnewline
48 & 15548 & 11461.2235378706 & 4086.77646212937 \tabularnewline
49 & 28029 & 33585.8002125519 & -5556.80021255188 \tabularnewline
50 & 29383 & 27714.0486189832 & 1668.95138101676 \tabularnewline
51 & 36438 & 29460.2103780262 & 6977.78962197377 \tabularnewline
52 & 32034 & 28524.1330124552 & 3509.8669875448 \tabularnewline
53 & 22679 & 25984.1070779224 & -3305.1070779224 \tabularnewline
54 & 24319 & 24768.3603312258 & -449.360331225813 \tabularnewline
55 & 18004 & 21738.5190502803 & -3734.51905028026 \tabularnewline
56 & 17537 & 17326.1475284396 & 210.852471560382 \tabularnewline
57 & 20366 & 18790.723856743 & 1575.27614325702 \tabularnewline
58 & 22782 & 23364.3485694359 & -582.348569435911 \tabularnewline
59 & 19169 & 17096.1467294074 & 2072.85327059258 \tabularnewline
60 & 13807 & 12536.4463062609 & 1270.55369373915 \tabularnewline
61 & 29743 & 29375.0615334885 & 367.938466511536 \tabularnewline
62 & 25591 & 27375.1673514976 & -1784.16735149756 \tabularnewline
63 & 29096 & 29845.1799392545 & -749.179939254514 \tabularnewline
64 & 26482 & 26329.5061513019 & 152.493848698105 \tabularnewline
65 & 22405 & 21403.1889229496 & 1001.81107705045 \tabularnewline
66 & 27044 & 22062.6515825358 & 4981.3484174642 \tabularnewline
67 & 17970 & 19291.1739870878 & -1321.17398708778 \tabularnewline
68 & 18730 & 16843.7925925221 & 1886.20740747787 \tabularnewline
69 & 19684 & 19125.9670975998 & 558.032902400162 \tabularnewline
70 & 19785 & 22648.0790967229 & -2863.07909672288 \tabularnewline
71 & 18479 & 16985.5773885734 & 1493.42261142662 \tabularnewline
72 & 10698 & 12280.7803828333 & -1582.7803828333 \tabularnewline
\hline
\end{tabular}
%Source: https://freestatistics.org/blog/index.php?pk=160863&T=2

[TABLE]
[ROW][C]Interpolation Forecasts of Exponential Smoothing[/C][/ROW]
[ROW][C]t[/C][C]Observed[/C][C]Fitted[/C][C]Residuals[/C][/ROW]
[ROW][C]13[/C][C]37702[/C][C]41487.9961256582[/C][C]-3785.99612565825[/C][/ROW]
[ROW][C]14[/C][C]30364[/C][C]32384.2423306442[/C][C]-2020.24233064425[/C][/ROW]
[ROW][C]15[/C][C]32609[/C][C]34048.8239474299[/C][C]-1439.82394742995[/C][/ROW]
[ROW][C]16[/C][C]30212[/C][C]30953.0817784332[/C][C]-741.081778433225[/C][/ROW]
[ROW][C]17[/C][C]29965[/C][C]30167.1615625255[/C][C]-202.161562525485[/C][/ROW]
[ROW][C]18[/C][C]28352[/C][C]28194.2876712476[/C][C]157.712328752361[/C][/ROW]
[ROW][C]19[/C][C]25814[/C][C]22076.5443444744[/C][C]3737.45565552559[/C][/ROW]
[ROW][C]20[/C][C]22414[/C][C]20801.9207532685[/C][C]1612.07924673147[/C][/ROW]
[ROW][C]21[/C][C]20506[/C][C]21128.7820231163[/C][C]-622.782023116299[/C][/ROW]
[ROW][C]22[/C][C]28806[/C][C]26754.5259191581[/C][C]2051.47408084186[/C][/ROW]
[ROW][C]23[/C][C]22228[/C][C]22076.0673309998[/C][C]151.932669000234[/C][/ROW]
[ROW][C]24[/C][C]13971[/C][C]13470.8643970093[/C][C]500.135602990666[/C][/ROW]
[ROW][C]25[/C][C]36845[/C][C]37059.4733194597[/C][C]-214.473319459685[/C][/ROW]
[ROW][C]26[/C][C]35338[/C][C]29795.4839704095[/C][C]5542.51602959053[/C][/ROW]
[ROW][C]27[/C][C]35022[/C][C]33348.7244194935[/C][C]1673.27558050646[/C][/ROW]
[ROW][C]28[/C][C]34777[/C][C]31163.7441308335[/C][C]3613.25586916654[/C][/ROW]
[ROW][C]29[/C][C]26887[/C][C]31542.0186569764[/C][C]-4655.01865697637[/C][/ROW]
[ROW][C]30[/C][C]23970[/C][C]28668.3449958547[/C][C]-4698.34499585466[/C][/ROW]
[ROW][C]31[/C][C]22780[/C][C]22752.2259942229[/C][C]27.7740057771371[/C][/ROW]
[ROW][C]32[/C][C]17351[/C][C]20061.3545527706[/C][C]-2710.35455277056[/C][/ROW]
[ROW][C]33[/C][C]21382[/C][C]18709.042530073[/C][C]2672.95746992701[/C][/ROW]
[ROW][C]34[/C][C]24561[/C][C]25498.9960342697[/C][C]-937.996034269712[/C][/ROW]
[ROW][C]35[/C][C]17409[/C][C]20022.1189854636[/C][C]-2613.11898546363[/C][/ROW]
[ROW][C]36[/C][C]11514[/C][C]11945.6711210862[/C][C]-431.671121086232[/C][/ROW]
[ROW][C]37[/C][C]31514[/C][C]31811.1427395255[/C][C]-297.14273952548[/C][/ROW]
[ROW][C]38[/C][C]27071[/C][C]27135.2239715721[/C][C]-64.2239715721189[/C][/ROW]
[ROW][C]39[/C][C]29462[/C][C]27863.024180442[/C][C]1598.975819558[/C][/ROW]
[ROW][C]40[/C][C]26105[/C][C]26585.9480635962[/C][C]-480.948063596174[/C][/ROW]
[ROW][C]41[/C][C]22397[/C][C]23768.4474504742[/C][C]-1371.44745047418[/C][/ROW]
[ROW][C]42[/C][C]23843[/C][C]21869.5638551779[/C][C]1973.43614482211[/C][/ROW]
[ROW][C]43[/C][C]21705[/C][C]19509.1082062669[/C][C]2195.89179373314[/C][/ROW]
[ROW][C]44[/C][C]18089[/C][C]16761.2809759647[/C][C]1327.71902403528[/C][/ROW]
[ROW][C]45[/C][C]20764[/C][C]18040.7422278911[/C][C]2723.25777210893[/C][/ROW]
[ROW][C]46[/C][C]25316[/C][C]23196.8285072111[/C][C]2119.17149278885[/C][/ROW]
[ROW][C]47[/C][C]17704[/C][C]18102.3007276653[/C][C]-398.300727665312[/C][/ROW]
[ROW][C]48[/C][C]15548[/C][C]11461.2235378706[/C][C]4086.77646212937[/C][/ROW]
[ROW][C]49[/C][C]28029[/C][C]33585.8002125519[/C][C]-5556.80021255188[/C][/ROW]
[ROW][C]50[/C][C]29383[/C][C]27714.0486189832[/C][C]1668.95138101676[/C][/ROW]
[ROW][C]51[/C][C]36438[/C][C]29460.2103780262[/C][C]6977.78962197377[/C][/ROW]
[ROW][C]52[/C][C]32034[/C][C]28524.1330124552[/C][C]3509.8669875448[/C][/ROW]
[ROW][C]53[/C][C]22679[/C][C]25984.1070779224[/C][C]-3305.1070779224[/C][/ROW]
[ROW][C]54[/C][C]24319[/C][C]24768.3603312258[/C][C]-449.360331225813[/C][/ROW]
[ROW][C]55[/C][C]18004[/C][C]21738.5190502803[/C][C]-3734.51905028026[/C][/ROW]
[ROW][C]56[/C][C]17537[/C][C]17326.1475284396[/C][C]210.852471560382[/C][/ROW]
[ROW][C]57[/C][C]20366[/C][C]18790.723856743[/C][C]1575.27614325702[/C][/ROW]
[ROW][C]58[/C][C]22782[/C][C]23364.3485694359[/C][C]-582.348569435911[/C][/ROW]
[ROW][C]59[/C][C]19169[/C][C]17096.1467294074[/C][C]2072.85327059258[/C][/ROW]
[ROW][C]60[/C][C]13807[/C][C]12536.4463062609[/C][C]1270.55369373915[/C][/ROW]
[ROW][C]61[/C][C]29743[/C][C]29375.0615334885[/C][C]367.938466511536[/C][/ROW]
[ROW][C]62[/C][C]25591[/C][C]27375.1673514976[/C][C]-1784.16735149756[/C][/ROW]
[ROW][C]63[/C][C]29096[/C][C]29845.1799392545[/C][C]-749.179939254514[/C][/ROW]
[ROW][C]64[/C][C]26482[/C][C]26329.5061513019[/C][C]152.493848698105[/C][/ROW]
[ROW][C]65[/C][C]22405[/C][C]21403.1889229496[/C][C]1001.81107705045[/C][/ROW]
[ROW][C]66[/C][C]27044[/C][C]22062.6515825358[/C][C]4981.3484174642[/C][/ROW]
[ROW][C]67[/C][C]17970[/C][C]19291.1739870878[/C][C]-1321.17398708778[/C][/ROW]
[ROW][C]68[/C][C]18730[/C][C]16843.7925925221[/C][C]1886.20740747787[/C][/ROW]
[ROW][C]69[/C][C]19684[/C][C]19125.9670975998[/C][C]558.032902400162[/C][/ROW]
[ROW][C]70[/C][C]19785[/C][C]22648.0790967229[/C][C]-2863.07909672288[/C][/ROW]
[ROW][C]71[/C][C]18479[/C][C]16985.5773885734[/C][C]1493.42261142662[/C][/ROW]
[ROW][C]72[/C][C]10698[/C][C]12280.7803828333[/C][C]-1582.7803828333[/C][/ROW]
[/TABLE]
Source: https://freestatistics.org/blog/index.php?pk=160863&T=2

Globally Unique Identifier (entire table): ba.freestatistics.org/blog/index.php?pk=160863&T=2

As an alternative you can also use a QR Code:  

The GUIDs for individual cells are displayed in the table below:

Interpolation Forecasts of Exponential Smoothing
tObservedFittedResiduals
133770241487.9961256582-3785.99612565825
143036432384.2423306442-2020.24233064425
153260934048.8239474299-1439.82394742995
163021230953.0817784332-741.081778433225
172996530167.1615625255-202.161562525485
182835228194.2876712476157.712328752361
192581422076.54434447443737.45565552559
202241420801.92075326851612.07924673147
212050621128.7820231163-622.782023116299
222880626754.52591915812051.47408084186
232222822076.0673309998151.932669000234
241397113470.8643970093500.135602990666
253684537059.4733194597-214.473319459685
263533829795.48397040955542.51602959053
273502233348.72441949351673.27558050646
283477731163.74413083353613.25586916654
292688731542.0186569764-4655.01865697637
302397028668.3449958547-4698.34499585466
312278022752.225994222927.7740057771371
321735120061.3545527706-2710.35455277056
332138218709.0425300732672.95746992701
342456125498.9960342697-937.996034269712
351740920022.1189854636-2613.11898546363
361151411945.6711210862-431.671121086232
373151431811.1427395255-297.14273952548
382707127135.2239715721-64.2239715721189
392946227863.0241804421598.975819558
402610526585.9480635962-480.948063596174
412239723768.4474504742-1371.44745047418
422384321869.56385517791973.43614482211
432170519509.10820626692195.89179373314
441808916761.28097596471327.71902403528
452076418040.74222789112723.25777210893
462531623196.82850721112119.17149278885
471770418102.3007276653-398.300727665312
481554811461.22353787064086.77646212937
492802933585.8002125519-5556.80021255188
502938327714.04861898321668.95138101676
513643829460.21037802626977.78962197377
523203428524.13301245523509.8669875448
532267925984.1070779224-3305.1070779224
542431924768.3603312258-449.360331225813
551800421738.5190502803-3734.51905028026
561753717326.1475284396210.852471560382
572036618790.7238567431575.27614325702
582278223364.3485694359-582.348569435911
591916917096.14672940742072.85327059258
601380712536.44630626091270.55369373915
612974329375.0615334885367.938466511536
622559127375.1673514976-1784.16735149756
632909629845.1799392545-749.179939254514
642648226329.5061513019152.493848698105
652240521403.18892294961001.81107705045
662704422062.65158253584981.3484174642
671797019291.1739870878-1321.17398708778
681873016843.79259252211886.20740747787
691968419125.9670975998558.032902400162
701978522648.0790967229-2863.07909672288
711847916985.57738857341493.42261142662
721069812280.7803828333-1582.7803828333


Extrapolation Forecasts of Exponential Smoothing
tForecast95% Lower Bound95% Upper Bound
7326498.981865146723698.880672307929299.0830579855
7423934.863394319820956.288363424626913.4384252151
7526836.693618630123556.492578443930116.8946588164
7624042.233314808220686.84160915827397.6250204585
7719769.007584474116442.310680405623095.7044885427
7821288.456756200617662.497386315624914.4161260857
7916072.176615047712656.443904700219487.9093253952
8015124.888989784811597.600805593818652.1771739758
8116273.780768290512429.524494839620118.0370417413
8218070.926523694613805.659849379922336.1931980093
8315008.434190426311001.710892853519015.157487999
849842.625886158477798.8339209974411886.4178513195

\begin{tabular}{lllllllll}
\hline
Extrapolation Forecasts of Exponential Smoothing \tabularnewline
t & Forecast & 95% Lower Bound & 95% Upper Bound \tabularnewline
73 & 26498.9818651467 & 23698.8806723079 & 29299.0830579855 \tabularnewline
74 & 23934.8633943198 & 20956.2883634246 & 26913.4384252151 \tabularnewline
75 & 26836.6936186301 & 23556.4925784439 & 30116.8946588164 \tabularnewline
76 & 24042.2333148082 & 20686.841609158 & 27397.6250204585 \tabularnewline
77 & 19769.0075844741 & 16442.3106804056 & 23095.7044885427 \tabularnewline
78 & 21288.4567562006 & 17662.4973863156 & 24914.4161260857 \tabularnewline
79 & 16072.1766150477 & 12656.4439047002 & 19487.9093253952 \tabularnewline
80 & 15124.8889897848 & 11597.6008055938 & 18652.1771739758 \tabularnewline
81 & 16273.7807682905 & 12429.5244948396 & 20118.0370417413 \tabularnewline
82 & 18070.9265236946 & 13805.6598493799 & 22336.1931980093 \tabularnewline
83 & 15008.4341904263 & 11001.7108928535 & 19015.157487999 \tabularnewline
84 & 9842.62588615847 & 7798.83392099744 & 11886.4178513195 \tabularnewline
\hline
\end{tabular}
%Source: https://freestatistics.org/blog/index.php?pk=160863&T=3

[TABLE]
[ROW][C]Extrapolation Forecasts of Exponential Smoothing[/C][/ROW]
[ROW][C]t[/C][C]Forecast[/C][C]95% Lower Bound[/C][C]95% Upper Bound[/C][/ROW]
[ROW][C]73[/C][C]26498.9818651467[/C][C]23698.8806723079[/C][C]29299.0830579855[/C][/ROW]
[ROW][C]74[/C][C]23934.8633943198[/C][C]20956.2883634246[/C][C]26913.4384252151[/C][/ROW]
[ROW][C]75[/C][C]26836.6936186301[/C][C]23556.4925784439[/C][C]30116.8946588164[/C][/ROW]
[ROW][C]76[/C][C]24042.2333148082[/C][C]20686.841609158[/C][C]27397.6250204585[/C][/ROW]
[ROW][C]77[/C][C]19769.0075844741[/C][C]16442.3106804056[/C][C]23095.7044885427[/C][/ROW]
[ROW][C]78[/C][C]21288.4567562006[/C][C]17662.4973863156[/C][C]24914.4161260857[/C][/ROW]
[ROW][C]79[/C][C]16072.1766150477[/C][C]12656.4439047002[/C][C]19487.9093253952[/C][/ROW]
[ROW][C]80[/C][C]15124.8889897848[/C][C]11597.6008055938[/C][C]18652.1771739758[/C][/ROW]
[ROW][C]81[/C][C]16273.7807682905[/C][C]12429.5244948396[/C][C]20118.0370417413[/C][/ROW]
[ROW][C]82[/C][C]18070.9265236946[/C][C]13805.6598493799[/C][C]22336.1931980093[/C][/ROW]
[ROW][C]83[/C][C]15008.4341904263[/C][C]11001.7108928535[/C][C]19015.157487999[/C][/ROW]
[ROW][C]84[/C][C]9842.62588615847[/C][C]7798.83392099744[/C][C]11886.4178513195[/C][/ROW]
[/TABLE]
Source: https://freestatistics.org/blog/index.php?pk=160863&T=3

Globally Unique Identifier (entire table): ba.freestatistics.org/blog/index.php?pk=160863&T=3

As an alternative you can also use a QR Code:  

The GUIDs for individual cells are displayed in the table below:

Extrapolation Forecasts of Exponential Smoothing
tForecast95% Lower Bound95% Upper Bound
7326498.981865146723698.880672307929299.0830579855
7423934.863394319820956.288363424626913.4384252151
7526836.693618630123556.492578443930116.8946588164
7624042.233314808220686.84160915827397.6250204585
7719769.007584474116442.310680405623095.7044885427
7821288.456756200617662.497386315624914.4161260857
7916072.176615047712656.443904700219487.9093253952
8015124.888989784811597.600805593818652.1771739758
8116273.780768290512429.524494839620118.0370417413
8218070.926523694613805.659849379922336.1931980093
8315008.434190426311001.710892853519015.157487999
849842.625886158477798.8339209974411886.4178513195


Parameters (Session):
par1 = 12 ; par2 = Triple ; par3 = multiplicative ;
Parameters (R input):
par1 = 12 ; par2 = Triple ; par3 = multiplicative ;
R code (references can be found in the software module):
par1 <- as.numeric(par1)
if (par2 == 'Single') K <- 1
if (par2 == 'Double') K <- 2
if (par2 == 'Triple') K <- par1
nx <- length(x)
nxmK <- nx - K
x <- ts(x, frequency = par1)
if (par2 == 'Single') fit <- HoltWinters(x, gamma=F, beta=F)
if (par2 == 'Double') fit <- HoltWinters(x, gamma=F)
if (par2 == 'Triple') fit <- HoltWinters(x, seasonal=par3)
fit
myresid <- x - fit$fitted[,'xhat']
bitmap(file='test1.png')
op <- par(mfrow=c(2,1))
plot(fit,ylab='Observed (black) / Fitted (red)',main='Interpolation Fit of Exponential Smoothing')
plot(myresid,ylab='Residuals',main='Interpolation Prediction Errors')
par(op)
dev.off()
bitmap(file='test2.png')
p <- predict(fit, par1, prediction.interval=TRUE)
np <- length(p[,1])
plot(fit,p,ylab='Observed (black) / Fitted (red)',main='Extrapolation Fit of Exponential Smoothing')
dev.off()
bitmap(file='test3.png')
op <- par(mfrow = c(2,2))
acf(as.numeric(myresid),lag.max = nx/2,main='Residual ACF')
spectrum(myresid,main='Residals Periodogram')
cpgram(myresid,main='Residal Cumulative Periodogram')
qqnorm(myresid,main='Residual Normal QQ Plot')
qqline(myresid)
par(op)
dev.off()
load(file='createtable')
a<-table.start()
a<-table.row.start(a)
a<-table.element(a,'Estimated Parameters of Exponential Smoothing',2,TRUE)
a<-table.row.end(a)
a<-table.row.start(a)
a<-table.element(a,'Parameter',header=TRUE)
a<-table.element(a,'Value',header=TRUE)
a<-table.row.end(a)
a<-table.row.start(a)
a<-table.element(a,'alpha',header=TRUE)
a<-table.element(a,fit$alpha)
a<-table.row.end(a)
a<-table.row.start(a)
a<-table.element(a,'beta',header=TRUE)
a<-table.element(a,fit$beta)
a<-table.row.end(a)
a<-table.row.start(a)
a<-table.element(a,'gamma',header=TRUE)
a<-table.element(a,fit$gamma)
a<-table.row.end(a)
a<-table.end(a)
table.save(a,file='mytable.tab')
a<-table.start()
a<-table.row.start(a)
a<-table.element(a,'Interpolation Forecasts of Exponential Smoothing',4,TRUE)
a<-table.row.end(a)
a<-table.row.start(a)
a<-table.element(a,'t',header=TRUE)
a<-table.element(a,'Observed',header=TRUE)
a<-table.element(a,'Fitted',header=TRUE)
a<-table.element(a,'Residuals',header=TRUE)
a<-table.row.end(a)
for (i in 1:nxmK) {
a<-table.row.start(a)
a<-table.element(a,i+K,header=TRUE)
a<-table.element(a,x[i+K])
a<-table.element(a,fit$fitted[i,'xhat'])
a<-table.element(a,myresid[i])
a<-table.row.end(a)
}
a<-table.end(a)
table.save(a,file='mytable1.tab')
a<-table.start()
a<-table.row.start(a)
a<-table.element(a,'Extrapolation Forecasts of Exponential Smoothing',4,TRUE)
a<-table.row.end(a)
a<-table.row.start(a)
a<-table.element(a,'t',header=TRUE)
a<-table.element(a,'Forecast',header=TRUE)
a<-table.element(a,'95% Lower Bound',header=TRUE)
a<-table.element(a,'95% Upper Bound',header=TRUE)
a<-table.row.end(a)
for (i in 1:np) {
a<-table.row.start(a)
a<-table.element(a,nx+i,header=TRUE)
a<-table.element(a,p[i,'fit'])
a<-table.element(a,p[i,'lwr'])
a<-table.element(a,p[i,'upr'])
a<-table.row.end(a)
}
a<-table.end(a)
table.save(a,file='mytable2.tab')