Free Statistics

of Irreproducible Research!

Author's title

Author*Unverified author*
R Software Modulerwasp_autocorrelation.wasp
Title produced by software(Partial) Autocorrelation Function
Date of computationSun, 17 Aug 2014 23:50:14 +0100
Cite this page as followsStatistical Computations at FreeStatistics.org, Office for Research Development and Education, URL https://freestatistics.org/blog/index.php?v=date/2014/Aug/17/t1408315861a1ka2tvhzfqzq88.htm/, Retrieved Thu, 31 Oct 2024 22:52:06 +0000
Statistical Computations at FreeStatistics.org, Office for Research Development and Education, URL https://freestatistics.org/blog/index.php?pk=235655, Retrieved Thu, 31 Oct 2024 22:52:06 +0000
QR Codes:

Original text written by user:
IsPrivate?No (this computation is public)
User-defined keywords
Estimated Impact156
Family? (F = Feedback message, R = changed R code, M = changed R Module, P = changed Parameters, D = changed Data)
-       [(Partial) Autocorrelation Function] [] [2014-08-17 22:50:14] [d41d8cd98f00b204e9800998ecf8427e] [Current]
Feedback Forum

Post a new message
Dataseries X:
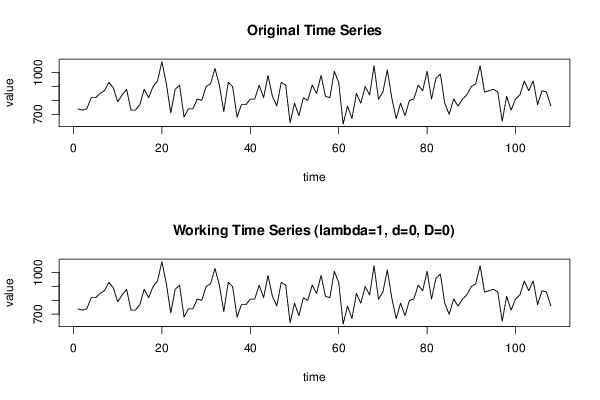
740
730
740
820
820
850
870
930
890
790
840
880
730
730
770
880
820
900
940
1080
920
710
880
910
680
740
740
810
800
900
920
1030
910
720
930
900
680
770
770
810
810
910
820
980
830
760
930
910
640
780
690
820
800
910
850
980
830
820
1010
930
630
760
670
850
780
900
840
1050
810
860
1020
820
670
780
690
800
810
910
870
1010
810
960
990
780
700
810
760
810
840
900
920
1050
860
870
880
860
650
830
730
810
840
940
870
940
770
870
860
760


Summary of computational transaction
Raw Inputview raw input (R code)
Raw Outputview raw output of R engine
Computing time2 seconds
R Server'Sir Maurice George Kendall' @ kendall.wessa.net

\begin{tabular}{lllllllll}
\hline
Summary of computational transaction \tabularnewline
Raw Input & view raw input (R code)  \tabularnewline
Raw Output & view raw output of R engine  \tabularnewline
Computing time & 2 seconds \tabularnewline
R Server & 'Sir Maurice George Kendall' @ kendall.wessa.net \tabularnewline
\hline
\end{tabular}
%Source: https://freestatistics.org/blog/index.php?pk=235655&T=0

[TABLE]
[ROW][C]Summary of computational transaction[/C][/ROW]
[ROW][C]Raw Input[/C][C]view raw input (R code) [/C][/ROW]
[ROW][C]Raw Output[/C][C]view raw output of R engine [/C][/ROW]
[ROW][C]Computing time[/C][C]2 seconds[/C][/ROW]
[ROW][C]R Server[/C][C]'Sir Maurice George Kendall' @ kendall.wessa.net[/C][/ROW]
[/TABLE]
Source: https://freestatistics.org/blog/index.php?pk=235655&T=0

Globally Unique Identifier (entire table): ba.freestatistics.org/blog/index.php?pk=235655&T=0

As an alternative you can also use a QR Code:  

The GUIDs for individual cells are displayed in the table below:

Summary of computational transaction
Raw Inputview raw input (R code)
Raw Outputview raw output of R engine
Computing time2 seconds
R Server'Sir Maurice George Kendall' @ kendall.wessa.net


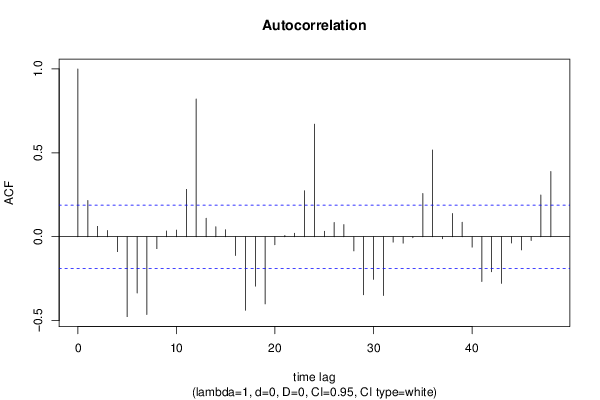
Autocorrelation Function
Time lag kACF(k)T-STATP-value
10.2163352.24820.013297
20.0617890.64210.261075
30.0368240.38270.351352
4-0.089052-0.92550.178397
5-0.476578-4.95271e-06
6-0.33515-3.4830.000359
7-0.463332-4.81512e-06
8-0.070998-0.73780.231108
90.0340770.35410.361963
100.0391970.40730.342279
110.2822982.93370.002045
120.8207388.52940
130.1099761.14290.127803
140.0591880.61510.269891
150.0414780.43110.333643
16-0.112274-1.16680.122934
17-0.438429-4.55637e-06
18-0.294879-3.06450.001377
19-0.400353-4.16063.2e-05
20-0.048196-0.50090.30874
210.0067940.07060.471922
220.0203590.21160.416418
230.2742952.85060.002614
240.6709416.97260
250.0322360.3350.369134
260.084380.87690.191243
270.072030.74860.227874
28-0.084614-0.87930.190587
29-0.346182-3.59760.000243
30-0.254374-2.64350.004713
31-0.350778-3.64540.000206
32-0.032303-0.33570.368872
33-0.038473-0.39980.345039
34-0.00658-0.06840.472806
350.2572762.67370.004333
360.5169625.37240
37-0.012334-0.12820.449124
380.1388041.44250.076028
390.0864480.89840.185486
40-0.062164-0.6460.259815
41-0.267009-2.77480.003255
42-0.209317-2.17530.015894
43-0.27844-2.89360.002304
44-0.037872-0.39360.347334
45-0.078543-0.81620.208078
46-0.022497-0.23380.407794
470.2484182.58160.005587
480.3884064.03645.1e-05

\begin{tabular}{lllllllll}
\hline
Autocorrelation Function \tabularnewline
Time lag k & ACF(k) & T-STAT & P-value \tabularnewline
1 & 0.216335 & 2.2482 & 0.013297 \tabularnewline
2 & 0.061789 & 0.6421 & 0.261075 \tabularnewline
3 & 0.036824 & 0.3827 & 0.351352 \tabularnewline
4 & -0.089052 & -0.9255 & 0.178397 \tabularnewline
5 & -0.476578 & -4.9527 & 1e-06 \tabularnewline
6 & -0.33515 & -3.483 & 0.000359 \tabularnewline
7 & -0.463332 & -4.8151 & 2e-06 \tabularnewline
8 & -0.070998 & -0.7378 & 0.231108 \tabularnewline
9 & 0.034077 & 0.3541 & 0.361963 \tabularnewline
10 & 0.039197 & 0.4073 & 0.342279 \tabularnewline
11 & 0.282298 & 2.9337 & 0.002045 \tabularnewline
12 & 0.820738 & 8.5294 & 0 \tabularnewline
13 & 0.109976 & 1.1429 & 0.127803 \tabularnewline
14 & 0.059188 & 0.6151 & 0.269891 \tabularnewline
15 & 0.041478 & 0.4311 & 0.333643 \tabularnewline
16 & -0.112274 & -1.1668 & 0.122934 \tabularnewline
17 & -0.438429 & -4.5563 & 7e-06 \tabularnewline
18 & -0.294879 & -3.0645 & 0.001377 \tabularnewline
19 & -0.400353 & -4.1606 & 3.2e-05 \tabularnewline
20 & -0.048196 & -0.5009 & 0.30874 \tabularnewline
21 & 0.006794 & 0.0706 & 0.471922 \tabularnewline
22 & 0.020359 & 0.2116 & 0.416418 \tabularnewline
23 & 0.274295 & 2.8506 & 0.002614 \tabularnewline
24 & 0.670941 & 6.9726 & 0 \tabularnewline
25 & 0.032236 & 0.335 & 0.369134 \tabularnewline
26 & 0.08438 & 0.8769 & 0.191243 \tabularnewline
27 & 0.07203 & 0.7486 & 0.227874 \tabularnewline
28 & -0.084614 & -0.8793 & 0.190587 \tabularnewline
29 & -0.346182 & -3.5976 & 0.000243 \tabularnewline
30 & -0.254374 & -2.6435 & 0.004713 \tabularnewline
31 & -0.350778 & -3.6454 & 0.000206 \tabularnewline
32 & -0.032303 & -0.3357 & 0.368872 \tabularnewline
33 & -0.038473 & -0.3998 & 0.345039 \tabularnewline
34 & -0.00658 & -0.0684 & 0.472806 \tabularnewline
35 & 0.257276 & 2.6737 & 0.004333 \tabularnewline
36 & 0.516962 & 5.3724 & 0 \tabularnewline
37 & -0.012334 & -0.1282 & 0.449124 \tabularnewline
38 & 0.138804 & 1.4425 & 0.076028 \tabularnewline
39 & 0.086448 & 0.8984 & 0.185486 \tabularnewline
40 & -0.062164 & -0.646 & 0.259815 \tabularnewline
41 & -0.267009 & -2.7748 & 0.003255 \tabularnewline
42 & -0.209317 & -2.1753 & 0.015894 \tabularnewline
43 & -0.27844 & -2.8936 & 0.002304 \tabularnewline
44 & -0.037872 & -0.3936 & 0.347334 \tabularnewline
45 & -0.078543 & -0.8162 & 0.208078 \tabularnewline
46 & -0.022497 & -0.2338 & 0.407794 \tabularnewline
47 & 0.248418 & 2.5816 & 0.005587 \tabularnewline
48 & 0.388406 & 4.0364 & 5.1e-05 \tabularnewline
\hline
\end{tabular}
%Source: https://freestatistics.org/blog/index.php?pk=235655&T=1

[TABLE]
[ROW][C]Autocorrelation Function[/C][/ROW]
[ROW][C]Time lag k[/C][C]ACF(k)[/C][C]T-STAT[/C][C]P-value[/C][/ROW]
[ROW][C]1[/C][C]0.216335[/C][C]2.2482[/C][C]0.013297[/C][/ROW]
[ROW][C]2[/C][C]0.061789[/C][C]0.6421[/C][C]0.261075[/C][/ROW]
[ROW][C]3[/C][C]0.036824[/C][C]0.3827[/C][C]0.351352[/C][/ROW]
[ROW][C]4[/C][C]-0.089052[/C][C]-0.9255[/C][C]0.178397[/C][/ROW]
[ROW][C]5[/C][C]-0.476578[/C][C]-4.9527[/C][C]1e-06[/C][/ROW]
[ROW][C]6[/C][C]-0.33515[/C][C]-3.483[/C][C]0.000359[/C][/ROW]
[ROW][C]7[/C][C]-0.463332[/C][C]-4.8151[/C][C]2e-06[/C][/ROW]
[ROW][C]8[/C][C]-0.070998[/C][C]-0.7378[/C][C]0.231108[/C][/ROW]
[ROW][C]9[/C][C]0.034077[/C][C]0.3541[/C][C]0.361963[/C][/ROW]
[ROW][C]10[/C][C]0.039197[/C][C]0.4073[/C][C]0.342279[/C][/ROW]
[ROW][C]11[/C][C]0.282298[/C][C]2.9337[/C][C]0.002045[/C][/ROW]
[ROW][C]12[/C][C]0.820738[/C][C]8.5294[/C][C]0[/C][/ROW]
[ROW][C]13[/C][C]0.109976[/C][C]1.1429[/C][C]0.127803[/C][/ROW]
[ROW][C]14[/C][C]0.059188[/C][C]0.6151[/C][C]0.269891[/C][/ROW]
[ROW][C]15[/C][C]0.041478[/C][C]0.4311[/C][C]0.333643[/C][/ROW]
[ROW][C]16[/C][C]-0.112274[/C][C]-1.1668[/C][C]0.122934[/C][/ROW]
[ROW][C]17[/C][C]-0.438429[/C][C]-4.5563[/C][C]7e-06[/C][/ROW]
[ROW][C]18[/C][C]-0.294879[/C][C]-3.0645[/C][C]0.001377[/C][/ROW]
[ROW][C]19[/C][C]-0.400353[/C][C]-4.1606[/C][C]3.2e-05[/C][/ROW]
[ROW][C]20[/C][C]-0.048196[/C][C]-0.5009[/C][C]0.30874[/C][/ROW]
[ROW][C]21[/C][C]0.006794[/C][C]0.0706[/C][C]0.471922[/C][/ROW]
[ROW][C]22[/C][C]0.020359[/C][C]0.2116[/C][C]0.416418[/C][/ROW]
[ROW][C]23[/C][C]0.274295[/C][C]2.8506[/C][C]0.002614[/C][/ROW]
[ROW][C]24[/C][C]0.670941[/C][C]6.9726[/C][C]0[/C][/ROW]
[ROW][C]25[/C][C]0.032236[/C][C]0.335[/C][C]0.369134[/C][/ROW]
[ROW][C]26[/C][C]0.08438[/C][C]0.8769[/C][C]0.191243[/C][/ROW]
[ROW][C]27[/C][C]0.07203[/C][C]0.7486[/C][C]0.227874[/C][/ROW]
[ROW][C]28[/C][C]-0.084614[/C][C]-0.8793[/C][C]0.190587[/C][/ROW]
[ROW][C]29[/C][C]-0.346182[/C][C]-3.5976[/C][C]0.000243[/C][/ROW]
[ROW][C]30[/C][C]-0.254374[/C][C]-2.6435[/C][C]0.004713[/C][/ROW]
[ROW][C]31[/C][C]-0.350778[/C][C]-3.6454[/C][C]0.000206[/C][/ROW]
[ROW][C]32[/C][C]-0.032303[/C][C]-0.3357[/C][C]0.368872[/C][/ROW]
[ROW][C]33[/C][C]-0.038473[/C][C]-0.3998[/C][C]0.345039[/C][/ROW]
[ROW][C]34[/C][C]-0.00658[/C][C]-0.0684[/C][C]0.472806[/C][/ROW]
[ROW][C]35[/C][C]0.257276[/C][C]2.6737[/C][C]0.004333[/C][/ROW]
[ROW][C]36[/C][C]0.516962[/C][C]5.3724[/C][C]0[/C][/ROW]
[ROW][C]37[/C][C]-0.012334[/C][C]-0.1282[/C][C]0.449124[/C][/ROW]
[ROW][C]38[/C][C]0.138804[/C][C]1.4425[/C][C]0.076028[/C][/ROW]
[ROW][C]39[/C][C]0.086448[/C][C]0.8984[/C][C]0.185486[/C][/ROW]
[ROW][C]40[/C][C]-0.062164[/C][C]-0.646[/C][C]0.259815[/C][/ROW]
[ROW][C]41[/C][C]-0.267009[/C][C]-2.7748[/C][C]0.003255[/C][/ROW]
[ROW][C]42[/C][C]-0.209317[/C][C]-2.1753[/C][C]0.015894[/C][/ROW]
[ROW][C]43[/C][C]-0.27844[/C][C]-2.8936[/C][C]0.002304[/C][/ROW]
[ROW][C]44[/C][C]-0.037872[/C][C]-0.3936[/C][C]0.347334[/C][/ROW]
[ROW][C]45[/C][C]-0.078543[/C][C]-0.8162[/C][C]0.208078[/C][/ROW]
[ROW][C]46[/C][C]-0.022497[/C][C]-0.2338[/C][C]0.407794[/C][/ROW]
[ROW][C]47[/C][C]0.248418[/C][C]2.5816[/C][C]0.005587[/C][/ROW]
[ROW][C]48[/C][C]0.388406[/C][C]4.0364[/C][C]5.1e-05[/C][/ROW]
[/TABLE]
Source: https://freestatistics.org/blog/index.php?pk=235655&T=1

Globally Unique Identifier (entire table): ba.freestatistics.org/blog/index.php?pk=235655&T=1

As an alternative you can also use a QR Code:  

The GUIDs for individual cells are displayed in the table below:

Autocorrelation Function
Time lag kACF(k)T-STATP-value
10.2163352.24820.013297
20.0617890.64210.261075
30.0368240.38270.351352
4-0.089052-0.92550.178397
5-0.476578-4.95271e-06
6-0.33515-3.4830.000359
7-0.463332-4.81512e-06
8-0.070998-0.73780.231108
90.0340770.35410.361963
100.0391970.40730.342279
110.2822982.93370.002045
120.8207388.52940
130.1099761.14290.127803
140.0591880.61510.269891
150.0414780.43110.333643
16-0.112274-1.16680.122934
17-0.438429-4.55637e-06
18-0.294879-3.06450.001377
19-0.400353-4.16063.2e-05
20-0.048196-0.50090.30874
210.0067940.07060.471922
220.0203590.21160.416418
230.2742952.85060.002614
240.6709416.97260
250.0322360.3350.369134
260.084380.87690.191243
270.072030.74860.227874
28-0.084614-0.87930.190587
29-0.346182-3.59760.000243
30-0.254374-2.64350.004713
31-0.350778-3.64540.000206
32-0.032303-0.33570.368872
33-0.038473-0.39980.345039
34-0.00658-0.06840.472806
350.2572762.67370.004333
360.5169625.37240
37-0.012334-0.12820.449124
380.1388041.44250.076028
390.0864480.89840.185486
40-0.062164-0.6460.259815
41-0.267009-2.77480.003255
42-0.209317-2.17530.015894
43-0.27844-2.89360.002304
44-0.037872-0.39360.347334
45-0.078543-0.81620.208078
46-0.022497-0.23380.407794
470.2484182.58160.005587
480.3884064.03645.1e-05


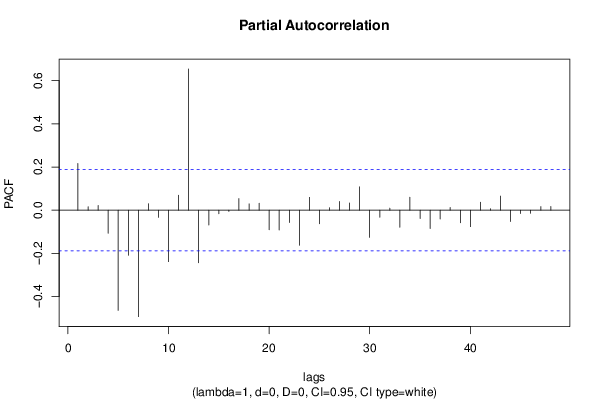
Partial Autocorrelation Function
Time lag kPACF(k)T-STATP-value
10.2163352.24820.013297
20.0157240.16340.435251
30.0212660.2210.412754
4-0.107264-1.11470.133721
5-0.46456-4.82782e-06
6-0.209163-2.17370.015956
7-0.493513-5.12871e-06
80.0300620.31240.377664
9-0.033512-0.34830.364159
10-0.238644-2.48010.00734
110.0694360.72160.236051
120.6544046.80080
13-0.243758-2.53320.006369
14-0.06847-0.71160.239135
15-0.016448-0.17090.4323
16-0.005555-0.05770.477036
170.0534730.55570.289779
180.0292090.30350.381029
190.0320930.33350.369695
20-0.090721-0.94280.173943
21-0.09171-0.95310.17134
22-0.05714-0.59380.276939
23-0.162996-1.69390.046583
240.0592780.6160.269583
25-0.062768-0.65230.257796
260.0112060.11650.453755
270.0403520.41930.337898
280.0334890.3480.36425
290.1078261.12060.132479
30-0.126148-1.3110.096325
31-0.03329-0.3460.365021
320.0093060.09670.461569
33-0.079428-0.82540.205472
340.0597210.62060.268071
35-0.038944-0.40470.343243
36-0.084746-0.88070.190215
37-0.041004-0.42610.335431
380.0121360.12610.449935
39-0.058512-0.60810.272208
40-0.076501-0.7950.214174
410.0365530.37990.352396
420.0064160.06670.473483
430.0651060.67660.250054
44-0.052484-0.54540.293292
45-0.015873-0.1650.434643
46-0.014132-0.14690.441756
470.0163940.17040.432517
480.0169790.17650.430134

\begin{tabular}{lllllllll}
\hline
Partial Autocorrelation Function \tabularnewline
Time lag k & PACF(k) & T-STAT & P-value \tabularnewline
1 & 0.216335 & 2.2482 & 0.013297 \tabularnewline
2 & 0.015724 & 0.1634 & 0.435251 \tabularnewline
3 & 0.021266 & 0.221 & 0.412754 \tabularnewline
4 & -0.107264 & -1.1147 & 0.133721 \tabularnewline
5 & -0.46456 & -4.8278 & 2e-06 \tabularnewline
6 & -0.209163 & -2.1737 & 0.015956 \tabularnewline
7 & -0.493513 & -5.1287 & 1e-06 \tabularnewline
8 & 0.030062 & 0.3124 & 0.377664 \tabularnewline
9 & -0.033512 & -0.3483 & 0.364159 \tabularnewline
10 & -0.238644 & -2.4801 & 0.00734 \tabularnewline
11 & 0.069436 & 0.7216 & 0.236051 \tabularnewline
12 & 0.654404 & 6.8008 & 0 \tabularnewline
13 & -0.243758 & -2.5332 & 0.006369 \tabularnewline
14 & -0.06847 & -0.7116 & 0.239135 \tabularnewline
15 & -0.016448 & -0.1709 & 0.4323 \tabularnewline
16 & -0.005555 & -0.0577 & 0.477036 \tabularnewline
17 & 0.053473 & 0.5557 & 0.289779 \tabularnewline
18 & 0.029209 & 0.3035 & 0.381029 \tabularnewline
19 & 0.032093 & 0.3335 & 0.369695 \tabularnewline
20 & -0.090721 & -0.9428 & 0.173943 \tabularnewline
21 & -0.09171 & -0.9531 & 0.17134 \tabularnewline
22 & -0.05714 & -0.5938 & 0.276939 \tabularnewline
23 & -0.162996 & -1.6939 & 0.046583 \tabularnewline
24 & 0.059278 & 0.616 & 0.269583 \tabularnewline
25 & -0.062768 & -0.6523 & 0.257796 \tabularnewline
26 & 0.011206 & 0.1165 & 0.453755 \tabularnewline
27 & 0.040352 & 0.4193 & 0.337898 \tabularnewline
28 & 0.033489 & 0.348 & 0.36425 \tabularnewline
29 & 0.107826 & 1.1206 & 0.132479 \tabularnewline
30 & -0.126148 & -1.311 & 0.096325 \tabularnewline
31 & -0.03329 & -0.346 & 0.365021 \tabularnewline
32 & 0.009306 & 0.0967 & 0.461569 \tabularnewline
33 & -0.079428 & -0.8254 & 0.205472 \tabularnewline
34 & 0.059721 & 0.6206 & 0.268071 \tabularnewline
35 & -0.038944 & -0.4047 & 0.343243 \tabularnewline
36 & -0.084746 & -0.8807 & 0.190215 \tabularnewline
37 & -0.041004 & -0.4261 & 0.335431 \tabularnewline
38 & 0.012136 & 0.1261 & 0.449935 \tabularnewline
39 & -0.058512 & -0.6081 & 0.272208 \tabularnewline
40 & -0.076501 & -0.795 & 0.214174 \tabularnewline
41 & 0.036553 & 0.3799 & 0.352396 \tabularnewline
42 & 0.006416 & 0.0667 & 0.473483 \tabularnewline
43 & 0.065106 & 0.6766 & 0.250054 \tabularnewline
44 & -0.052484 & -0.5454 & 0.293292 \tabularnewline
45 & -0.015873 & -0.165 & 0.434643 \tabularnewline
46 & -0.014132 & -0.1469 & 0.441756 \tabularnewline
47 & 0.016394 & 0.1704 & 0.432517 \tabularnewline
48 & 0.016979 & 0.1765 & 0.430134 \tabularnewline
\hline
\end{tabular}
%Source: https://freestatistics.org/blog/index.php?pk=235655&T=2

[TABLE]
[ROW][C]Partial Autocorrelation Function[/C][/ROW]
[ROW][C]Time lag k[/C][C]PACF(k)[/C][C]T-STAT[/C][C]P-value[/C][/ROW]
[ROW][C]1[/C][C]0.216335[/C][C]2.2482[/C][C]0.013297[/C][/ROW]
[ROW][C]2[/C][C]0.015724[/C][C]0.1634[/C][C]0.435251[/C][/ROW]
[ROW][C]3[/C][C]0.021266[/C][C]0.221[/C][C]0.412754[/C][/ROW]
[ROW][C]4[/C][C]-0.107264[/C][C]-1.1147[/C][C]0.133721[/C][/ROW]
[ROW][C]5[/C][C]-0.46456[/C][C]-4.8278[/C][C]2e-06[/C][/ROW]
[ROW][C]6[/C][C]-0.209163[/C][C]-2.1737[/C][C]0.015956[/C][/ROW]
[ROW][C]7[/C][C]-0.493513[/C][C]-5.1287[/C][C]1e-06[/C][/ROW]
[ROW][C]8[/C][C]0.030062[/C][C]0.3124[/C][C]0.377664[/C][/ROW]
[ROW][C]9[/C][C]-0.033512[/C][C]-0.3483[/C][C]0.364159[/C][/ROW]
[ROW][C]10[/C][C]-0.238644[/C][C]-2.4801[/C][C]0.00734[/C][/ROW]
[ROW][C]11[/C][C]0.069436[/C][C]0.7216[/C][C]0.236051[/C][/ROW]
[ROW][C]12[/C][C]0.654404[/C][C]6.8008[/C][C]0[/C][/ROW]
[ROW][C]13[/C][C]-0.243758[/C][C]-2.5332[/C][C]0.006369[/C][/ROW]
[ROW][C]14[/C][C]-0.06847[/C][C]-0.7116[/C][C]0.239135[/C][/ROW]
[ROW][C]15[/C][C]-0.016448[/C][C]-0.1709[/C][C]0.4323[/C][/ROW]
[ROW][C]16[/C][C]-0.005555[/C][C]-0.0577[/C][C]0.477036[/C][/ROW]
[ROW][C]17[/C][C]0.053473[/C][C]0.5557[/C][C]0.289779[/C][/ROW]
[ROW][C]18[/C][C]0.029209[/C][C]0.3035[/C][C]0.381029[/C][/ROW]
[ROW][C]19[/C][C]0.032093[/C][C]0.3335[/C][C]0.369695[/C][/ROW]
[ROW][C]20[/C][C]-0.090721[/C][C]-0.9428[/C][C]0.173943[/C][/ROW]
[ROW][C]21[/C][C]-0.09171[/C][C]-0.9531[/C][C]0.17134[/C][/ROW]
[ROW][C]22[/C][C]-0.05714[/C][C]-0.5938[/C][C]0.276939[/C][/ROW]
[ROW][C]23[/C][C]-0.162996[/C][C]-1.6939[/C][C]0.046583[/C][/ROW]
[ROW][C]24[/C][C]0.059278[/C][C]0.616[/C][C]0.269583[/C][/ROW]
[ROW][C]25[/C][C]-0.062768[/C][C]-0.6523[/C][C]0.257796[/C][/ROW]
[ROW][C]26[/C][C]0.011206[/C][C]0.1165[/C][C]0.453755[/C][/ROW]
[ROW][C]27[/C][C]0.040352[/C][C]0.4193[/C][C]0.337898[/C][/ROW]
[ROW][C]28[/C][C]0.033489[/C][C]0.348[/C][C]0.36425[/C][/ROW]
[ROW][C]29[/C][C]0.107826[/C][C]1.1206[/C][C]0.132479[/C][/ROW]
[ROW][C]30[/C][C]-0.126148[/C][C]-1.311[/C][C]0.096325[/C][/ROW]
[ROW][C]31[/C][C]-0.03329[/C][C]-0.346[/C][C]0.365021[/C][/ROW]
[ROW][C]32[/C][C]0.009306[/C][C]0.0967[/C][C]0.461569[/C][/ROW]
[ROW][C]33[/C][C]-0.079428[/C][C]-0.8254[/C][C]0.205472[/C][/ROW]
[ROW][C]34[/C][C]0.059721[/C][C]0.6206[/C][C]0.268071[/C][/ROW]
[ROW][C]35[/C][C]-0.038944[/C][C]-0.4047[/C][C]0.343243[/C][/ROW]
[ROW][C]36[/C][C]-0.084746[/C][C]-0.8807[/C][C]0.190215[/C][/ROW]
[ROW][C]37[/C][C]-0.041004[/C][C]-0.4261[/C][C]0.335431[/C][/ROW]
[ROW][C]38[/C][C]0.012136[/C][C]0.1261[/C][C]0.449935[/C][/ROW]
[ROW][C]39[/C][C]-0.058512[/C][C]-0.6081[/C][C]0.272208[/C][/ROW]
[ROW][C]40[/C][C]-0.076501[/C][C]-0.795[/C][C]0.214174[/C][/ROW]
[ROW][C]41[/C][C]0.036553[/C][C]0.3799[/C][C]0.352396[/C][/ROW]
[ROW][C]42[/C][C]0.006416[/C][C]0.0667[/C][C]0.473483[/C][/ROW]
[ROW][C]43[/C][C]0.065106[/C][C]0.6766[/C][C]0.250054[/C][/ROW]
[ROW][C]44[/C][C]-0.052484[/C][C]-0.5454[/C][C]0.293292[/C][/ROW]
[ROW][C]45[/C][C]-0.015873[/C][C]-0.165[/C][C]0.434643[/C][/ROW]
[ROW][C]46[/C][C]-0.014132[/C][C]-0.1469[/C][C]0.441756[/C][/ROW]
[ROW][C]47[/C][C]0.016394[/C][C]0.1704[/C][C]0.432517[/C][/ROW]
[ROW][C]48[/C][C]0.016979[/C][C]0.1765[/C][C]0.430134[/C][/ROW]
[/TABLE]
Source: https://freestatistics.org/blog/index.php?pk=235655&T=2

Globally Unique Identifier (entire table): ba.freestatistics.org/blog/index.php?pk=235655&T=2

As an alternative you can also use a QR Code:  

The GUIDs for individual cells are displayed in the table below:

Partial Autocorrelation Function
Time lag kPACF(k)T-STATP-value
10.2163352.24820.013297
20.0157240.16340.435251
30.0212660.2210.412754
4-0.107264-1.11470.133721
5-0.46456-4.82782e-06
6-0.209163-2.17370.015956
7-0.493513-5.12871e-06
80.0300620.31240.377664
9-0.033512-0.34830.364159
10-0.238644-2.48010.00734
110.0694360.72160.236051
120.6544046.80080
13-0.243758-2.53320.006369
14-0.06847-0.71160.239135
15-0.016448-0.17090.4323
16-0.005555-0.05770.477036
170.0534730.55570.289779
180.0292090.30350.381029
190.0320930.33350.369695
20-0.090721-0.94280.173943
21-0.09171-0.95310.17134
22-0.05714-0.59380.276939
23-0.162996-1.69390.046583
240.0592780.6160.269583
25-0.062768-0.65230.257796
260.0112060.11650.453755
270.0403520.41930.337898
280.0334890.3480.36425
290.1078261.12060.132479
30-0.126148-1.3110.096325
31-0.03329-0.3460.365021
320.0093060.09670.461569
33-0.079428-0.82540.205472
340.0597210.62060.268071
35-0.038944-0.40470.343243
36-0.084746-0.88070.190215
37-0.041004-0.42610.335431
380.0121360.12610.449935
39-0.058512-0.60810.272208
40-0.076501-0.7950.214174
410.0365530.37990.352396
420.0064160.06670.473483
430.0651060.67660.250054
44-0.052484-0.54540.293292
45-0.015873-0.1650.434643
46-0.014132-0.14690.441756
470.0163940.17040.432517
480.0169790.17650.430134


Parameters (Session):
par1 = 48 ; par2 = 1 ; par3 = 0 ; par4 = 0 ; par5 = 12 ; par6 = White Noise ; par7 = 0.95 ;
Parameters (R input):
par1 = 48 ; par2 = 1 ; par3 = 0 ; par4 = 0 ; par5 = 12 ; par6 = White Noise ; par7 = 0.95 ; par8 = ;
R code (references can be found in the software module):
if (par1 == 'Default') {
par1 = 10*log10(length(x))
} else {
par1 <- as.numeric(par1)
}
par2 <- as.numeric(par2)
par3 <- as.numeric(par3)
par4 <- as.numeric(par4)
par5 <- as.numeric(par5)
if (par6 == 'White Noise') par6 <- 'white' else par6 <- 'ma'
par7 <- as.numeric(par7)
if (par8 != '') par8 <- as.numeric(par8)
ox <- x
if (par8 == '') {
if (par2 == 0) {
x <- log(x)
} else {
x <- (x ^ par2 - 1) / par2
}
} else {
x <- log(x,base=par8)
}
if (par3 > 0) x <- diff(x,lag=1,difference=par3)
if (par4 > 0) x <- diff(x,lag=par5,difference=par4)
bitmap(file='picts.png')
op <- par(mfrow=c(2,1))
plot(ox,type='l',main='Original Time Series',xlab='time',ylab='value')
if (par8=='') {
mytitle <- paste('Working Time Series (lambda=',par2,', d=',par3,', D=',par4,')',sep='')
mysub <- paste('(lambda=',par2,', d=',par3,', D=',par4,', CI=', par7, ', CI type=',par6,')',sep='')
} else {
mytitle <- paste('Working Time Series (base=',par8,', d=',par3,', D=',par4,')',sep='')
mysub <- paste('(base=',par8,', d=',par3,', D=',par4,', CI=', par7, ', CI type=',par6,')',sep='')
}
plot(x,type='l', main=mytitle,xlab='time',ylab='value')
par(op)
dev.off()
bitmap(file='pic1.png')
racf <- acf(x, par1, main='Autocorrelation', xlab='time lag', ylab='ACF', ci.type=par6, ci=par7, sub=mysub)
dev.off()
bitmap(file='pic2.png')
rpacf <- pacf(x,par1,main='Partial Autocorrelation',xlab='lags',ylab='PACF',sub=mysub)
dev.off()
(myacf <- c(racf$acf))
(mypacf <- c(rpacf$acf))
lengthx <- length(x)
sqrtn <- sqrt(lengthx)
load(file='createtable')
a<-table.start()
a<-table.row.start(a)
a<-table.element(a,'Autocorrelation Function',4,TRUE)
a<-table.row.end(a)
a<-table.row.start(a)
a<-table.element(a,'Time lag k',header=TRUE)
a<-table.element(a,hyperlink('basics.htm','ACF(k)','click here for more information about the Autocorrelation Function'),header=TRUE)
a<-table.element(a,'T-STAT',header=TRUE)
a<-table.element(a,'P-value',header=TRUE)
a<-table.row.end(a)
for (i in 2:(par1+1)) {
a<-table.row.start(a)
a<-table.element(a,i-1,header=TRUE)
a<-table.element(a,round(myacf[i],6))
mytstat <- myacf[i]*sqrtn
a<-table.element(a,round(mytstat,4))
a<-table.element(a,round(1-pt(abs(mytstat),lengthx),6))
a<-table.row.end(a)
}
a<-table.end(a)
table.save(a,file='mytable.tab')
a<-table.start()
a<-table.row.start(a)
a<-table.element(a,'Partial Autocorrelation Function',4,TRUE)
a<-table.row.end(a)
a<-table.row.start(a)
a<-table.element(a,'Time lag k',header=TRUE)
a<-table.element(a,hyperlink('basics.htm','PACF(k)','click here for more information about the Partial Autocorrelation Function'),header=TRUE)
a<-table.element(a,'T-STAT',header=TRUE)
a<-table.element(a,'P-value',header=TRUE)
a<-table.row.end(a)
for (i in 1:par1) {
a<-table.row.start(a)
a<-table.element(a,i,header=TRUE)
a<-table.element(a,round(mypacf[i],6))
mytstat <- mypacf[i]*sqrtn
a<-table.element(a,round(mytstat,4))
a<-table.element(a,round(1-pt(abs(mytstat),lengthx),6))
a<-table.row.end(a)
}
a<-table.end(a)
table.save(a,file='mytable1.tab')