Free Statistics
of Irreproducible Research!
Description of Statistical Computation | ||||||||||||||||||||||||||||||
|---|---|---|---|---|---|---|---|---|---|---|---|---|---|---|---|---|---|---|---|---|---|---|---|---|---|---|---|---|---|---|
| Author's title | ||||||||||||||||||||||||||||||
| Author | *The author of this computation has been verified* | |||||||||||||||||||||||||||||
| R Software Module | rwasp_Distributional Plots.wasp | |||||||||||||||||||||||||||||
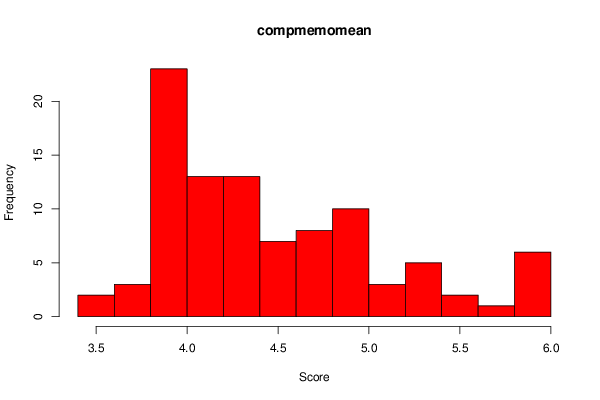
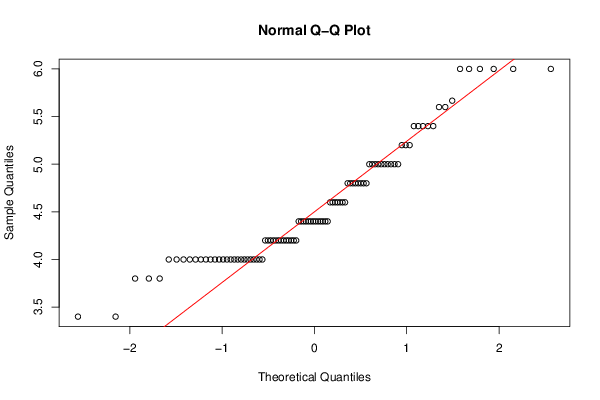
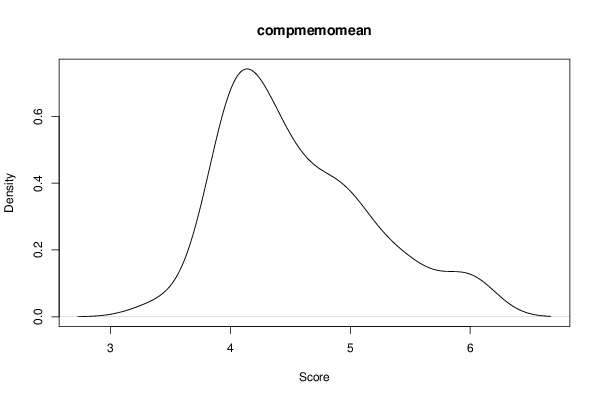
| Title produced by software | Histogram, QQplot and Density | |||||||||||||||||||||||||||||
| Date of computation | Thu, 27 Nov 2014 12:34:05 +0000 | |||||||||||||||||||||||||||||
| Cite this page as follows | Statistical Computations at FreeStatistics.org, Office for Research Development and Education, URL https://freestatistics.org/blog/index.php?v=date/2014/Nov/27/t1417091652e9sfr47jvcvaquw.htm/, Retrieved Sat, 01 Aug 2026 13:08:51 +0000 | |||||||||||||||||||||||||||||
| Statistical Computations at FreeStatistics.org, Office for Research Development and Education, URL https://freestatistics.org/blog/index.php?pk=259947, Retrieved Sat, 01 Aug 2026 13:08:51 +0000 | ||||||||||||||||||||||||||||||
| QR Codes: | ||||||||||||||||||||||||||||||
|
| ||||||||||||||||||||||||||||||
| Original text written by user: | ||||||||||||||||||||||||||||||
| IsPrivate? | No (this computation is public) | |||||||||||||||||||||||||||||
| User-defined keywords | ||||||||||||||||||||||||||||||
| Estimated Impact | 328 | |||||||||||||||||||||||||||||
Tree of Dependent Computations | ||||||||||||||||||||||||||||||
| Family? (F = Feedback message, R = changed R code, M = changed R Module, P = changed Parameters, D = changed Data) | ||||||||||||||||||||||||||||||
| - [Histogram, QQplot and Density] [] [2014-11-27 12:34:05] [5d05d0b8775d106efbff6e77eb684f54] [Current] - R [Histogram, QQplot and Density] [] [2014-11-27 12:37:13] [f4fa611074bbaf9f95df1d3763dcf0c9] - D [Histogram, QQplot and Density] [] [2014-11-27 12:40:51] [f4fa611074bbaf9f95df1d3763dcf0c9] - R D [Histogram, QQplot and Density] [] [2014-11-27 12:42:28] [f4fa611074bbaf9f95df1d3763dcf0c9] - R PD [Histogram, QQplot and Density] [] [2014-11-27 12:44:28] [f4fa611074bbaf9f95df1d3763dcf0c9] - D [Histogram, QQplot and Density] [] [2014-11-27 12:47:03] [f4fa611074bbaf9f95df1d3763dcf0c9] - R D [Histogram, QQplot and Density] [] [2014-11-27 12:49:25] [f4fa611074bbaf9f95df1d3763dcf0c9] | ||||||||||||||||||||||||||||||
| Feedback Forum | ||||||||||||||||||||||||||||||
Post a new message | ||||||||||||||||||||||||||||||
Dataset | ||||||||||||||||||||||||||||||
| Dataseries X: | ||||||||||||||||||||||||||||||
4.8 5.4 6 6 4 6 4.2 4.2 4.2 4 4.6 5.666666667 3.8 4.8 4.2 4 5.4 4.6 4 4.4 5 5.4 5.2 4.4 4 3.4 4.4 4 4.4 4.4 4 4.8 4 4 5 4 3.4 4 5.4 4.2 4 5.6 4.8 4.4 4.6 4 5.2 4.8 4.6 4 4.2 4.6 4.4 5 5 4 3.8 5.2 4.2 4.4 4.2 6 4.8 4 4.4 4 4.8 4.8 5.6 6 4 4.2 5 4.4 4.2 4.6 4.4 4 4 4 4.2 4 5 4.2 5.4 4 6 3.8 5 4.4 5 4.4 5 4.2 4.6 5 | ||||||||||||||||||||||||||||||
Tables (Output of Computation) | ||||||||||||||||||||||||||||||
| ||||||||||||||||||||||||||||||
Figures (Output of Computation) | ||||||||||||||||||||||||||||||
Input Parameters & R Code | ||||||||||||||||||||||||||||||
| Parameters (Session): | ||||||||||||||||||||||||||||||
| par1 = 10 ; | ||||||||||||||||||||||||||||||
| Parameters (R input): | ||||||||||||||||||||||||||||||
| par1 = 10 ; | ||||||||||||||||||||||||||||||
| R code (references can be found in the software module): | ||||||||||||||||||||||||||||||
par1 <- '10' | ||||||||||||||||||||||||||||||