Free Statistics
of Irreproducible Research!
Description of Statistical Computation | ||||||||||||||||||||||||||||||
|---|---|---|---|---|---|---|---|---|---|---|---|---|---|---|---|---|---|---|---|---|---|---|---|---|---|---|---|---|---|---|
| Author's title | ||||||||||||||||||||||||||||||
| Author | *The author of this computation has been verified* | |||||||||||||||||||||||||||||
| R Software Module | rwasp_Distributional Plots.wasp | |||||||||||||||||||||||||||||
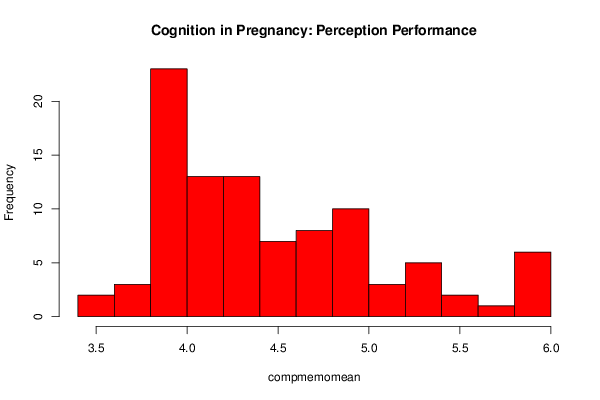
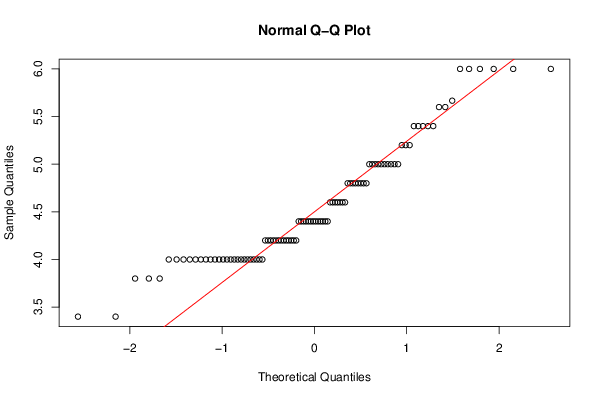
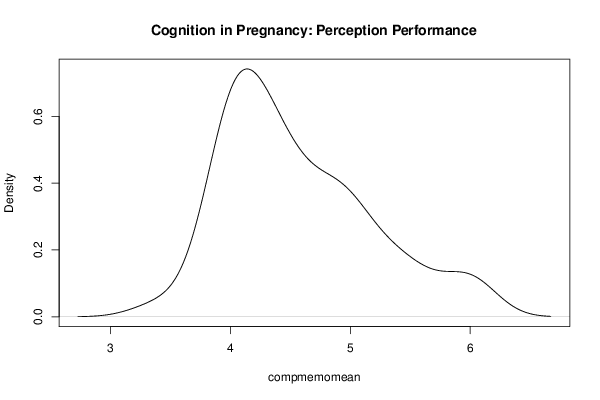
| Title produced by software | Histogram, QQplot and Density | |||||||||||||||||||||||||||||
| Date of computation | Tue, 02 Dec 2014 09:17:20 +0000 | |||||||||||||||||||||||||||||
| Cite this page as follows | Statistical Computations at FreeStatistics.org, Office for Research Development and Education, URL https://freestatistics.org/blog/index.php?v=date/2014/Dec/02/t1417511862xy8rdeyzgj1v786.htm/, Retrieved Sun, 31 May 2026 09:34:56 +0000 | |||||||||||||||||||||||||||||
| Statistical Computations at FreeStatistics.org, Office for Research Development and Education, URL https://freestatistics.org/blog/index.php?pk=262420, Retrieved Sun, 31 May 2026 09:34:56 +0000 | ||||||||||||||||||||||||||||||
| QR Codes: | ||||||||||||||||||||||||||||||
|
| ||||||||||||||||||||||||||||||
| Original text written by user: | ||||||||||||||||||||||||||||||
| IsPrivate? | No (this computation is public) | |||||||||||||||||||||||||||||
| User-defined keywords | ||||||||||||||||||||||||||||||
| Estimated Impact | 343 | |||||||||||||||||||||||||||||
Tree of Dependent Computations | ||||||||||||||||||||||||||||||
| Family? (F = Feedback message, R = changed R code, M = changed R Module, P = changed Parameters, D = changed Data) | ||||||||||||||||||||||||||||||
| - [Variability] [Pregnancy and Cog...] [2009-10-24 23:53:36] [98fd0e87c3eb04e0cc2efde01dbafab6] - RMPD [Correlation] [Cognition in Preg...] [2011-10-24 17:01:26] [98fd0e87c3eb04e0cc2efde01dbafab6] - RMPD [Histogram, QQplot and Density] [1] [2014-12-02 09:09:43] [960394f6708a51876e6dd07a1f9ce797] - R PD [Histogram, QQplot and Density] [1] [2014-12-02 09:17:20] [ad2d8e45bd7f381119bb81c21ea6fa7f] [Current] - D [Histogram, QQplot and Density] [2] [2014-12-02 09:21:06] [960394f6708a51876e6dd07a1f9ce797] - M [Histogram, QQplot and Density] [3] [2014-12-02 09:22:29] [960394f6708a51876e6dd07a1f9ce797] - M D [Histogram, QQplot and Density] [4] [2014-12-02 09:27:17] [960394f6708a51876e6dd07a1f9ce797] - D [Histogram, QQplot and Density] [5] [2014-12-02 09:29:31] [960394f6708a51876e6dd07a1f9ce797] - D [Histogram, QQplot and Density] [6] [2014-12-02 09:32:40] [960394f6708a51876e6dd07a1f9ce797] | ||||||||||||||||||||||||||||||
| Feedback Forum | ||||||||||||||||||||||||||||||
Post a new message | ||||||||||||||||||||||||||||||
Dataset | ||||||||||||||||||||||||||||||
| Dataseries X: | ||||||||||||||||||||||||||||||
4.8 5.4 6 6 4 6 4.2 4.2 4.2 4 4.6 5.6666666667 3.8 4.8 4.2 4 5.4 4.6 4 4.4 5 5.4 5.2 4.4 4 3.4 4.4 4 4.4 4.4 4 4.8 4 4 5 4 3.4 4 5.4 4.2 4 5.6 4.8 4.4 4.6 4 5.2 4.8 4.6 4 4.2 4.6 4.4 5 5 4 3.8 5.2 4.2 4.4 4.2 6 4.8 4 4.4 4 4.8 4.8 5.6 6 4 4.2 5 4.4 4.2 4.6 4.4 4 4 4 4.2 4 5 4.2 5.4 4 6 3.8 5 4.4 5 4.4 5 4.2 4.6 5 | ||||||||||||||||||||||||||||||
Tables (Output of Computation) | ||||||||||||||||||||||||||||||
| ||||||||||||||||||||||||||||||
Figures (Output of Computation) | ||||||||||||||||||||||||||||||
Input Parameters & R Code | ||||||||||||||||||||||||||||||
| Parameters (Session): | ||||||||||||||||||||||||||||||
| par1 = 15 ; | ||||||||||||||||||||||||||||||
| Parameters (R input): | ||||||||||||||||||||||||||||||
| par1 = 15 ; | ||||||||||||||||||||||||||||||
| R code (references can be found in the software module): | ||||||||||||||||||||||||||||||
x <- x[!is.na(x)] | ||||||||||||||||||||||||||||||