\begin{tabular}{lllllllll}
\hline
Summary of computational transaction \tabularnewline
Raw Input & view raw input (R code)  \tabularnewline
Raw Output & view raw output of R engine  \tabularnewline
Computing time & 1 seconds \tabularnewline
R Server & 'Gertrude Mary Cox' @ cox.wessa.net \tabularnewline
\hline
\end{tabular}
%Source: https://freestatistics.org/blog/index.php?pk=285710&T=0
[TABLE]
[ROW][C]Summary of computational transaction[/C][/ROW]
[ROW][C]Raw Input[/C][C]view raw input (R code) [/C][/ROW]
[ROW][C]Raw Output[/C][C]view raw output of R engine [/C][/ROW]
[ROW][C]Computing time[/C][C]1 seconds[/C][/ROW]
[ROW][C]R Server[/C][C]'Gertrude Mary Cox' @ cox.wessa.net[/C][/ROW]
[/TABLE]
Source: https://freestatistics.org/blog/index.php?pk=285710&T=0
If you paste this QR Code into your document, anyone with a smartphone or tablet will be able to scan it and view this table in a browser.
If you paste this QR Code into your document, anyone with a smartphone or tablet will be able to scan it and view this table in a browser.
If you paste this QR Code into your document, anyone with a smartphone or tablet will be able to scan it and view this table in a browser.
If you paste this QR Code into your document, anyone with a smartphone or tablet will be able to scan it and view this table in a browser.
If you paste this QR Code into your document, anyone with a smartphone or tablet will be able to scan it and view this table in a browser.
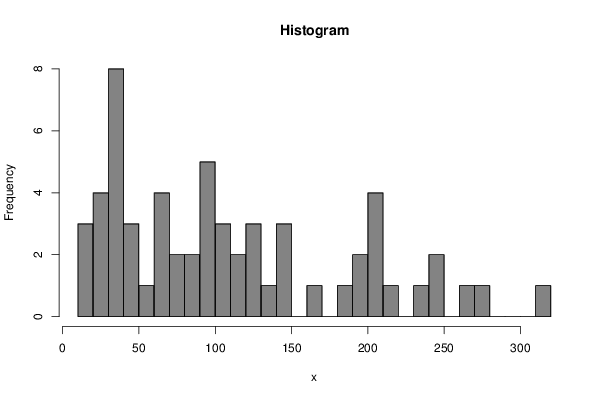
| Frequency Table (Histogram) | | Bins | Midpoint | Abs. Frequency | Rel. Frequency | Cumul. Rel. Freq. | Density | | [10,20[ | 15 | 3 | 0.050847 | 0.050847 | 0.005085 | | [20,30[ | 25 | 4 | 0.067797 | 0.118644 | 0.00678 | | [30,40[ | 35 | 8 | 0.135593 | 0.254237 | 0.013559 | | [40,50[ | 45 | 3 | 0.050847 | 0.305085 | 0.005085 | | [50,60[ | 55 | 1 | 0.016949 | 0.322034 | 0.001695 | | [60,70[ | 65 | 4 | 0.067797 | 0.389831 | 0.00678 | | [70,80[ | 75 | 2 | 0.033898 | 0.423729 | 0.00339 | | [80,90[ | 85 | 2 | 0.033898 | 0.457627 | 0.00339 | | [90,100[ | 95 | 5 | 0.084746 | 0.542373 | 0.008475 | | [100,110[ | 105 | 3 | 0.050847 | 0.59322 | 0.005085 | | [110,120[ | 115 | 2 | 0.033898 | 0.627119 | 0.00339 | | [120,130[ | 125 | 3 | 0.050847 | 0.677966 | 0.005085 | | [130,140[ | 135 | 1 | 0.016949 | 0.694915 | 0.001695 | | [140,150[ | 145 | 3 | 0.050847 | 0.745763 | 0.005085 | | [150,160[ | 155 | 0 | 0 | 0.745763 | 0 | | [160,170[ | 165 | 1 | 0.016949 | 0.762712 | 0.001695 | | [170,180[ | 175 | 0 | 0 | 0.762712 | 0 | | [180,190[ | 185 | 1 | 0.016949 | 0.779661 | 0.001695 | | [190,200[ | 195 | 2 | 0.033898 | 0.813559 | 0.00339 | | [200,210[ | 205 | 4 | 0.067797 | 0.881356 | 0.00678 | | [210,220[ | 215 | 1 | 0.016949 | 0.898305 | 0.001695 | | [220,230[ | 225 | 0 | 0 | 0.898305 | 0 | | [230,240[ | 235 | 1 | 0.016949 | 0.915254 | 0.001695 | | [240,250[ | 245 | 2 | 0.033898 | 0.949153 | 0.00339 | | [250,260[ | 255 | 0 | 0 | 0.949153 | 0 | | [260,270[ | 265 | 1 | 0.016949 | 0.966102 | 0.001695 | | [270,280[ | 275 | 1 | 0.016949 | 0.983051 | 0.001695 | | [280,290[ | 285 | 0 | 0 | 0.983051 | 0 | | [290,300[ | 295 | 0 | 0 | 0.983051 | 0 | | [300,310[ | 305 | 0 | 0 | 0.983051 | 0 | | [310,320] | 315 | 1 | 0.016949 | 1 | 0.001695 |
\begin{tabular}{lllllllll}
\hline
Frequency Table (Histogram) \tabularnewline
Bins & Midpoint & Abs. Frequency & Rel. Frequency & Cumul. Rel. Freq. & Density \tabularnewline
[10,20[ & 15 & 3 & 0.050847 & 0.050847 & 0.005085 \tabularnewline
[20,30[ & 25 & 4 & 0.067797 & 0.118644 & 0.00678 \tabularnewline
[30,40[ & 35 & 8 & 0.135593 & 0.254237 & 0.013559 \tabularnewline
[40,50[ & 45 & 3 & 0.050847 & 0.305085 & 0.005085 \tabularnewline
[50,60[ & 55 & 1 & 0.016949 & 0.322034 & 0.001695 \tabularnewline
[60,70[ & 65 & 4 & 0.067797 & 0.389831 & 0.00678 \tabularnewline
[70,80[ & 75 & 2 & 0.033898 & 0.423729 & 0.00339 \tabularnewline
[80,90[ & 85 & 2 & 0.033898 & 0.457627 & 0.00339 \tabularnewline
[90,100[ & 95 & 5 & 0.084746 & 0.542373 & 0.008475 \tabularnewline
[100,110[ & 105 & 3 & 0.050847 & 0.59322 & 0.005085 \tabularnewline
[110,120[ & 115 & 2 & 0.033898 & 0.627119 & 0.00339 \tabularnewline
[120,130[ & 125 & 3 & 0.050847 & 0.677966 & 0.005085 \tabularnewline
[130,140[ & 135 & 1 & 0.016949 & 0.694915 & 0.001695 \tabularnewline
[140,150[ & 145 & 3 & 0.050847 & 0.745763 & 0.005085 \tabularnewline
[150,160[ & 155 & 0 & 0 & 0.745763 & 0 \tabularnewline
[160,170[ & 165 & 1 & 0.016949 & 0.762712 & 0.001695 \tabularnewline
[170,180[ & 175 & 0 & 0 & 0.762712 & 0 \tabularnewline
[180,190[ & 185 & 1 & 0.016949 & 0.779661 & 0.001695 \tabularnewline
[190,200[ & 195 & 2 & 0.033898 & 0.813559 & 0.00339 \tabularnewline
[200,210[ & 205 & 4 & 0.067797 & 0.881356 & 0.00678 \tabularnewline
[210,220[ & 215 & 1 & 0.016949 & 0.898305 & 0.001695 \tabularnewline
[220,230[ & 225 & 0 & 0 & 0.898305 & 0 \tabularnewline
[230,240[ & 235 & 1 & 0.016949 & 0.915254 & 0.001695 \tabularnewline
[240,250[ & 245 & 2 & 0.033898 & 0.949153 & 0.00339 \tabularnewline
[250,260[ & 255 & 0 & 0 & 0.949153 & 0 \tabularnewline
[260,270[ & 265 & 1 & 0.016949 & 0.966102 & 0.001695 \tabularnewline
[270,280[ & 275 & 1 & 0.016949 & 0.983051 & 0.001695 \tabularnewline
[280,290[ & 285 & 0 & 0 & 0.983051 & 0 \tabularnewline
[290,300[ & 295 & 0 & 0 & 0.983051 & 0 \tabularnewline
[300,310[ & 305 & 0 & 0 & 0.983051 & 0 \tabularnewline
[310,320] & 315 & 1 & 0.016949 & 1 & 0.001695 \tabularnewline
\hline
\end{tabular}
%Source: https://freestatistics.org/blog/index.php?pk=285710&T=1
[TABLE]
[ROW][C]Frequency Table (Histogram)[/C][/ROW]
[ROW][C]Bins[/C][C]Midpoint[/C][C]Abs. Frequency[/C][C]Rel. Frequency[/C][C]Cumul. Rel. Freq.[/C][C]Density[/C][/ROW]
[ROW][C][10,20[[/C][C]15[/C][C]3[/C][C]0.050847[/C][C]0.050847[/C][C]0.005085[/C][/ROW]
[ROW][C][20,30[[/C][C]25[/C][C]4[/C][C]0.067797[/C][C]0.118644[/C][C]0.00678[/C][/ROW]
[ROW][C][30,40[[/C][C]35[/C][C]8[/C][C]0.135593[/C][C]0.254237[/C][C]0.013559[/C][/ROW]
[ROW][C][40,50[[/C][C]45[/C][C]3[/C][C]0.050847[/C][C]0.305085[/C][C]0.005085[/C][/ROW]
[ROW][C][50,60[[/C][C]55[/C][C]1[/C][C]0.016949[/C][C]0.322034[/C][C]0.001695[/C][/ROW]
[ROW][C][60,70[[/C][C]65[/C][C]4[/C][C]0.067797[/C][C]0.389831[/C][C]0.00678[/C][/ROW]
[ROW][C][70,80[[/C][C]75[/C][C]2[/C][C]0.033898[/C][C]0.423729[/C][C]0.00339[/C][/ROW]
[ROW][C][80,90[[/C][C]85[/C][C]2[/C][C]0.033898[/C][C]0.457627[/C][C]0.00339[/C][/ROW]
[ROW][C][90,100[[/C][C]95[/C][C]5[/C][C]0.084746[/C][C]0.542373[/C][C]0.008475[/C][/ROW]
[ROW][C][100,110[[/C][C]105[/C][C]3[/C][C]0.050847[/C][C]0.59322[/C][C]0.005085[/C][/ROW]
[ROW][C][110,120[[/C][C]115[/C][C]2[/C][C]0.033898[/C][C]0.627119[/C][C]0.00339[/C][/ROW]
[ROW][C][120,130[[/C][C]125[/C][C]3[/C][C]0.050847[/C][C]0.677966[/C][C]0.005085[/C][/ROW]
[ROW][C][130,140[[/C][C]135[/C][C]1[/C][C]0.016949[/C][C]0.694915[/C][C]0.001695[/C][/ROW]
[ROW][C][140,150[[/C][C]145[/C][C]3[/C][C]0.050847[/C][C]0.745763[/C][C]0.005085[/C][/ROW]
[ROW][C][150,160[[/C][C]155[/C][C]0[/C][C]0[/C][C]0.745763[/C][C]0[/C][/ROW]
[ROW][C][160,170[[/C][C]165[/C][C]1[/C][C]0.016949[/C][C]0.762712[/C][C]0.001695[/C][/ROW]
[ROW][C][170,180[[/C][C]175[/C][C]0[/C][C]0[/C][C]0.762712[/C][C]0[/C][/ROW]
[ROW][C][180,190[[/C][C]185[/C][C]1[/C][C]0.016949[/C][C]0.779661[/C][C]0.001695[/C][/ROW]
[ROW][C][190,200[[/C][C]195[/C][C]2[/C][C]0.033898[/C][C]0.813559[/C][C]0.00339[/C][/ROW]
[ROW][C][200,210[[/C][C]205[/C][C]4[/C][C]0.067797[/C][C]0.881356[/C][C]0.00678[/C][/ROW]
[ROW][C][210,220[[/C][C]215[/C][C]1[/C][C]0.016949[/C][C]0.898305[/C][C]0.001695[/C][/ROW]
[ROW][C][220,230[[/C][C]225[/C][C]0[/C][C]0[/C][C]0.898305[/C][C]0[/C][/ROW]
[ROW][C][230,240[[/C][C]235[/C][C]1[/C][C]0.016949[/C][C]0.915254[/C][C]0.001695[/C][/ROW]
[ROW][C][240,250[[/C][C]245[/C][C]2[/C][C]0.033898[/C][C]0.949153[/C][C]0.00339[/C][/ROW]
[ROW][C][250,260[[/C][C]255[/C][C]0[/C][C]0[/C][C]0.949153[/C][C]0[/C][/ROW]
[ROW][C][260,270[[/C][C]265[/C][C]1[/C][C]0.016949[/C][C]0.966102[/C][C]0.001695[/C][/ROW]
[ROW][C][270,280[[/C][C]275[/C][C]1[/C][C]0.016949[/C][C]0.983051[/C][C]0.001695[/C][/ROW]
[ROW][C][280,290[[/C][C]285[/C][C]0[/C][C]0[/C][C]0.983051[/C][C]0[/C][/ROW]
[ROW][C][290,300[[/C][C]295[/C][C]0[/C][C]0[/C][C]0.983051[/C][C]0[/C][/ROW]
[ROW][C][300,310[[/C][C]305[/C][C]0[/C][C]0[/C][C]0.983051[/C][C]0[/C][/ROW]
[ROW][C][310,320][/C][C]315[/C][C]1[/C][C]0.016949[/C][C]1[/C][C]0.001695[/C][/ROW]
[/TABLE]
Source: https://freestatistics.org/blog/index.php?pk=285710&T=1
Globally Unique Identifier (entire table): ba.freestatistics.org/blog/index.php?pk=285710&T=1
As an alternative you can also use a QR Code:
The GUIDs for individual cells are displayed in the table below:
| Frequency Table (Histogram) | | Bins | Midpoint | Abs. Frequency | Rel. Frequency | Cumul. Rel. Freq. | Density | | [10,20[ | 15 | 3 | 0.050847 | 0.050847 | 0.005085 | | [20,30[ | 25 | 4 | 0.067797 | 0.118644 | 0.00678 | | [30,40[ | 35 | 8 | 0.135593 | 0.254237 | 0.013559 | | [40,50[ | 45 | 3 | 0.050847 | 0.305085 | 0.005085 | | [50,60[ | 55 | 1 | 0.016949 | 0.322034 | 0.001695 | | [60,70[ | 65 | 4 | 0.067797 | 0.389831 | 0.00678 | | [70,80[ | 75 | 2 | 0.033898 | 0.423729 | 0.00339 | | [80,90[ | 85 | 2 | 0.033898 | 0.457627 | 0.00339 | | [90,100[ | 95 | 5 | 0.084746 | 0.542373 | 0.008475 | | [100,110[ | 105 | 3 | 0.050847 | 0.59322 | 0.005085 | | [110,120[ | 115 | 2 | 0.033898 | 0.627119 | 0.00339 | | [120,130[ | 125 | 3 | 0.050847 | 0.677966 | 0.005085 | | [130,140[ | 135 | 1 | 0.016949 | 0.694915 | 0.001695 | | [140,150[ | 145 | 3 | 0.050847 | 0.745763 | 0.005085 | | [150,160[ | 155 | 0 | 0 | 0.745763 | 0 | | [160,170[ | 165 | 1 | 0.016949 | 0.762712 | 0.001695 | | [170,180[ | 175 | 0 | 0 | 0.762712 | 0 | | [180,190[ | 185 | 1 | 0.016949 | 0.779661 | 0.001695 | | [190,200[ | 195 | 2 | 0.033898 | 0.813559 | 0.00339 | | [200,210[ | 205 | 4 | 0.067797 | 0.881356 | 0.00678 | | [210,220[ | 215 | 1 | 0.016949 | 0.898305 | 0.001695 | | [220,230[ | 225 | 0 | 0 | 0.898305 | 0 | | [230,240[ | 235 | 1 | 0.016949 | 0.915254 | 0.001695 | | [240,250[ | 245 | 2 | 0.033898 | 0.949153 | 0.00339 | | [250,260[ | 255 | 0 | 0 | 0.949153 | 0 | | [260,270[ | 265 | 1 | 0.016949 | 0.966102 | 0.001695 | | [270,280[ | 275 | 1 | 0.016949 | 0.983051 | 0.001695 | | [280,290[ | 285 | 0 | 0 | 0.983051 | 0 | | [290,300[ | 295 | 0 | 0 | 0.983051 | 0 | | [300,310[ | 305 | 0 | 0 | 0.983051 | 0 | | [310,320] | 315 | 1 | 0.016949 | 1 | 0.001695 |
If you paste this QR Code into your document, anyone with a smartphone or tablet will be able to scan it and view this table in a browser.
If you paste this QR Code into your document, anyone with a smartphone or tablet will be able to scan it and view this table in a browser.
If you paste this QR Code into your document, anyone with a smartphone or tablet will be able to scan it and view this table in a browser.
If you paste this QR Code into your document, anyone with a smartphone or tablet will be able to scan it and view this table in a browser.
If you paste this QR Code into your document, anyone with a smartphone or tablet will be able to scan it and view this table in a browser.
|