Free Statistics

of Irreproducible Research!

Author's title

Author*Unverified author*
R Software Modulerwasp_autocorrelation.wasp
Title produced by software(Partial) Autocorrelation Function
Date of computationMon, 28 Dec 2015 07:17:38 +0000
Cite this page as followsStatistical Computations at FreeStatistics.org, Office for Research Development and Education, URL https://freestatistics.org/blog/index.php?v=date/2015/Dec/28/t1451287237gvd5xjam7gx4q2u.htm/, Retrieved Thu, 31 Oct 2024 23:47:27 +0000
Statistical Computations at FreeStatistics.org, Office for Research Development and Education, URL https://freestatistics.org/blog/index.php?pk=287134, Retrieved Thu, 31 Oct 2024 23:47:27 +0000
QR Codes:

Original text written by user:
IsPrivate?No (this computation is public)
User-defined keywords
Estimated Impact174
Family? (F = Feedback message, R = changed R code, M = changed R Module, P = changed Parameters, D = changed Data)
-       [(Partial) Autocorrelation Function] [] [2015-12-28 07:17:38] [f684f3a3d8618606ffff76ddc8e0eec7] [Current]
Feedback Forum

Post a new message
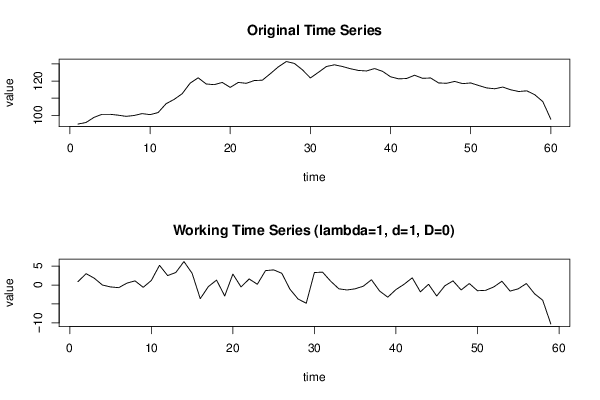
Dataseries X:
94.9
95.8
98.8
100.6
100.6
100.1
99.4
99.9
101
100.4
101.6
106.8
109.3
112.6
118.8
121.9
118.3
117.9
119.2
116.3
119.2
118.7
120.3
120.5
124.3
128.3
131.4
130.3
126.6
121.8
125.1
128.5
129.5
128.5
127.2
126.2
125.9
127.3
125.7
122.5
121.3
121.5
123.4
121.6
121.8
118.9
118.7
119.8
118.5
118.9
117.4
116
115.5
116.5
114.9
113.9
114.3
112
108
97.7


Summary of computational transaction
Raw Inputview raw input (R code)
Raw Outputview raw output of R engine
Computing time2 seconds
R Server'Herman Ole Andreas Wold' @ wold.wessa.net

\begin{tabular}{lllllllll}
\hline
Summary of computational transaction \tabularnewline
Raw Input & view raw input (R code)  \tabularnewline
Raw Output & view raw output of R engine  \tabularnewline
Computing time & 2 seconds \tabularnewline
R Server & 'Herman Ole Andreas Wold' @ wold.wessa.net \tabularnewline
\hline
\end{tabular}
%Source: https://freestatistics.org/blog/index.php?pk=287134&T=0

[TABLE]
[ROW][C]Summary of computational transaction[/C][/ROW]
[ROW][C]Raw Input[/C][C]view raw input (R code) [/C][/ROW]
[ROW][C]Raw Output[/C][C]view raw output of R engine [/C][/ROW]
[ROW][C]Computing time[/C][C]2 seconds[/C][/ROW]
[ROW][C]R Server[/C][C]'Herman Ole Andreas Wold' @ wold.wessa.net[/C][/ROW]
[/TABLE]
Source: https://freestatistics.org/blog/index.php?pk=287134&T=0

Globally Unique Identifier (entire table): ba.freestatistics.org/blog/index.php?pk=287134&T=0

As an alternative you can also use a QR Code:  

The GUIDs for individual cells are displayed in the table below:

Summary of computational transaction
Raw Inputview raw input (R code)
Raw Outputview raw output of R engine
Computing time2 seconds
R Server'Herman Ole Andreas Wold' @ wold.wessa.net


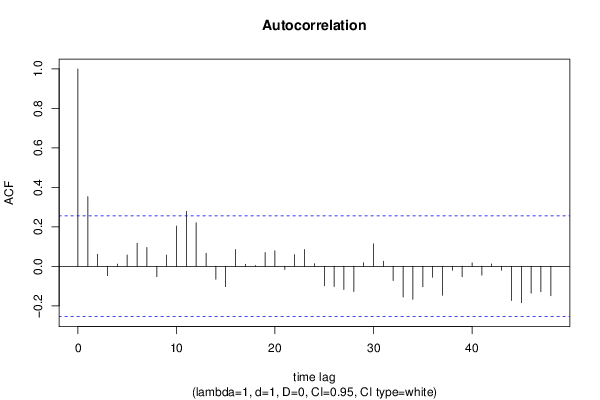
Autocorrelation Function
Time lag kACF(k)T-STATP-value
10.352912.71080.004389
20.061110.46940.320259
3-0.047416-0.36420.358502
40.0110940.08520.466191
50.057580.44230.329951
60.116070.89160.188127
70.0953080.73210.23351
8-0.052518-0.40340.344058
90.0565240.43420.332873
100.2036121.5640.061586
110.2787312.1410.018209
120.2207721.69580.047599
130.0665670.51130.305521
14-0.065341-0.50190.308805
15-0.103248-0.79310.215459
160.0847940.65130.258687
170.0105720.08120.467777
180.0040.03070.487796
190.070040.5380.296306
200.0790590.60730.273004
21-0.016259-0.12490.450519
220.059180.45460.325544
230.0849950.65290.258191
240.0131310.10090.46
25-0.098737-0.75840.225612
26-0.102015-0.78360.218208
27-0.117684-0.90390.18485
28-0.127351-0.97820.165985
290.0177790.13660.44592
300.1135330.87210.193355
310.0259740.19950.421275
32-0.071754-0.55120.291805
33-0.155559-1.19490.11846
34-0.167074-1.28330.1022
35-0.103319-0.79360.215303
36-0.055981-0.430.334381
37-0.147129-1.13010.1315
38-0.019982-0.15350.43927
39-0.052902-0.40630.342979
400.0175150.13450.446718
41-0.044812-0.34420.365957
420.0115380.08860.464841
43-0.019808-0.15210.439795
44-0.173252-1.33080.094192
45-0.184995-1.4210.080294
46-0.135899-1.04390.150404
47-0.12898-0.99070.162936
48-0.149109-1.14530.128349

\begin{tabular}{lllllllll}
\hline
Autocorrelation Function \tabularnewline
Time lag k & ACF(k) & T-STAT & P-value \tabularnewline
1 & 0.35291 & 2.7108 & 0.004389 \tabularnewline
2 & 0.06111 & 0.4694 & 0.320259 \tabularnewline
3 & -0.047416 & -0.3642 & 0.358502 \tabularnewline
4 & 0.011094 & 0.0852 & 0.466191 \tabularnewline
5 & 0.05758 & 0.4423 & 0.329951 \tabularnewline
6 & 0.11607 & 0.8916 & 0.188127 \tabularnewline
7 & 0.095308 & 0.7321 & 0.23351 \tabularnewline
8 & -0.052518 & -0.4034 & 0.344058 \tabularnewline
9 & 0.056524 & 0.4342 & 0.332873 \tabularnewline
10 & 0.203612 & 1.564 & 0.061586 \tabularnewline
11 & 0.278731 & 2.141 & 0.018209 \tabularnewline
12 & 0.220772 & 1.6958 & 0.047599 \tabularnewline
13 & 0.066567 & 0.5113 & 0.305521 \tabularnewline
14 & -0.065341 & -0.5019 & 0.308805 \tabularnewline
15 & -0.103248 & -0.7931 & 0.215459 \tabularnewline
16 & 0.084794 & 0.6513 & 0.258687 \tabularnewline
17 & 0.010572 & 0.0812 & 0.467777 \tabularnewline
18 & 0.004 & 0.0307 & 0.487796 \tabularnewline
19 & 0.07004 & 0.538 & 0.296306 \tabularnewline
20 & 0.079059 & 0.6073 & 0.273004 \tabularnewline
21 & -0.016259 & -0.1249 & 0.450519 \tabularnewline
22 & 0.05918 & 0.4546 & 0.325544 \tabularnewline
23 & 0.084995 & 0.6529 & 0.258191 \tabularnewline
24 & 0.013131 & 0.1009 & 0.46 \tabularnewline
25 & -0.098737 & -0.7584 & 0.225612 \tabularnewline
26 & -0.102015 & -0.7836 & 0.218208 \tabularnewline
27 & -0.117684 & -0.9039 & 0.18485 \tabularnewline
28 & -0.127351 & -0.9782 & 0.165985 \tabularnewline
29 & 0.017779 & 0.1366 & 0.44592 \tabularnewline
30 & 0.113533 & 0.8721 & 0.193355 \tabularnewline
31 & 0.025974 & 0.1995 & 0.421275 \tabularnewline
32 & -0.071754 & -0.5512 & 0.291805 \tabularnewline
33 & -0.155559 & -1.1949 & 0.11846 \tabularnewline
34 & -0.167074 & -1.2833 & 0.1022 \tabularnewline
35 & -0.103319 & -0.7936 & 0.215303 \tabularnewline
36 & -0.055981 & -0.43 & 0.334381 \tabularnewline
37 & -0.147129 & -1.1301 & 0.1315 \tabularnewline
38 & -0.019982 & -0.1535 & 0.43927 \tabularnewline
39 & -0.052902 & -0.4063 & 0.342979 \tabularnewline
40 & 0.017515 & 0.1345 & 0.446718 \tabularnewline
41 & -0.044812 & -0.3442 & 0.365957 \tabularnewline
42 & 0.011538 & 0.0886 & 0.464841 \tabularnewline
43 & -0.019808 & -0.1521 & 0.439795 \tabularnewline
44 & -0.173252 & -1.3308 & 0.094192 \tabularnewline
45 & -0.184995 & -1.421 & 0.080294 \tabularnewline
46 & -0.135899 & -1.0439 & 0.150404 \tabularnewline
47 & -0.12898 & -0.9907 & 0.162936 \tabularnewline
48 & -0.149109 & -1.1453 & 0.128349 \tabularnewline
\hline
\end{tabular}
%Source: https://freestatistics.org/blog/index.php?pk=287134&T=1

[TABLE]
[ROW][C]Autocorrelation Function[/C][/ROW]
[ROW][C]Time lag k[/C][C]ACF(k)[/C][C]T-STAT[/C][C]P-value[/C][/ROW]
[ROW][C]1[/C][C]0.35291[/C][C]2.7108[/C][C]0.004389[/C][/ROW]
[ROW][C]2[/C][C]0.06111[/C][C]0.4694[/C][C]0.320259[/C][/ROW]
[ROW][C]3[/C][C]-0.047416[/C][C]-0.3642[/C][C]0.358502[/C][/ROW]
[ROW][C]4[/C][C]0.011094[/C][C]0.0852[/C][C]0.466191[/C][/ROW]
[ROW][C]5[/C][C]0.05758[/C][C]0.4423[/C][C]0.329951[/C][/ROW]
[ROW][C]6[/C][C]0.11607[/C][C]0.8916[/C][C]0.188127[/C][/ROW]
[ROW][C]7[/C][C]0.095308[/C][C]0.7321[/C][C]0.23351[/C][/ROW]
[ROW][C]8[/C][C]-0.052518[/C][C]-0.4034[/C][C]0.344058[/C][/ROW]
[ROW][C]9[/C][C]0.056524[/C][C]0.4342[/C][C]0.332873[/C][/ROW]
[ROW][C]10[/C][C]0.203612[/C][C]1.564[/C][C]0.061586[/C][/ROW]
[ROW][C]11[/C][C]0.278731[/C][C]2.141[/C][C]0.018209[/C][/ROW]
[ROW][C]12[/C][C]0.220772[/C][C]1.6958[/C][C]0.047599[/C][/ROW]
[ROW][C]13[/C][C]0.066567[/C][C]0.5113[/C][C]0.305521[/C][/ROW]
[ROW][C]14[/C][C]-0.065341[/C][C]-0.5019[/C][C]0.308805[/C][/ROW]
[ROW][C]15[/C][C]-0.103248[/C][C]-0.7931[/C][C]0.215459[/C][/ROW]
[ROW][C]16[/C][C]0.084794[/C][C]0.6513[/C][C]0.258687[/C][/ROW]
[ROW][C]17[/C][C]0.010572[/C][C]0.0812[/C][C]0.467777[/C][/ROW]
[ROW][C]18[/C][C]0.004[/C][C]0.0307[/C][C]0.487796[/C][/ROW]
[ROW][C]19[/C][C]0.07004[/C][C]0.538[/C][C]0.296306[/C][/ROW]
[ROW][C]20[/C][C]0.079059[/C][C]0.6073[/C][C]0.273004[/C][/ROW]
[ROW][C]21[/C][C]-0.016259[/C][C]-0.1249[/C][C]0.450519[/C][/ROW]
[ROW][C]22[/C][C]0.05918[/C][C]0.4546[/C][C]0.325544[/C][/ROW]
[ROW][C]23[/C][C]0.084995[/C][C]0.6529[/C][C]0.258191[/C][/ROW]
[ROW][C]24[/C][C]0.013131[/C][C]0.1009[/C][C]0.46[/C][/ROW]
[ROW][C]25[/C][C]-0.098737[/C][C]-0.7584[/C][C]0.225612[/C][/ROW]
[ROW][C]26[/C][C]-0.102015[/C][C]-0.7836[/C][C]0.218208[/C][/ROW]
[ROW][C]27[/C][C]-0.117684[/C][C]-0.9039[/C][C]0.18485[/C][/ROW]
[ROW][C]28[/C][C]-0.127351[/C][C]-0.9782[/C][C]0.165985[/C][/ROW]
[ROW][C]29[/C][C]0.017779[/C][C]0.1366[/C][C]0.44592[/C][/ROW]
[ROW][C]30[/C][C]0.113533[/C][C]0.8721[/C][C]0.193355[/C][/ROW]
[ROW][C]31[/C][C]0.025974[/C][C]0.1995[/C][C]0.421275[/C][/ROW]
[ROW][C]32[/C][C]-0.071754[/C][C]-0.5512[/C][C]0.291805[/C][/ROW]
[ROW][C]33[/C][C]-0.155559[/C][C]-1.1949[/C][C]0.11846[/C][/ROW]
[ROW][C]34[/C][C]-0.167074[/C][C]-1.2833[/C][C]0.1022[/C][/ROW]
[ROW][C]35[/C][C]-0.103319[/C][C]-0.7936[/C][C]0.215303[/C][/ROW]
[ROW][C]36[/C][C]-0.055981[/C][C]-0.43[/C][C]0.334381[/C][/ROW]
[ROW][C]37[/C][C]-0.147129[/C][C]-1.1301[/C][C]0.1315[/C][/ROW]
[ROW][C]38[/C][C]-0.019982[/C][C]-0.1535[/C][C]0.43927[/C][/ROW]
[ROW][C]39[/C][C]-0.052902[/C][C]-0.4063[/C][C]0.342979[/C][/ROW]
[ROW][C]40[/C][C]0.017515[/C][C]0.1345[/C][C]0.446718[/C][/ROW]
[ROW][C]41[/C][C]-0.044812[/C][C]-0.3442[/C][C]0.365957[/C][/ROW]
[ROW][C]42[/C][C]0.011538[/C][C]0.0886[/C][C]0.464841[/C][/ROW]
[ROW][C]43[/C][C]-0.019808[/C][C]-0.1521[/C][C]0.439795[/C][/ROW]
[ROW][C]44[/C][C]-0.173252[/C][C]-1.3308[/C][C]0.094192[/C][/ROW]
[ROW][C]45[/C][C]-0.184995[/C][C]-1.421[/C][C]0.080294[/C][/ROW]
[ROW][C]46[/C][C]-0.135899[/C][C]-1.0439[/C][C]0.150404[/C][/ROW]
[ROW][C]47[/C][C]-0.12898[/C][C]-0.9907[/C][C]0.162936[/C][/ROW]
[ROW][C]48[/C][C]-0.149109[/C][C]-1.1453[/C][C]0.128349[/C][/ROW]
[/TABLE]
Source: https://freestatistics.org/blog/index.php?pk=287134&T=1

Globally Unique Identifier (entire table): ba.freestatistics.org/blog/index.php?pk=287134&T=1

As an alternative you can also use a QR Code:  

The GUIDs for individual cells are displayed in the table below:

Autocorrelation Function
Time lag kACF(k)T-STATP-value
10.352912.71080.004389
20.061110.46940.320259
3-0.047416-0.36420.358502
40.0110940.08520.466191
50.057580.44230.329951
60.116070.89160.188127
70.0953080.73210.23351
8-0.052518-0.40340.344058
90.0565240.43420.332873
100.2036121.5640.061586
110.2787312.1410.018209
120.2207721.69580.047599
130.0665670.51130.305521
14-0.065341-0.50190.308805
15-0.103248-0.79310.215459
160.0847940.65130.258687
170.0105720.08120.467777
180.0040.03070.487796
190.070040.5380.296306
200.0790590.60730.273004
21-0.016259-0.12490.450519
220.059180.45460.325544
230.0849950.65290.258191
240.0131310.10090.46
25-0.098737-0.75840.225612
26-0.102015-0.78360.218208
27-0.117684-0.90390.18485
28-0.127351-0.97820.165985
290.0177790.13660.44592
300.1135330.87210.193355
310.0259740.19950.421275
32-0.071754-0.55120.291805
33-0.155559-1.19490.11846
34-0.167074-1.28330.1022
35-0.103319-0.79360.215303
36-0.055981-0.430.334381
37-0.147129-1.13010.1315
38-0.019982-0.15350.43927
39-0.052902-0.40630.342979
400.0175150.13450.446718
41-0.044812-0.34420.365957
420.0115380.08860.464841
43-0.019808-0.15210.439795
44-0.173252-1.33080.094192
45-0.184995-1.4210.080294
46-0.135899-1.04390.150404
47-0.12898-0.99070.162936
48-0.149109-1.14530.128349


Partial Autocorrelation Function
Time lag kPACF(k)T-STATP-value
10.352912.71080.004389
2-0.07246-0.55660.289961
3-0.051642-0.39670.34652
40.0579380.4450.328964
50.0405050.31110.378401
60.086430.66390.254676
70.0314740.24180.404902
8-0.109376-0.84010.202113
90.1442381.10790.136197
100.1713381.31610.09662
110.149861.15110.127169
120.0927350.71230.239539
13-0.029881-0.22950.409629
14-0.063949-0.49120.312554
15-0.065402-0.50240.30864
160.1043520.80150.213018
17-0.133565-1.02590.154555
18-0.001206-0.00930.496319
190.1082380.83140.204552
200.0034860.02680.489366
21-0.130072-0.99910.160913
220.0286370.220.413328
23-0.010629-0.08160.467605
240.0107960.08290.467097
25-0.105387-0.80950.210741
26-0.048896-0.37560.35429
27-0.065471-0.50290.308455
28-0.097231-0.74680.229061
290.0575530.44210.330026
300.0877220.67380.251532
31-0.051072-0.39230.348128
32-0.089288-0.68580.247753
33-0.101143-0.77690.220163
34-0.087048-0.66860.253169
35-0.052907-0.40640.342966
36-0.030499-0.23430.407796
37-0.036165-0.27780.391073
380.1863271.43120.078823
39-0.060593-0.46540.321672
400.047190.36250.359148
41-0.096322-0.73990.231159
420.0149280.11470.454549
430.0545810.41920.338279
44-0.066897-0.51380.30464
45-0.050355-0.38680.350155
46-0.009473-0.07280.47112
47-0.065651-0.50430.307974
48-0.081479-0.62580.266914

\begin{tabular}{lllllllll}
\hline
Partial Autocorrelation Function \tabularnewline
Time lag k & PACF(k) & T-STAT & P-value \tabularnewline
1 & 0.35291 & 2.7108 & 0.004389 \tabularnewline
2 & -0.07246 & -0.5566 & 0.289961 \tabularnewline
3 & -0.051642 & -0.3967 & 0.34652 \tabularnewline
4 & 0.057938 & 0.445 & 0.328964 \tabularnewline
5 & 0.040505 & 0.3111 & 0.378401 \tabularnewline
6 & 0.08643 & 0.6639 & 0.254676 \tabularnewline
7 & 0.031474 & 0.2418 & 0.404902 \tabularnewline
8 & -0.109376 & -0.8401 & 0.202113 \tabularnewline
9 & 0.144238 & 1.1079 & 0.136197 \tabularnewline
10 & 0.171338 & 1.3161 & 0.09662 \tabularnewline
11 & 0.14986 & 1.1511 & 0.127169 \tabularnewline
12 & 0.092735 & 0.7123 & 0.239539 \tabularnewline
13 & -0.029881 & -0.2295 & 0.409629 \tabularnewline
14 & -0.063949 & -0.4912 & 0.312554 \tabularnewline
15 & -0.065402 & -0.5024 & 0.30864 \tabularnewline
16 & 0.104352 & 0.8015 & 0.213018 \tabularnewline
17 & -0.133565 & -1.0259 & 0.154555 \tabularnewline
18 & -0.001206 & -0.0093 & 0.496319 \tabularnewline
19 & 0.108238 & 0.8314 & 0.204552 \tabularnewline
20 & 0.003486 & 0.0268 & 0.489366 \tabularnewline
21 & -0.130072 & -0.9991 & 0.160913 \tabularnewline
22 & 0.028637 & 0.22 & 0.413328 \tabularnewline
23 & -0.010629 & -0.0816 & 0.467605 \tabularnewline
24 & 0.010796 & 0.0829 & 0.467097 \tabularnewline
25 & -0.105387 & -0.8095 & 0.210741 \tabularnewline
26 & -0.048896 & -0.3756 & 0.35429 \tabularnewline
27 & -0.065471 & -0.5029 & 0.308455 \tabularnewline
28 & -0.097231 & -0.7468 & 0.229061 \tabularnewline
29 & 0.057553 & 0.4421 & 0.330026 \tabularnewline
30 & 0.087722 & 0.6738 & 0.251532 \tabularnewline
31 & -0.051072 & -0.3923 & 0.348128 \tabularnewline
32 & -0.089288 & -0.6858 & 0.247753 \tabularnewline
33 & -0.101143 & -0.7769 & 0.220163 \tabularnewline
34 & -0.087048 & -0.6686 & 0.253169 \tabularnewline
35 & -0.052907 & -0.4064 & 0.342966 \tabularnewline
36 & -0.030499 & -0.2343 & 0.407796 \tabularnewline
37 & -0.036165 & -0.2778 & 0.391073 \tabularnewline
38 & 0.186327 & 1.4312 & 0.078823 \tabularnewline
39 & -0.060593 & -0.4654 & 0.321672 \tabularnewline
40 & 0.04719 & 0.3625 & 0.359148 \tabularnewline
41 & -0.096322 & -0.7399 & 0.231159 \tabularnewline
42 & 0.014928 & 0.1147 & 0.454549 \tabularnewline
43 & 0.054581 & 0.4192 & 0.338279 \tabularnewline
44 & -0.066897 & -0.5138 & 0.30464 \tabularnewline
45 & -0.050355 & -0.3868 & 0.350155 \tabularnewline
46 & -0.009473 & -0.0728 & 0.47112 \tabularnewline
47 & -0.065651 & -0.5043 & 0.307974 \tabularnewline
48 & -0.081479 & -0.6258 & 0.266914 \tabularnewline
\hline
\end{tabular}
%Source: https://freestatistics.org/blog/index.php?pk=287134&T=2

[TABLE]
[ROW][C]Partial Autocorrelation Function[/C][/ROW]
[ROW][C]Time lag k[/C][C]PACF(k)[/C][C]T-STAT[/C][C]P-value[/C][/ROW]
[ROW][C]1[/C][C]0.35291[/C][C]2.7108[/C][C]0.004389[/C][/ROW]
[ROW][C]2[/C][C]-0.07246[/C][C]-0.5566[/C][C]0.289961[/C][/ROW]
[ROW][C]3[/C][C]-0.051642[/C][C]-0.3967[/C][C]0.34652[/C][/ROW]
[ROW][C]4[/C][C]0.057938[/C][C]0.445[/C][C]0.328964[/C][/ROW]
[ROW][C]5[/C][C]0.040505[/C][C]0.3111[/C][C]0.378401[/C][/ROW]
[ROW][C]6[/C][C]0.08643[/C][C]0.6639[/C][C]0.254676[/C][/ROW]
[ROW][C]7[/C][C]0.031474[/C][C]0.2418[/C][C]0.404902[/C][/ROW]
[ROW][C]8[/C][C]-0.109376[/C][C]-0.8401[/C][C]0.202113[/C][/ROW]
[ROW][C]9[/C][C]0.144238[/C][C]1.1079[/C][C]0.136197[/C][/ROW]
[ROW][C]10[/C][C]0.171338[/C][C]1.3161[/C][C]0.09662[/C][/ROW]
[ROW][C]11[/C][C]0.14986[/C][C]1.1511[/C][C]0.127169[/C][/ROW]
[ROW][C]12[/C][C]0.092735[/C][C]0.7123[/C][C]0.239539[/C][/ROW]
[ROW][C]13[/C][C]-0.029881[/C][C]-0.2295[/C][C]0.409629[/C][/ROW]
[ROW][C]14[/C][C]-0.063949[/C][C]-0.4912[/C][C]0.312554[/C][/ROW]
[ROW][C]15[/C][C]-0.065402[/C][C]-0.5024[/C][C]0.30864[/C][/ROW]
[ROW][C]16[/C][C]0.104352[/C][C]0.8015[/C][C]0.213018[/C][/ROW]
[ROW][C]17[/C][C]-0.133565[/C][C]-1.0259[/C][C]0.154555[/C][/ROW]
[ROW][C]18[/C][C]-0.001206[/C][C]-0.0093[/C][C]0.496319[/C][/ROW]
[ROW][C]19[/C][C]0.108238[/C][C]0.8314[/C][C]0.204552[/C][/ROW]
[ROW][C]20[/C][C]0.003486[/C][C]0.0268[/C][C]0.489366[/C][/ROW]
[ROW][C]21[/C][C]-0.130072[/C][C]-0.9991[/C][C]0.160913[/C][/ROW]
[ROW][C]22[/C][C]0.028637[/C][C]0.22[/C][C]0.413328[/C][/ROW]
[ROW][C]23[/C][C]-0.010629[/C][C]-0.0816[/C][C]0.467605[/C][/ROW]
[ROW][C]24[/C][C]0.010796[/C][C]0.0829[/C][C]0.467097[/C][/ROW]
[ROW][C]25[/C][C]-0.105387[/C][C]-0.8095[/C][C]0.210741[/C][/ROW]
[ROW][C]26[/C][C]-0.048896[/C][C]-0.3756[/C][C]0.35429[/C][/ROW]
[ROW][C]27[/C][C]-0.065471[/C][C]-0.5029[/C][C]0.308455[/C][/ROW]
[ROW][C]28[/C][C]-0.097231[/C][C]-0.7468[/C][C]0.229061[/C][/ROW]
[ROW][C]29[/C][C]0.057553[/C][C]0.4421[/C][C]0.330026[/C][/ROW]
[ROW][C]30[/C][C]0.087722[/C][C]0.6738[/C][C]0.251532[/C][/ROW]
[ROW][C]31[/C][C]-0.051072[/C][C]-0.3923[/C][C]0.348128[/C][/ROW]
[ROW][C]32[/C][C]-0.089288[/C][C]-0.6858[/C][C]0.247753[/C][/ROW]
[ROW][C]33[/C][C]-0.101143[/C][C]-0.7769[/C][C]0.220163[/C][/ROW]
[ROW][C]34[/C][C]-0.087048[/C][C]-0.6686[/C][C]0.253169[/C][/ROW]
[ROW][C]35[/C][C]-0.052907[/C][C]-0.4064[/C][C]0.342966[/C][/ROW]
[ROW][C]36[/C][C]-0.030499[/C][C]-0.2343[/C][C]0.407796[/C][/ROW]
[ROW][C]37[/C][C]-0.036165[/C][C]-0.2778[/C][C]0.391073[/C][/ROW]
[ROW][C]38[/C][C]0.186327[/C][C]1.4312[/C][C]0.078823[/C][/ROW]
[ROW][C]39[/C][C]-0.060593[/C][C]-0.4654[/C][C]0.321672[/C][/ROW]
[ROW][C]40[/C][C]0.04719[/C][C]0.3625[/C][C]0.359148[/C][/ROW]
[ROW][C]41[/C][C]-0.096322[/C][C]-0.7399[/C][C]0.231159[/C][/ROW]
[ROW][C]42[/C][C]0.014928[/C][C]0.1147[/C][C]0.454549[/C][/ROW]
[ROW][C]43[/C][C]0.054581[/C][C]0.4192[/C][C]0.338279[/C][/ROW]
[ROW][C]44[/C][C]-0.066897[/C][C]-0.5138[/C][C]0.30464[/C][/ROW]
[ROW][C]45[/C][C]-0.050355[/C][C]-0.3868[/C][C]0.350155[/C][/ROW]
[ROW][C]46[/C][C]-0.009473[/C][C]-0.0728[/C][C]0.47112[/C][/ROW]
[ROW][C]47[/C][C]-0.065651[/C][C]-0.5043[/C][C]0.307974[/C][/ROW]
[ROW][C]48[/C][C]-0.081479[/C][C]-0.6258[/C][C]0.266914[/C][/ROW]
[/TABLE]
Source: https://freestatistics.org/blog/index.php?pk=287134&T=2

Globally Unique Identifier (entire table): ba.freestatistics.org/blog/index.php?pk=287134&T=2

As an alternative you can also use a QR Code:  

The GUIDs for individual cells are displayed in the table below:

Partial Autocorrelation Function
Time lag kPACF(k)T-STATP-value
10.352912.71080.004389
2-0.07246-0.55660.289961
3-0.051642-0.39670.34652
40.0579380.4450.328964
50.0405050.31110.378401
60.086430.66390.254676
70.0314740.24180.404902
8-0.109376-0.84010.202113
90.1442381.10790.136197
100.1713381.31610.09662
110.149861.15110.127169
120.0927350.71230.239539
13-0.029881-0.22950.409629
14-0.063949-0.49120.312554
15-0.065402-0.50240.30864
160.1043520.80150.213018
17-0.133565-1.02590.154555
18-0.001206-0.00930.496319
190.1082380.83140.204552
200.0034860.02680.489366
21-0.130072-0.99910.160913
220.0286370.220.413328
23-0.010629-0.08160.467605
240.0107960.08290.467097
25-0.105387-0.80950.210741
26-0.048896-0.37560.35429
27-0.065471-0.50290.308455
28-0.097231-0.74680.229061
290.0575530.44210.330026
300.0877220.67380.251532
31-0.051072-0.39230.348128
32-0.089288-0.68580.247753
33-0.101143-0.77690.220163
34-0.087048-0.66860.253169
35-0.052907-0.40640.342966
36-0.030499-0.23430.407796
37-0.036165-0.27780.391073
380.1863271.43120.078823
39-0.060593-0.46540.321672
400.047190.36250.359148
41-0.096322-0.73990.231159
420.0149280.11470.454549
430.0545810.41920.338279
44-0.066897-0.51380.30464
45-0.050355-0.38680.350155
46-0.009473-0.07280.47112
47-0.065651-0.50430.307974
48-0.081479-0.62580.266914


Parameters (Session):
par1 = 48 ; par2 = 1 ; par3 = 1 ; par4 = 0 ; par5 = 12 ; par6 = White Noise ; par7 = 0.95 ;
Parameters (R input):
par1 = 48 ; par2 = 1 ; par3 = 1 ; par4 = 0 ; par5 = 12 ; par6 = White Noise ; par7 = 0.95 ; par8 = ;
R code (references can be found in the software module):
par8 <- ''
par7 <- '0.95'
par6 <- 'White Noise'
par5 <- '12'
par4 <- '0'
par3 <- '1'
par2 <- '1'
par1 <- '10'
if (par1 == 'Default') {
par1 = 10*log10(length(x))
} else {
par1 <- as.numeric(par1)
}
par2 <- as.numeric(par2)
par3 <- as.numeric(par3)
par4 <- as.numeric(par4)
par5 <- as.numeric(par5)
if (par6 == 'White Noise') par6 <- 'white' else par6 <- 'ma'
par7 <- as.numeric(par7)
if (par8 != '') par8 <- as.numeric(par8)
x <- na.omit(x)
ox <- x
if (par8 == '') {
if (par2 == 0) {
x <- log(x)
} else {
x <- (x ^ par2 - 1) / par2
}
} else {
x <- log(x,base=par8)
}
if (par3 > 0) x <- diff(x,lag=1,difference=par3)
if (par4 > 0) x <- diff(x,lag=par5,difference=par4)
bitmap(file='picts.png')
op <- par(mfrow=c(2,1))
plot(ox,type='l',main='Original Time Series',xlab='time',ylab='value')
if (par8=='') {
mytitle <- paste('Working Time Series (lambda=',par2,', d=',par3,', D=',par4,')',sep='')
mysub <- paste('(lambda=',par2,', d=',par3,', D=',par4,', CI=', par7, ', CI type=',par6,')',sep='')
} else {
mytitle <- paste('Working Time Series (base=',par8,', d=',par3,', D=',par4,')',sep='')
mysub <- paste('(base=',par8,', d=',par3,', D=',par4,', CI=', par7, ', CI type=',par6,')',sep='')
}
plot(x,type='l', main=mytitle,xlab='time',ylab='value')
par(op)
dev.off()
bitmap(file='pic1.png')
racf <- acf(x, par1, main='Autocorrelation', xlab='time lag', ylab='ACF', ci.type=par6, ci=par7, sub=mysub)
dev.off()
bitmap(file='pic2.png')
rpacf <- pacf(x,par1,main='Partial Autocorrelation',xlab='lags',ylab='PACF',sub=mysub)
dev.off()
(myacf <- c(racf$acf))
(mypacf <- c(rpacf$acf))
lengthx <- length(x)
sqrtn <- sqrt(lengthx)
load(file='createtable')
a<-table.start()
a<-table.row.start(a)
a<-table.element(a,'Autocorrelation Function',4,TRUE)
a<-table.row.end(a)
a<-table.row.start(a)
a<-table.element(a,'Time lag k',header=TRUE)
a<-table.element(a,hyperlink('basics.htm','ACF(k)','click here for more information about the Autocorrelation Function'),header=TRUE)
a<-table.element(a,'T-STAT',header=TRUE)
a<-table.element(a,'P-value',header=TRUE)
a<-table.row.end(a)
for (i in 2:(par1+1)) {
a<-table.row.start(a)
a<-table.element(a,i-1,header=TRUE)
a<-table.element(a,round(myacf[i],6))
mytstat <- myacf[i]*sqrtn
a<-table.element(a,round(mytstat,4))
a<-table.element(a,round(1-pt(abs(mytstat),lengthx),6))
a<-table.row.end(a)
}
a<-table.end(a)
table.save(a,file='mytable.tab')
a<-table.start()
a<-table.row.start(a)
a<-table.element(a,'Partial Autocorrelation Function',4,TRUE)
a<-table.row.end(a)
a<-table.row.start(a)
a<-table.element(a,'Time lag k',header=TRUE)
a<-table.element(a,hyperlink('basics.htm','PACF(k)','click here for more information about the Partial Autocorrelation Function'),header=TRUE)
a<-table.element(a,'T-STAT',header=TRUE)
a<-table.element(a,'P-value',header=TRUE)
a<-table.row.end(a)
for (i in 1:par1) {
a<-table.row.start(a)
a<-table.element(a,i,header=TRUE)
a<-table.element(a,round(mypacf[i],6))
mytstat <- mypacf[i]*sqrtn
a<-table.element(a,round(mytstat,4))
a<-table.element(a,round(1-pt(abs(mytstat),lengthx),6))
a<-table.row.end(a)
}
a<-table.end(a)
table.save(a,file='mytable1.tab')