Free Statistics

of Irreproducible Research!

Author's title

Author*The author of this computation has been verified*
R Software Modulerwasp_autocorrelation.wasp
Title produced by software(Partial) Autocorrelation Function
Date of computationSun, 18 Dec 2016 14:22:52 +0100
Cite this page as followsStatistical Computations at FreeStatistics.org, Office for Research Development and Education, URL https://freestatistics.org/blog/index.php?v=date/2016/Dec/18/t1482067451mqclstf0wdbd0s6.htm/, Retrieved Fri, 01 Nov 2024 05:25:30 +0000
Statistical Computations at FreeStatistics.org, Office for Research Development and Education, URL https://freestatistics.org/blog/index.php?pk=301066, Retrieved Fri, 01 Nov 2024 05:25:30 +0000
QR Codes:

Original text written by user:
IsPrivate?No (this computation is public)
User-defined keywords
Estimated Impact82
Family? (F = Feedback message, R = changed R code, M = changed R Module, P = changed Parameters, D = changed Data)
-       [(Partial) Autocorrelation Function] [] [2016-12-18 13:22:52] [94ac3c9a028ddd47e8862e80eac9f626] [Current]
Feedback Forum

Post a new message
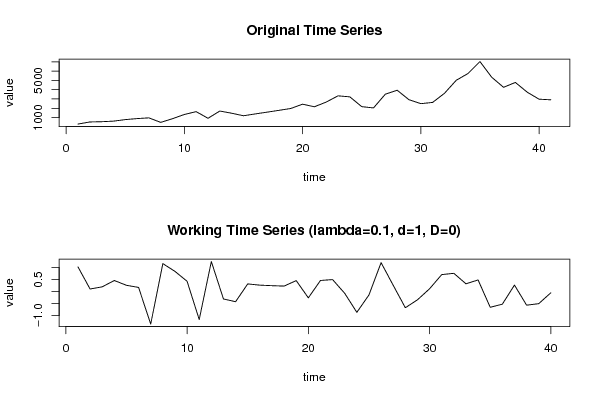
Dataseries X:
295
520
550
610
775
885
965
475
875
1330
1635
920
1700
1465
1190
1390
1580
1775
1975
2440
2160
2670
3340
3230
2175
2035
3520
3945
2920
2495
2630
3610
5020
5755
7040
5345
4260
4785
3735
2980
2910


Summary of computational transaction
Raw Input view raw input (R code)
Raw Outputview raw output of R engine
Computing time1 seconds
R ServerBig Analytics Cloud Computing Center

\begin{tabular}{lllllllll}
\hline
Summary of computational transaction \tabularnewline
Raw Input view raw input (R code)  \tabularnewline
Raw Outputview raw output of R engine  \tabularnewline
Computing time1 seconds \tabularnewline
R ServerBig Analytics Cloud Computing Center \tabularnewline
\hline
\end{tabular}
%Source: https://freestatistics.org/blog/index.php?pk=301066&T=0

[TABLE]
[ROW]
Summary of computational transaction[/C][/ROW] [ROW]Raw Input[/C] view raw input (R code) [/C][/ROW] [ROW]Raw Output[/C]view raw output of R engine [/C][/ROW] [ROW]Computing time[/C]1 seconds[/C][/ROW] [ROW]R Server[/C]Big Analytics Cloud Computing Center[/C][/ROW] [/TABLE] Source: https://freestatistics.org/blog/index.php?pk=301066&T=0

Globally Unique Identifier (entire table): ba.freestatistics.org/blog/index.php?pk=301066&T=0

As an alternative you can also use a QR Code:  

The GUIDs for individual cells are displayed in the table below:

Summary of computational transaction
Raw Input view raw input (R code)
Raw Outputview raw output of R engine
Computing time1 seconds
R ServerBig Analytics Cloud Computing Center


Autocorrelation Function
Time lag kACF(k)T-STATP-value
1-0.07996-0.50570.307917
2-0.267912-1.69440.048979
3-0.09143-0.57830.283167
40.2338371.47890.073497
5-0.112177-0.70950.241074
6-0.107903-0.68240.249447
70.0949240.60040.275828
8-0.055841-0.35320.362909
9-0.007714-0.04880.480666
10-0.028614-0.1810.428653
110.1770361.11970.134765
12-0.142077-0.89860.187128
130.0281260.17790.429856
140.1167590.73840.232276
15-0.050026-0.31640.376675
16-0.071436-0.45180.326925

\begin{tabular}{lllllllll}
\hline
Autocorrelation Function \tabularnewline
Time lag k & ACF(k) & T-STAT & P-value \tabularnewline
1 & -0.07996 & -0.5057 & 0.307917 \tabularnewline
2 & -0.267912 & -1.6944 & 0.048979 \tabularnewline
3 & -0.09143 & -0.5783 & 0.283167 \tabularnewline
4 & 0.233837 & 1.4789 & 0.073497 \tabularnewline
5 & -0.112177 & -0.7095 & 0.241074 \tabularnewline
6 & -0.107903 & -0.6824 & 0.249447 \tabularnewline
7 & 0.094924 & 0.6004 & 0.275828 \tabularnewline
8 & -0.055841 & -0.3532 & 0.362909 \tabularnewline
9 & -0.007714 & -0.0488 & 0.480666 \tabularnewline
10 & -0.028614 & -0.181 & 0.428653 \tabularnewline
11 & 0.177036 & 1.1197 & 0.134765 \tabularnewline
12 & -0.142077 & -0.8986 & 0.187128 \tabularnewline
13 & 0.028126 & 0.1779 & 0.429856 \tabularnewline
14 & 0.116759 & 0.7384 & 0.232276 \tabularnewline
15 & -0.050026 & -0.3164 & 0.376675 \tabularnewline
16 & -0.071436 & -0.4518 & 0.326925 \tabularnewline
\hline
\end{tabular}
%Source: https://freestatistics.org/blog/index.php?pk=301066&T=1

[TABLE]
[ROW][C]Autocorrelation Function[/C][/ROW]
[ROW][C]Time lag k[/C][C]ACF(k)[/C][C]T-STAT[/C][C]P-value[/C][/ROW]
[ROW][C]1[/C][C]-0.07996[/C][C]-0.5057[/C][C]0.307917[/C][/ROW]
[ROW][C]2[/C][C]-0.267912[/C][C]-1.6944[/C][C]0.048979[/C][/ROW]
[ROW][C]3[/C][C]-0.09143[/C][C]-0.5783[/C][C]0.283167[/C][/ROW]
[ROW][C]4[/C][C]0.233837[/C][C]1.4789[/C][C]0.073497[/C][/ROW]
[ROW][C]5[/C][C]-0.112177[/C][C]-0.7095[/C][C]0.241074[/C][/ROW]
[ROW][C]6[/C][C]-0.107903[/C][C]-0.6824[/C][C]0.249447[/C][/ROW]
[ROW][C]7[/C][C]0.094924[/C][C]0.6004[/C][C]0.275828[/C][/ROW]
[ROW][C]8[/C][C]-0.055841[/C][C]-0.3532[/C][C]0.362909[/C][/ROW]
[ROW][C]9[/C][C]-0.007714[/C][C]-0.0488[/C][C]0.480666[/C][/ROW]
[ROW][C]10[/C][C]-0.028614[/C][C]-0.181[/C][C]0.428653[/C][/ROW]
[ROW][C]11[/C][C]0.177036[/C][C]1.1197[/C][C]0.134765[/C][/ROW]
[ROW][C]12[/C][C]-0.142077[/C][C]-0.8986[/C][C]0.187128[/C][/ROW]
[ROW][C]13[/C][C]0.028126[/C][C]0.1779[/C][C]0.429856[/C][/ROW]
[ROW][C]14[/C][C]0.116759[/C][C]0.7384[/C][C]0.232276[/C][/ROW]
[ROW][C]15[/C][C]-0.050026[/C][C]-0.3164[/C][C]0.376675[/C][/ROW]
[ROW][C]16[/C][C]-0.071436[/C][C]-0.4518[/C][C]0.326925[/C][/ROW]
[/TABLE]
Source: https://freestatistics.org/blog/index.php?pk=301066&T=1

Globally Unique Identifier (entire table): ba.freestatistics.org/blog/index.php?pk=301066&T=1

As an alternative you can also use a QR Code:  

The GUIDs for individual cells are displayed in the table below:

Autocorrelation Function
Time lag kACF(k)T-STATP-value
1-0.07996-0.50570.307917
2-0.267912-1.69440.048979
3-0.09143-0.57830.283167
40.2338371.47890.073497
5-0.112177-0.70950.241074
6-0.107903-0.68240.249447
70.0949240.60040.275828
8-0.055841-0.35320.362909
9-0.007714-0.04880.480666
10-0.028614-0.1810.428653
110.1770361.11970.134765
12-0.142077-0.89860.187128
130.0281260.17790.429856
140.1167590.73840.232276
15-0.050026-0.31640.376675
16-0.071436-0.45180.326925


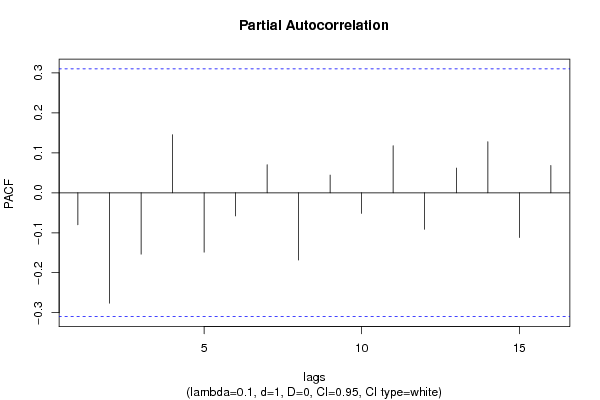
Partial Autocorrelation Function
Time lag kPACF(k)T-STATP-value
1-0.07996-0.50570.307917
2-0.27607-1.7460.044242
3-0.153442-0.97040.168827
40.1452790.91880.181847
5-0.148509-0.93930.176619
6-0.057788-0.36550.358339
70.0701190.44350.329907
8-0.168308-1.06450.146749
90.0442790.280.390443
10-0.051586-0.32630.372964
110.1176910.74430.230511
12-0.091438-0.57830.28315
130.0617090.39030.349199
140.1278440.80860.211777
15-0.111698-0.70640.242005
160.0683030.4320.334036

\begin{tabular}{lllllllll}
\hline
Partial Autocorrelation Function \tabularnewline
Time lag k & PACF(k) & T-STAT & P-value \tabularnewline
1 & -0.07996 & -0.5057 & 0.307917 \tabularnewline
2 & -0.27607 & -1.746 & 0.044242 \tabularnewline
3 & -0.153442 & -0.9704 & 0.168827 \tabularnewline
4 & 0.145279 & 0.9188 & 0.181847 \tabularnewline
5 & -0.148509 & -0.9393 & 0.176619 \tabularnewline
6 & -0.057788 & -0.3655 & 0.358339 \tabularnewline
7 & 0.070119 & 0.4435 & 0.329907 \tabularnewline
8 & -0.168308 & -1.0645 & 0.146749 \tabularnewline
9 & 0.044279 & 0.28 & 0.390443 \tabularnewline
10 & -0.051586 & -0.3263 & 0.372964 \tabularnewline
11 & 0.117691 & 0.7443 & 0.230511 \tabularnewline
12 & -0.091438 & -0.5783 & 0.28315 \tabularnewline
13 & 0.061709 & 0.3903 & 0.349199 \tabularnewline
14 & 0.127844 & 0.8086 & 0.211777 \tabularnewline
15 & -0.111698 & -0.7064 & 0.242005 \tabularnewline
16 & 0.068303 & 0.432 & 0.334036 \tabularnewline
\hline
\end{tabular}
%Source: https://freestatistics.org/blog/index.php?pk=301066&T=2

[TABLE]
[ROW][C]Partial Autocorrelation Function[/C][/ROW]
[ROW][C]Time lag k[/C][C]PACF(k)[/C][C]T-STAT[/C][C]P-value[/C][/ROW]
[ROW][C]1[/C][C]-0.07996[/C][C]-0.5057[/C][C]0.307917[/C][/ROW]
[ROW][C]2[/C][C]-0.27607[/C][C]-1.746[/C][C]0.044242[/C][/ROW]
[ROW][C]3[/C][C]-0.153442[/C][C]-0.9704[/C][C]0.168827[/C][/ROW]
[ROW][C]4[/C][C]0.145279[/C][C]0.9188[/C][C]0.181847[/C][/ROW]
[ROW][C]5[/C][C]-0.148509[/C][C]-0.9393[/C][C]0.176619[/C][/ROW]
[ROW][C]6[/C][C]-0.057788[/C][C]-0.3655[/C][C]0.358339[/C][/ROW]
[ROW][C]7[/C][C]0.070119[/C][C]0.4435[/C][C]0.329907[/C][/ROW]
[ROW][C]8[/C][C]-0.168308[/C][C]-1.0645[/C][C]0.146749[/C][/ROW]
[ROW][C]9[/C][C]0.044279[/C][C]0.28[/C][C]0.390443[/C][/ROW]
[ROW][C]10[/C][C]-0.051586[/C][C]-0.3263[/C][C]0.372964[/C][/ROW]
[ROW][C]11[/C][C]0.117691[/C][C]0.7443[/C][C]0.230511[/C][/ROW]
[ROW][C]12[/C][C]-0.091438[/C][C]-0.5783[/C][C]0.28315[/C][/ROW]
[ROW][C]13[/C][C]0.061709[/C][C]0.3903[/C][C]0.349199[/C][/ROW]
[ROW][C]14[/C][C]0.127844[/C][C]0.8086[/C][C]0.211777[/C][/ROW]
[ROW][C]15[/C][C]-0.111698[/C][C]-0.7064[/C][C]0.242005[/C][/ROW]
[ROW][C]16[/C][C]0.068303[/C][C]0.432[/C][C]0.334036[/C][/ROW]
[/TABLE]
Source: https://freestatistics.org/blog/index.php?pk=301066&T=2

Globally Unique Identifier (entire table): ba.freestatistics.org/blog/index.php?pk=301066&T=2

As an alternative you can also use a QR Code:  

The GUIDs for individual cells are displayed in the table below:

Partial Autocorrelation Function
Time lag kPACF(k)T-STATP-value
1-0.07996-0.50570.307917
2-0.27607-1.7460.044242
3-0.153442-0.97040.168827
40.1452790.91880.181847
5-0.148509-0.93930.176619
6-0.057788-0.36550.358339
70.0701190.44350.329907
8-0.168308-1.06450.146749
90.0442790.280.390443
10-0.051586-0.32630.372964
110.1176910.74430.230511
12-0.091438-0.57830.28315
130.0617090.39030.349199
140.1278440.80860.211777
15-0.111698-0.70640.242005
160.0683030.4320.334036


Parameters (Session):
par1 = 1 ; par2 = 1 ; par3 = 0 ; par4 = 12 ;
Parameters (R input):
par1 = Default ; par2 = 0.1 ; par3 = 1 ; par4 = 0 ; par5 = 12 ; par6 = White Noise ; par7 = 0.95 ; par8 = ;
R code (references can be found in the software module):
if (par1 == 'Default') {
par1 = 10*log10(length(x))
} else {
par1 <- as.numeric(par1)
}
par2 <- as.numeric(par2)
par3 <- as.numeric(par3)
par4 <- as.numeric(par4)
par5 <- as.numeric(par5)
if (par6 == 'White Noise') par6 <- 'white' else par6 <- 'ma'
par7 <- as.numeric(par7)
if (par8 != '') par8 <- as.numeric(par8)
x <- na.omit(x)
ox <- x
if (par8 == '') {
if (par2 == 0) {
x <- log(x)
} else {
x <- (x ^ par2 - 1) / par2
}
} else {
x <- log(x,base=par8)
}
if (par3 > 0) x <- diff(x,lag=1,difference=par3)
if (par4 > 0) x <- diff(x,lag=par5,difference=par4)
bitmap(file='picts.png')
op <- par(mfrow=c(2,1))
plot(ox,type='l',main='Original Time Series',xlab='time',ylab='value')
if (par8=='') {
mytitle <- paste('Working Time Series (lambda=',par2,', d=',par3,', D=',par4,')',sep='')
mysub <- paste('(lambda=',par2,', d=',par3,', D=',par4,', CI=', par7, ', CI type=',par6,')',sep='')
} else {
mytitle <- paste('Working Time Series (base=',par8,', d=',par3,', D=',par4,')',sep='')
mysub <- paste('(base=',par8,', d=',par3,', D=',par4,', CI=', par7, ', CI type=',par6,')',sep='')
}
plot(x,type='l', main=mytitle,xlab='time',ylab='value')
par(op)
dev.off()
bitmap(file='pic1.png')
racf <- acf(x, par1, main='Autocorrelation', xlab='time lag', ylab='ACF', ci.type=par6, ci=par7, sub=mysub)
dev.off()
bitmap(file='pic2.png')
rpacf <- pacf(x,par1,main='Partial Autocorrelation',xlab='lags',ylab='PACF',sub=mysub)
dev.off()
(myacf <- c(racf$acf))
(mypacf <- c(rpacf$acf))
lengthx <- length(x)
sqrtn <- sqrt(lengthx)
load(file='createtable')
a<-table.start()
a<-table.row.start(a)
a<-table.element(a,'Autocorrelation Function',4,TRUE)
a<-table.row.end(a)
a<-table.row.start(a)
a<-table.element(a,'Time lag k',header=TRUE)
a<-table.element(a,'ACF(k)',header=TRUE)
a<-table.element(a,'T-STAT',header=TRUE)
a<-table.element(a,'P-value',header=TRUE)
a<-table.row.end(a)
for (i in 2:(par1+1)) {
a<-table.row.start(a)
a<-table.element(a,i-1,header=TRUE)
a<-table.element(a,round(myacf[i],6))
mytstat <- myacf[i]*sqrtn
a<-table.element(a,round(mytstat,4))
a<-table.element(a,round(1-pt(abs(mytstat),lengthx),6))
a<-table.row.end(a)
}
a<-table.end(a)
table.save(a,file='mytable.tab')
a<-table.start()
a<-table.row.start(a)
a<-table.element(a,'Partial Autocorrelation Function',4,TRUE)
a<-table.row.end(a)
a<-table.row.start(a)
a<-table.element(a,'Time lag k',header=TRUE)
a<-table.element(a,'PACF(k)',header=TRUE)
a<-table.element(a,'T-STAT',header=TRUE)
a<-table.element(a,'P-value',header=TRUE)
a<-table.row.end(a)
for (i in 1:par1) {
a<-table.row.start(a)
a<-table.element(a,i,header=TRUE)
a<-table.element(a,round(mypacf[i],6))
mytstat <- mypacf[i]*sqrtn
a<-table.element(a,round(mytstat,4))
a<-table.element(a,round(1-pt(abs(mytstat),lengthx),6))
a<-table.row.end(a)
}
a<-table.end(a)
table.save(a,file='mytable1.tab')