\begin{tabular}{lllllllll}
\hline
Summary of computational transaction \tabularnewline
Raw Input & view raw input (R code)  \tabularnewline
Raw Output & view raw output of R engine  \tabularnewline
Computing time & 2 seconds \tabularnewline
R Server & 'RServer@AstonUniversity' @ vre.aston.ac.uk \tabularnewline
\hline
\end{tabular}
%Source: https://freestatistics.org/blog/index.php?pk=47352&T=0
[TABLE]
[ROW][C]Summary of computational transaction[/C][/ROW]
[ROW][C]Raw Input[/C][C]view raw input (R code) [/C][/ROW]
[ROW][C]Raw Output[/C][C]view raw output of R engine [/C][/ROW]
[ROW][C]Computing time[/C][C]2 seconds[/C][/ROW]
[ROW][C]R Server[/C][C]'RServer@AstonUniversity' @ vre.aston.ac.uk[/C][/ROW]
[/TABLE]
Source: https://freestatistics.org/blog/index.php?pk=47352&T=0
If you paste this QR Code into your document, anyone with a smartphone or tablet will be able to scan it and view this table in a browser.
If you paste this QR Code into your document, anyone with a smartphone or tablet will be able to scan it and view this table in a browser.
If you paste this QR Code into your document, anyone with a smartphone or tablet will be able to scan it and view this table in a browser.
If you paste this QR Code into your document, anyone with a smartphone or tablet will be able to scan it and view this table in a browser.
If you paste this QR Code into your document, anyone with a smartphone or tablet will be able to scan it and view this table in a browser.
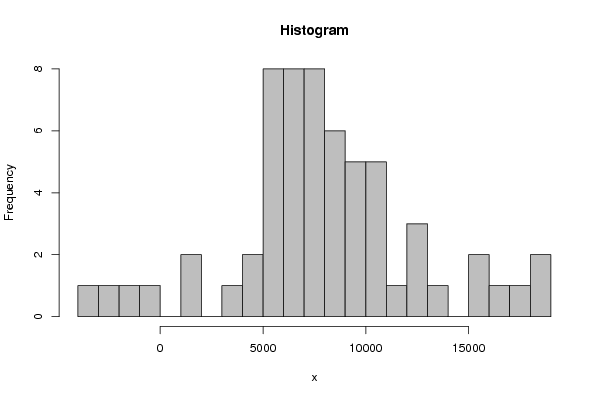
| Frequency Table (Histogram) | | Bins | Midpoint | Abs. Frequency | Rel. Frequency | Cumul. Rel. Freq. | Density | | [-4000,-3000[ | -3500 | 1 | 0.016667 | 0.016667 | 1.7e-05 | | [-3000,-2000[ | -2500 | 1 | 0.016667 | 0.033333 | 1.7e-05 | | [-2000,-1000[ | -1500 | 1 | 0.016667 | 0.05 | 1.7e-05 | | [-1000,0[ | -500 | 1 | 0.016667 | 0.066667 | 1.7e-05 | | [0,1000[ | 500 | 0 | 0 | 0.066667 | 0 | | [1000,2000[ | 1500 | 2 | 0.033333 | 0.1 | 3.3e-05 | | [2000,3000[ | 2500 | 0 | 0 | 0.1 | 0 | | [3000,4000[ | 3500 | 1 | 0.016667 | 0.116667 | 1.7e-05 | | [4000,5000[ | 4500 | 2 | 0.033333 | 0.15 | 3.3e-05 | | [5000,6000[ | 5500 | 8 | 0.133333 | 0.283333 | 0.000133 | | [6000,7000[ | 6500 | 8 | 0.133333 | 0.416667 | 0.000133 | | [7000,8000[ | 7500 | 8 | 0.133333 | 0.55 | 0.000133 | | [8000,9000[ | 8500 | 6 | 0.1 | 0.65 | 1e-04 | | [9000,10000[ | 9500 | 5 | 0.083333 | 0.733333 | 8.3e-05 | | [10000,11000[ | 10500 | 5 | 0.083333 | 0.816667 | 8.3e-05 | | [11000,12000[ | 11500 | 1 | 0.016667 | 0.833333 | 1.7e-05 | | [12000,13000[ | 12500 | 3 | 0.05 | 0.883333 | 5e-05 | | [13000,14000[ | 13500 | 1 | 0.016667 | 0.9 | 1.7e-05 | | [14000,15000[ | 14500 | 0 | 0 | 0.9 | 0 | | [15000,16000[ | 15500 | 2 | 0.033333 | 0.933333 | 3.3e-05 | | [16000,17000[ | 16500 | 1 | 0.016667 | 0.95 | 1.7e-05 | | [17000,18000[ | 17500 | 1 | 0.016667 | 0.966667 | 1.7e-05 | | [18000,19000] | 18500 | 2 | 0.033333 | 1 | 3.3e-05 |
\begin{tabular}{lllllllll}
\hline
Frequency Table (Histogram) \tabularnewline
Bins & Midpoint & Abs. Frequency & Rel. Frequency & Cumul. Rel. Freq. & Density \tabularnewline
[-4000,-3000[ & -3500 & 1 & 0.016667 & 0.016667 & 1.7e-05 \tabularnewline
[-3000,-2000[ & -2500 & 1 & 0.016667 & 0.033333 & 1.7e-05 \tabularnewline
[-2000,-1000[ & -1500 & 1 & 0.016667 & 0.05 & 1.7e-05 \tabularnewline
[-1000,0[ & -500 & 1 & 0.016667 & 0.066667 & 1.7e-05 \tabularnewline
[0,1000[ & 500 & 0 & 0 & 0.066667 & 0 \tabularnewline
[1000,2000[ & 1500 & 2 & 0.033333 & 0.1 & 3.3e-05 \tabularnewline
[2000,3000[ & 2500 & 0 & 0 & 0.1 & 0 \tabularnewline
[3000,4000[ & 3500 & 1 & 0.016667 & 0.116667 & 1.7e-05 \tabularnewline
[4000,5000[ & 4500 & 2 & 0.033333 & 0.15 & 3.3e-05 \tabularnewline
[5000,6000[ & 5500 & 8 & 0.133333 & 0.283333 & 0.000133 \tabularnewline
[6000,7000[ & 6500 & 8 & 0.133333 & 0.416667 & 0.000133 \tabularnewline
[7000,8000[ & 7500 & 8 & 0.133333 & 0.55 & 0.000133 \tabularnewline
[8000,9000[ & 8500 & 6 & 0.1 & 0.65 & 1e-04 \tabularnewline
[9000,10000[ & 9500 & 5 & 0.083333 & 0.733333 & 8.3e-05 \tabularnewline
[10000,11000[ & 10500 & 5 & 0.083333 & 0.816667 & 8.3e-05 \tabularnewline
[11000,12000[ & 11500 & 1 & 0.016667 & 0.833333 & 1.7e-05 \tabularnewline
[12000,13000[ & 12500 & 3 & 0.05 & 0.883333 & 5e-05 \tabularnewline
[13000,14000[ & 13500 & 1 & 0.016667 & 0.9 & 1.7e-05 \tabularnewline
[14000,15000[ & 14500 & 0 & 0 & 0.9 & 0 \tabularnewline
[15000,16000[ & 15500 & 2 & 0.033333 & 0.933333 & 3.3e-05 \tabularnewline
[16000,17000[ & 16500 & 1 & 0.016667 & 0.95 & 1.7e-05 \tabularnewline
[17000,18000[ & 17500 & 1 & 0.016667 & 0.966667 & 1.7e-05 \tabularnewline
[18000,19000] & 18500 & 2 & 0.033333 & 1 & 3.3e-05 \tabularnewline
\hline
\end{tabular}
%Source: https://freestatistics.org/blog/index.php?pk=47352&T=1
[TABLE]
[ROW][C]Frequency Table (Histogram)[/C][/ROW]
[ROW][C]Bins[/C][C]Midpoint[/C][C]Abs. Frequency[/C][C]Rel. Frequency[/C][C]Cumul. Rel. Freq.[/C][C]Density[/C][/ROW]
[ROW][C][-4000,-3000[[/C][C]-3500[/C][C]1[/C][C]0.016667[/C][C]0.016667[/C][C]1.7e-05[/C][/ROW]
[ROW][C][-3000,-2000[[/C][C]-2500[/C][C]1[/C][C]0.016667[/C][C]0.033333[/C][C]1.7e-05[/C][/ROW]
[ROW][C][-2000,-1000[[/C][C]-1500[/C][C]1[/C][C]0.016667[/C][C]0.05[/C][C]1.7e-05[/C][/ROW]
[ROW][C][-1000,0[[/C][C]-500[/C][C]1[/C][C]0.016667[/C][C]0.066667[/C][C]1.7e-05[/C][/ROW]
[ROW][C][0,1000[[/C][C]500[/C][C]0[/C][C]0[/C][C]0.066667[/C][C]0[/C][/ROW]
[ROW][C][1000,2000[[/C][C]1500[/C][C]2[/C][C]0.033333[/C][C]0.1[/C][C]3.3e-05[/C][/ROW]
[ROW][C][2000,3000[[/C][C]2500[/C][C]0[/C][C]0[/C][C]0.1[/C][C]0[/C][/ROW]
[ROW][C][3000,4000[[/C][C]3500[/C][C]1[/C][C]0.016667[/C][C]0.116667[/C][C]1.7e-05[/C][/ROW]
[ROW][C][4000,5000[[/C][C]4500[/C][C]2[/C][C]0.033333[/C][C]0.15[/C][C]3.3e-05[/C][/ROW]
[ROW][C][5000,6000[[/C][C]5500[/C][C]8[/C][C]0.133333[/C][C]0.283333[/C][C]0.000133[/C][/ROW]
[ROW][C][6000,7000[[/C][C]6500[/C][C]8[/C][C]0.133333[/C][C]0.416667[/C][C]0.000133[/C][/ROW]
[ROW][C][7000,8000[[/C][C]7500[/C][C]8[/C][C]0.133333[/C][C]0.55[/C][C]0.000133[/C][/ROW]
[ROW][C][8000,9000[[/C][C]8500[/C][C]6[/C][C]0.1[/C][C]0.65[/C][C]1e-04[/C][/ROW]
[ROW][C][9000,10000[[/C][C]9500[/C][C]5[/C][C]0.083333[/C][C]0.733333[/C][C]8.3e-05[/C][/ROW]
[ROW][C][10000,11000[[/C][C]10500[/C][C]5[/C][C]0.083333[/C][C]0.816667[/C][C]8.3e-05[/C][/ROW]
[ROW][C][11000,12000[[/C][C]11500[/C][C]1[/C][C]0.016667[/C][C]0.833333[/C][C]1.7e-05[/C][/ROW]
[ROW][C][12000,13000[[/C][C]12500[/C][C]3[/C][C]0.05[/C][C]0.883333[/C][C]5e-05[/C][/ROW]
[ROW][C][13000,14000[[/C][C]13500[/C][C]1[/C][C]0.016667[/C][C]0.9[/C][C]1.7e-05[/C][/ROW]
[ROW][C][14000,15000[[/C][C]14500[/C][C]0[/C][C]0[/C][C]0.9[/C][C]0[/C][/ROW]
[ROW][C][15000,16000[[/C][C]15500[/C][C]2[/C][C]0.033333[/C][C]0.933333[/C][C]3.3e-05[/C][/ROW]
[ROW][C][16000,17000[[/C][C]16500[/C][C]1[/C][C]0.016667[/C][C]0.95[/C][C]1.7e-05[/C][/ROW]
[ROW][C][17000,18000[[/C][C]17500[/C][C]1[/C][C]0.016667[/C][C]0.966667[/C][C]1.7e-05[/C][/ROW]
[ROW][C][18000,19000][/C][C]18500[/C][C]2[/C][C]0.033333[/C][C]1[/C][C]3.3e-05[/C][/ROW]
[/TABLE]
Source: https://freestatistics.org/blog/index.php?pk=47352&T=1
Globally Unique Identifier (entire table): ba.freestatistics.org/blog/index.php?pk=47352&T=1
As an alternative you can also use a QR Code:
The GUIDs for individual cells are displayed in the table below:
| Frequency Table (Histogram) | | Bins | Midpoint | Abs. Frequency | Rel. Frequency | Cumul. Rel. Freq. | Density | | [-4000,-3000[ | -3500 | 1 | 0.016667 | 0.016667 | 1.7e-05 | | [-3000,-2000[ | -2500 | 1 | 0.016667 | 0.033333 | 1.7e-05 | | [-2000,-1000[ | -1500 | 1 | 0.016667 | 0.05 | 1.7e-05 | | [-1000,0[ | -500 | 1 | 0.016667 | 0.066667 | 1.7e-05 | | [0,1000[ | 500 | 0 | 0 | 0.066667 | 0 | | [1000,2000[ | 1500 | 2 | 0.033333 | 0.1 | 3.3e-05 | | [2000,3000[ | 2500 | 0 | 0 | 0.1 | 0 | | [3000,4000[ | 3500 | 1 | 0.016667 | 0.116667 | 1.7e-05 | | [4000,5000[ | 4500 | 2 | 0.033333 | 0.15 | 3.3e-05 | | [5000,6000[ | 5500 | 8 | 0.133333 | 0.283333 | 0.000133 | | [6000,7000[ | 6500 | 8 | 0.133333 | 0.416667 | 0.000133 | | [7000,8000[ | 7500 | 8 | 0.133333 | 0.55 | 0.000133 | | [8000,9000[ | 8500 | 6 | 0.1 | 0.65 | 1e-04 | | [9000,10000[ | 9500 | 5 | 0.083333 | 0.733333 | 8.3e-05 | | [10000,11000[ | 10500 | 5 | 0.083333 | 0.816667 | 8.3e-05 | | [11000,12000[ | 11500 | 1 | 0.016667 | 0.833333 | 1.7e-05 | | [12000,13000[ | 12500 | 3 | 0.05 | 0.883333 | 5e-05 | | [13000,14000[ | 13500 | 1 | 0.016667 | 0.9 | 1.7e-05 | | [14000,15000[ | 14500 | 0 | 0 | 0.9 | 0 | | [15000,16000[ | 15500 | 2 | 0.033333 | 0.933333 | 3.3e-05 | | [16000,17000[ | 16500 | 1 | 0.016667 | 0.95 | 1.7e-05 | | [17000,18000[ | 17500 | 1 | 0.016667 | 0.966667 | 1.7e-05 | | [18000,19000] | 18500 | 2 | 0.033333 | 1 | 3.3e-05 |
If you paste this QR Code into your document, anyone with a smartphone or tablet will be able to scan it and view this table in a browser.
If you paste this QR Code into your document, anyone with a smartphone or tablet will be able to scan it and view this table in a browser.
If you paste this QR Code into your document, anyone with a smartphone or tablet will be able to scan it and view this table in a browser.
If you paste this QR Code into your document, anyone with a smartphone or tablet will be able to scan it and view this table in a browser.
If you paste this QR Code into your document, anyone with a smartphone or tablet will be able to scan it and view this table in a browser.
|