Free Statistics
of Irreproducible Research!
Description of Statistical Computation | |||||||||||||||||||||
|---|---|---|---|---|---|---|---|---|---|---|---|---|---|---|---|---|---|---|---|---|---|
| Author's title | |||||||||||||||||||||
| Author | *The author of this computation has been verified* | ||||||||||||||||||||
| R Software Module | rwasp_cloud.wasp | ||||||||||||||||||||
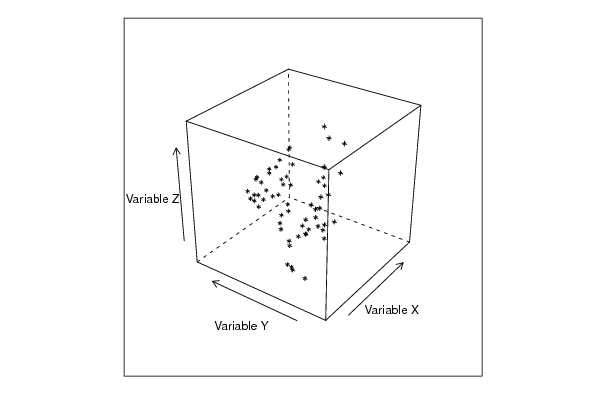
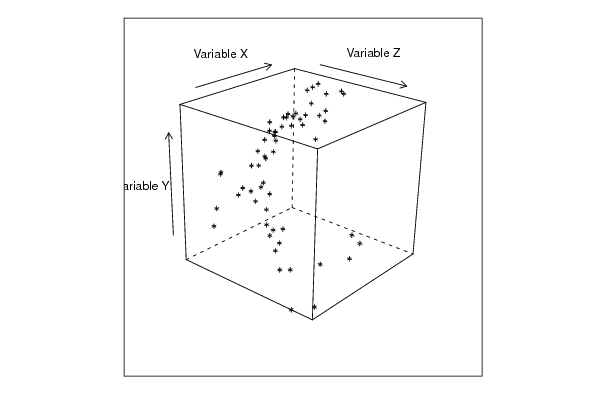
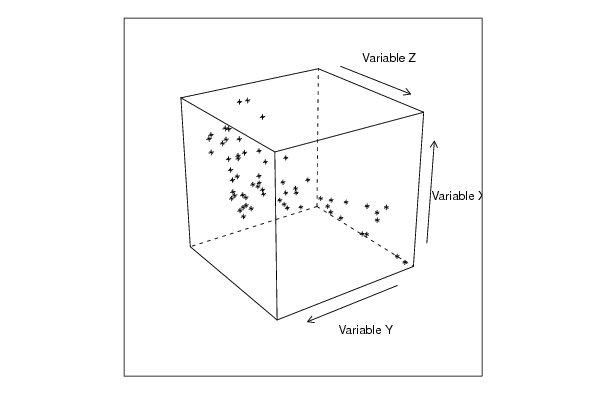
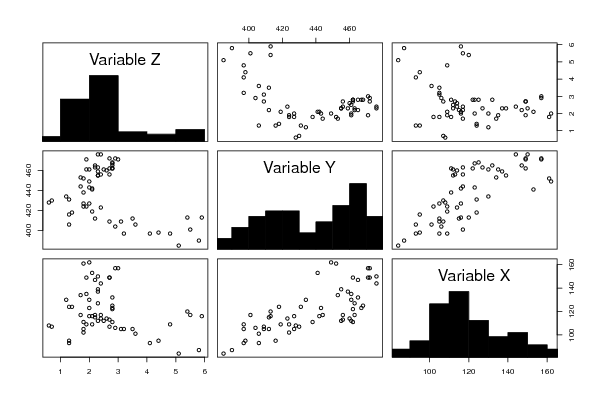
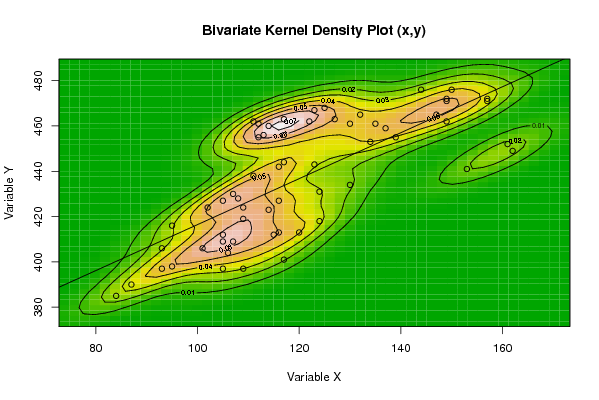
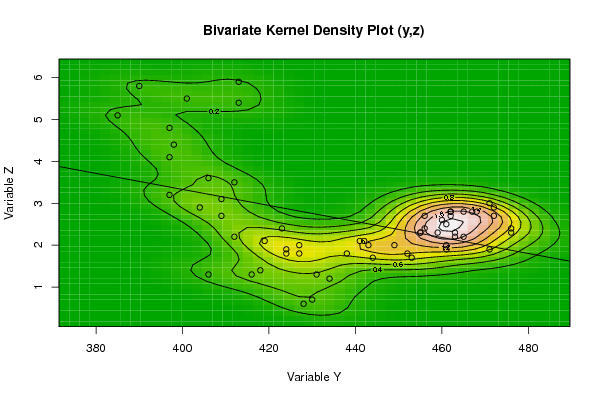
| Title produced by software | Trivariate Scatterplots | ||||||||||||||||||||
| Date of computation | Wed, 04 Nov 2009 03:58:34 -0700 | ||||||||||||||||||||
| Cite this page as follows | Statistical Computations at FreeStatistics.org, Office for Research Development and Education, URL https://freestatistics.org/blog/index.php?v=date/2009/Nov/04/t12573324013l4dxpimuiarh8o.htm/, Retrieved Thu, 16 May 2024 17:15:45 +0000 | ||||||||||||||||||||
| Statistical Computations at FreeStatistics.org, Office for Research Development and Education, URL https://freestatistics.org/blog/index.php?pk=53540, Retrieved Thu, 16 May 2024 17:15:45 +0000 | |||||||||||||||||||||
| QR Codes: | |||||||||||||||||||||
|
| |||||||||||||||||||||
| Original text written by user: | |||||||||||||||||||||
| IsPrivate? | No (this computation is public) | ||||||||||||||||||||
| User-defined keywords | |||||||||||||||||||||
| Estimated Impact | 147 | ||||||||||||||||||||
Tree of Dependent Computations | |||||||||||||||||||||
| Family? (F = Feedback message, R = changed R code, M = changed R Module, P = changed Parameters, D = changed Data) | |||||||||||||||||||||
| - [Trivariate Scatterplots] [WS 5: Trivariate ...] [2009-11-04 10:58:34] [b9056af0304697100f456398102f1287] [Current] - D [Trivariate Scatterplots] [WS 5: Trivariate ...] [2009-11-04 15:45:50] [b97b96148b0223bc16666763988dc147] | |||||||||||||||||||||
| Feedback Forum | |||||||||||||||||||||
Post a new message | |||||||||||||||||||||
Dataset | |||||||||||||||||||||
| Dataseries X: | |||||||||||||||||||||
114 116 153 162 161 149 139 135 130 127 122 117 112 113 149 157 157 147 137 132 125 123 117 114 111 112 144 150 149 134 123 116 117 111 105 102 95 93 124 130 124 115 106 105 105 101 95 93 84 87 116 120 117 109 105 107 109 109 108 107 | |||||||||||||||||||||
| Dataseries Y: | |||||||||||||||||||||
423 427 441 449 452 462 455 461 461 463 462 456 455 456 472 472 471 465 459 465 468 467 463 460 462 461 476 476 471 453 443 442 444 438 427 424 416 406 431 434 418 412 404 409 412 406 398 397 385 390 413 413 401 397 397 409 419 424 428 430 | |||||||||||||||||||||
| Dataseries Z: | |||||||||||||||||||||
2,4 2 2,1 2 1,8 2,7 2,3 1,9 2 2,3 2,8 2,4 2,3 2,7 2,7 2,9 3 2,2 2,3 2,8 2,8 2,8 2,2 2,6 2,8 2,5 2,4 2,3 1,9 1,7 2 2,1 1,7 1,8 1,8 1,8 1,3 1,3 1,3 1,2 1,4 2,2 2,9 3,1 3,5 3,6 4,4 4,1 5,1 5,8 5,9 5,4 5,5 4,8 3,2 2,7 2,1 1,9 0,6 0,7 | |||||||||||||||||||||
Tables (Output of Computation) | |||||||||||||||||||||
| |||||||||||||||||||||
Figures (Output of Computation) | |||||||||||||||||||||
Input Parameters & R Code | |||||||||||||||||||||
| Parameters (Session): | |||||||||||||||||||||
| par1 = 50 ; par2 = 50 ; par3 = Y ; par4 = Y ; par5 = Variable X ; par6 = Variable Y ; par7 = Variable Z ; | |||||||||||||||||||||
| Parameters (R input): | |||||||||||||||||||||
| par1 = 50 ; par2 = 50 ; par3 = Y ; par4 = Y ; par5 = Variable X ; par6 = Variable Y ; par7 = Variable Z ; | |||||||||||||||||||||
| R code (references can be found in the software module): | |||||||||||||||||||||
x <- array(x,dim=c(length(x),1)) | |||||||||||||||||||||