Free Statistics

of Irreproducible Research!

Author's title

Author*The author of this computation has been verified*
R Software Modulerwasp_autocorrelation.wasp
Title produced by software(Partial) Autocorrelation Function
Date of computationTue, 24 Nov 2009 12:01:14 -0700
Cite this page as followsStatistical Computations at FreeStatistics.org, Office for Research Development and Education, URL https://freestatistics.org/blog/index.php?v=date/2009/Nov/24/t1259089316kzvmuesuzhjrqhv.htm/, Retrieved Wed, 15 Jan 2025 10:47:00 +0000
Statistical Computations at FreeStatistics.org, Office for Research Development and Education, URL https://freestatistics.org/blog/index.php?pk=59229, Retrieved Wed, 15 Jan 2025 10:47:00 +0000
QR Codes:

Original text written by user:
IsPrivate?No (this computation is public)
User-defined keywordsws8autocorrelatie
Estimated Impact191
Family? (F = Feedback message, R = changed R code, M = changed R Module, P = changed Parameters, D = changed Data)
-       [(Partial) Autocorrelation Function] [] [2009-11-24 19:01:14] [4563e36d4b7005634fe3557528d9fcab] [Current]
Feedback Forum

Post a new message
Dataseries X:
7291
6820
8031
7862
7357
7213
7079
7012
7319
8148
7599
6908
7878
7407
7911
7323
7179
6758
6934
6696
7688
8296
7697
7907
7592
7710
9011
8225
7733
8062
7859
8221
8330
8868
9053
8811
8120
7953
8878
8601
8361
9116
9310
9891
10147
10317
10682
10276
10614
9413
11068
9772
10350
10541
10049
10714
10759
11684
11462
10485
11056
10184
11082
10554
11315
10847
11104
11026
11073
12073
12328
11172


Summary of computational transaction
Raw Inputview raw input (R code)
Raw Outputview raw output of R engine
Computing time1 seconds
R Server'Gwilym Jenkins' @ 72.249.127.135

\begin{tabular}{lllllllll}
\hline
Summary of computational transaction \tabularnewline
Raw Input & view raw input (R code)  \tabularnewline
Raw Output & view raw output of R engine  \tabularnewline
Computing time & 1 seconds \tabularnewline
R Server & 'Gwilym Jenkins' @ 72.249.127.135 \tabularnewline
\hline
\end{tabular}
%Source: https://freestatistics.org/blog/index.php?pk=59229&T=0

[TABLE]
[ROW][C]Summary of computational transaction[/C][/ROW]
[ROW][C]Raw Input[/C][C]view raw input (R code) [/C][/ROW]
[ROW][C]Raw Output[/C][C]view raw output of R engine [/C][/ROW]
[ROW][C]Computing time[/C][C]1 seconds[/C][/ROW]
[ROW][C]R Server[/C][C]'Gwilym Jenkins' @ 72.249.127.135[/C][/ROW]
[/TABLE]
Source: https://freestatistics.org/blog/index.php?pk=59229&T=0

Globally Unique Identifier (entire table): ba.freestatistics.org/blog/index.php?pk=59229&T=0

As an alternative you can also use a QR Code:  

The GUIDs for individual cells are displayed in the table below:

Summary of computational transaction
Raw Inputview raw input (R code)
Raw Outputview raw output of R engine
Computing time1 seconds
R Server'Gwilym Jenkins' @ 72.249.127.135


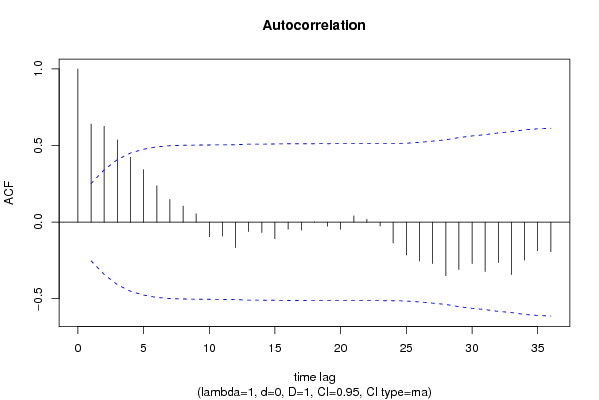
Autocorrelation Function
Time lag kACF(k)T-STATP-value
10.6411274.96613e-06
20.62594.84825e-06
30.5368124.15815.2e-05
40.4229743.27630.000875
50.3433632.65970.005008
60.2372891.8380.035505
70.1483391.1490.127551
80.1048360.81210.209986
90.0539760.41810.338686
10-0.095427-0.73920.231342
11-0.091199-0.70640.24133
12-0.166361-1.28860.101237
13-0.061232-0.47430.318504
14-0.067593-0.52360.301253
15-0.107693-0.83420.203742
16-0.045864-0.35530.36182
17-0.051923-0.40220.344486
180.0012780.00990.496068
19-0.026767-0.20730.418226
20-0.04722-0.36580.357913
210.0409460.31720.376109
220.0193050.14950.440817
23-0.025899-0.20060.420839
24-0.136679-1.05870.146988
25-0.214342-1.66030.051037
26-0.25328-1.96190.027209
27-0.270183-2.09280.020301
28-0.349734-2.7090.004391
29-0.308998-2.39350.009917
30-0.270804-2.09760.020079
31-0.322929-2.50140.007558
32-0.264044-2.04530.02261
33-0.342095-2.64990.00514
34-0.247378-1.91620.030055
35-0.186831-1.44720.076525
36-0.19282-1.49360.070263

\begin{tabular}{lllllllll}
\hline
Autocorrelation Function \tabularnewline
Time lag k & ACF(k) & T-STAT & P-value \tabularnewline
1 & 0.641127 & 4.9661 & 3e-06 \tabularnewline
2 & 0.6259 & 4.8482 & 5e-06 \tabularnewline
3 & 0.536812 & 4.1581 & 5.2e-05 \tabularnewline
4 & 0.422974 & 3.2763 & 0.000875 \tabularnewline
5 & 0.343363 & 2.6597 & 0.005008 \tabularnewline
6 & 0.237289 & 1.838 & 0.035505 \tabularnewline
7 & 0.148339 & 1.149 & 0.127551 \tabularnewline
8 & 0.104836 & 0.8121 & 0.209986 \tabularnewline
9 & 0.053976 & 0.4181 & 0.338686 \tabularnewline
10 & -0.095427 & -0.7392 & 0.231342 \tabularnewline
11 & -0.091199 & -0.7064 & 0.24133 \tabularnewline
12 & -0.166361 & -1.2886 & 0.101237 \tabularnewline
13 & -0.061232 & -0.4743 & 0.318504 \tabularnewline
14 & -0.067593 & -0.5236 & 0.301253 \tabularnewline
15 & -0.107693 & -0.8342 & 0.203742 \tabularnewline
16 & -0.045864 & -0.3553 & 0.36182 \tabularnewline
17 & -0.051923 & -0.4022 & 0.344486 \tabularnewline
18 & 0.001278 & 0.0099 & 0.496068 \tabularnewline
19 & -0.026767 & -0.2073 & 0.418226 \tabularnewline
20 & -0.04722 & -0.3658 & 0.357913 \tabularnewline
21 & 0.040946 & 0.3172 & 0.376109 \tabularnewline
22 & 0.019305 & 0.1495 & 0.440817 \tabularnewline
23 & -0.025899 & -0.2006 & 0.420839 \tabularnewline
24 & -0.136679 & -1.0587 & 0.146988 \tabularnewline
25 & -0.214342 & -1.6603 & 0.051037 \tabularnewline
26 & -0.25328 & -1.9619 & 0.027209 \tabularnewline
27 & -0.270183 & -2.0928 & 0.020301 \tabularnewline
28 & -0.349734 & -2.709 & 0.004391 \tabularnewline
29 & -0.308998 & -2.3935 & 0.009917 \tabularnewline
30 & -0.270804 & -2.0976 & 0.020079 \tabularnewline
31 & -0.322929 & -2.5014 & 0.007558 \tabularnewline
32 & -0.264044 & -2.0453 & 0.02261 \tabularnewline
33 & -0.342095 & -2.6499 & 0.00514 \tabularnewline
34 & -0.247378 & -1.9162 & 0.030055 \tabularnewline
35 & -0.186831 & -1.4472 & 0.076525 \tabularnewline
36 & -0.19282 & -1.4936 & 0.070263 \tabularnewline
\hline
\end{tabular}
%Source: https://freestatistics.org/blog/index.php?pk=59229&T=1

[TABLE]
[ROW][C]Autocorrelation Function[/C][/ROW]
[ROW][C]Time lag k[/C][C]ACF(k)[/C][C]T-STAT[/C][C]P-value[/C][/ROW]
[ROW][C]1[/C][C]0.641127[/C][C]4.9661[/C][C]3e-06[/C][/ROW]
[ROW][C]2[/C][C]0.6259[/C][C]4.8482[/C][C]5e-06[/C][/ROW]
[ROW][C]3[/C][C]0.536812[/C][C]4.1581[/C][C]5.2e-05[/C][/ROW]
[ROW][C]4[/C][C]0.422974[/C][C]3.2763[/C][C]0.000875[/C][/ROW]
[ROW][C]5[/C][C]0.343363[/C][C]2.6597[/C][C]0.005008[/C][/ROW]
[ROW][C]6[/C][C]0.237289[/C][C]1.838[/C][C]0.035505[/C][/ROW]
[ROW][C]7[/C][C]0.148339[/C][C]1.149[/C][C]0.127551[/C][/ROW]
[ROW][C]8[/C][C]0.104836[/C][C]0.8121[/C][C]0.209986[/C][/ROW]
[ROW][C]9[/C][C]0.053976[/C][C]0.4181[/C][C]0.338686[/C][/ROW]
[ROW][C]10[/C][C]-0.095427[/C][C]-0.7392[/C][C]0.231342[/C][/ROW]
[ROW][C]11[/C][C]-0.091199[/C][C]-0.7064[/C][C]0.24133[/C][/ROW]
[ROW][C]12[/C][C]-0.166361[/C][C]-1.2886[/C][C]0.101237[/C][/ROW]
[ROW][C]13[/C][C]-0.061232[/C][C]-0.4743[/C][C]0.318504[/C][/ROW]
[ROW][C]14[/C][C]-0.067593[/C][C]-0.5236[/C][C]0.301253[/C][/ROW]
[ROW][C]15[/C][C]-0.107693[/C][C]-0.8342[/C][C]0.203742[/C][/ROW]
[ROW][C]16[/C][C]-0.045864[/C][C]-0.3553[/C][C]0.36182[/C][/ROW]
[ROW][C]17[/C][C]-0.051923[/C][C]-0.4022[/C][C]0.344486[/C][/ROW]
[ROW][C]18[/C][C]0.001278[/C][C]0.0099[/C][C]0.496068[/C][/ROW]
[ROW][C]19[/C][C]-0.026767[/C][C]-0.2073[/C][C]0.418226[/C][/ROW]
[ROW][C]20[/C][C]-0.04722[/C][C]-0.3658[/C][C]0.357913[/C][/ROW]
[ROW][C]21[/C][C]0.040946[/C][C]0.3172[/C][C]0.376109[/C][/ROW]
[ROW][C]22[/C][C]0.019305[/C][C]0.1495[/C][C]0.440817[/C][/ROW]
[ROW][C]23[/C][C]-0.025899[/C][C]-0.2006[/C][C]0.420839[/C][/ROW]
[ROW][C]24[/C][C]-0.136679[/C][C]-1.0587[/C][C]0.146988[/C][/ROW]
[ROW][C]25[/C][C]-0.214342[/C][C]-1.6603[/C][C]0.051037[/C][/ROW]
[ROW][C]26[/C][C]-0.25328[/C][C]-1.9619[/C][C]0.027209[/C][/ROW]
[ROW][C]27[/C][C]-0.270183[/C][C]-2.0928[/C][C]0.020301[/C][/ROW]
[ROW][C]28[/C][C]-0.349734[/C][C]-2.709[/C][C]0.004391[/C][/ROW]
[ROW][C]29[/C][C]-0.308998[/C][C]-2.3935[/C][C]0.009917[/C][/ROW]
[ROW][C]30[/C][C]-0.270804[/C][C]-2.0976[/C][C]0.020079[/C][/ROW]
[ROW][C]31[/C][C]-0.322929[/C][C]-2.5014[/C][C]0.007558[/C][/ROW]
[ROW][C]32[/C][C]-0.264044[/C][C]-2.0453[/C][C]0.02261[/C][/ROW]
[ROW][C]33[/C][C]-0.342095[/C][C]-2.6499[/C][C]0.00514[/C][/ROW]
[ROW][C]34[/C][C]-0.247378[/C][C]-1.9162[/C][C]0.030055[/C][/ROW]
[ROW][C]35[/C][C]-0.186831[/C][C]-1.4472[/C][C]0.076525[/C][/ROW]
[ROW][C]36[/C][C]-0.19282[/C][C]-1.4936[/C][C]0.070263[/C][/ROW]
[/TABLE]
Source: https://freestatistics.org/blog/index.php?pk=59229&T=1

Globally Unique Identifier (entire table): ba.freestatistics.org/blog/index.php?pk=59229&T=1

As an alternative you can also use a QR Code:  

The GUIDs for individual cells are displayed in the table below:

Autocorrelation Function
Time lag kACF(k)T-STATP-value
10.6411274.96613e-06
20.62594.84825e-06
30.5368124.15815.2e-05
40.4229743.27630.000875
50.3433632.65970.005008
60.2372891.8380.035505
70.1483391.1490.127551
80.1048360.81210.209986
90.0539760.41810.338686
10-0.095427-0.73920.231342
11-0.091199-0.70640.24133
12-0.166361-1.28860.101237
13-0.061232-0.47430.318504
14-0.067593-0.52360.301253
15-0.107693-0.83420.203742
16-0.045864-0.35530.36182
17-0.051923-0.40220.344486
180.0012780.00990.496068
19-0.026767-0.20730.418226
20-0.04722-0.36580.357913
210.0409460.31720.376109
220.0193050.14950.440817
23-0.025899-0.20060.420839
24-0.136679-1.05870.146988
25-0.214342-1.66030.051037
26-0.25328-1.96190.027209
27-0.270183-2.09280.020301
28-0.349734-2.7090.004391
29-0.308998-2.39350.009917
30-0.270804-2.09760.020079
31-0.322929-2.50140.007558
32-0.264044-2.04530.02261
33-0.342095-2.64990.00514
34-0.247378-1.91620.030055
35-0.186831-1.44720.076525
36-0.19282-1.49360.070263


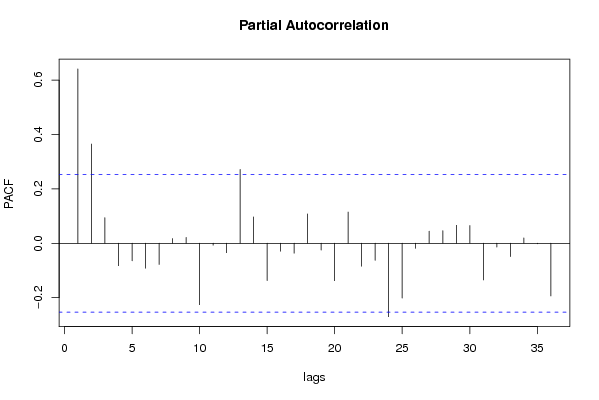
Partial Autocorrelation Function
Time lag kPACF(k)T-STATP-value
10.6411274.96613e-06
20.3648082.82580.003198
30.0940750.72870.234508
4-0.082761-0.64110.261962
5-0.064817-0.50210.308728
6-0.091916-0.7120.239619
7-0.077958-0.60390.274108
80.0170190.13180.447779
90.0214250.1660.434373
10-0.22593-1.750.042611
11-0.007259-0.05620.477673
12-0.034807-0.26960.394191
130.271572.10360.019808
140.0968890.75050.227945
15-0.13709-1.06190.146269
16-0.029189-0.22610.410946
17-0.036389-0.28190.389507
180.1080290.83680.203017
19-0.024982-0.19350.423607
20-0.137953-1.06860.144771
210.1145540.88730.189221
22-0.084294-0.65290.258145
23-0.062646-0.48530.314631
24-0.270009-2.09150.020363
25-0.201575-1.56140.061845
26-0.018541-0.14360.443141
270.0442780.3430.366407
280.0462920.35860.360586
290.0661640.51250.30509
300.0652080.50510.307669
31-0.135005-1.04570.149938
32-0.014101-0.10920.456695
33-0.049142-0.38070.352403
340.0194850.15090.440269
35-0.001921-0.01490.494088
36-0.19362-1.49980.069459

\begin{tabular}{lllllllll}
\hline
Partial Autocorrelation Function \tabularnewline
Time lag k & PACF(k) & T-STAT & P-value \tabularnewline
1 & 0.641127 & 4.9661 & 3e-06 \tabularnewline
2 & 0.364808 & 2.8258 & 0.003198 \tabularnewline
3 & 0.094075 & 0.7287 & 0.234508 \tabularnewline
4 & -0.082761 & -0.6411 & 0.261962 \tabularnewline
5 & -0.064817 & -0.5021 & 0.308728 \tabularnewline
6 & -0.091916 & -0.712 & 0.239619 \tabularnewline
7 & -0.077958 & -0.6039 & 0.274108 \tabularnewline
8 & 0.017019 & 0.1318 & 0.447779 \tabularnewline
9 & 0.021425 & 0.166 & 0.434373 \tabularnewline
10 & -0.22593 & -1.75 & 0.042611 \tabularnewline
11 & -0.007259 & -0.0562 & 0.477673 \tabularnewline
12 & -0.034807 & -0.2696 & 0.394191 \tabularnewline
13 & 0.27157 & 2.1036 & 0.019808 \tabularnewline
14 & 0.096889 & 0.7505 & 0.227945 \tabularnewline
15 & -0.13709 & -1.0619 & 0.146269 \tabularnewline
16 & -0.029189 & -0.2261 & 0.410946 \tabularnewline
17 & -0.036389 & -0.2819 & 0.389507 \tabularnewline
18 & 0.108029 & 0.8368 & 0.203017 \tabularnewline
19 & -0.024982 & -0.1935 & 0.423607 \tabularnewline
20 & -0.137953 & -1.0686 & 0.144771 \tabularnewline
21 & 0.114554 & 0.8873 & 0.189221 \tabularnewline
22 & -0.084294 & -0.6529 & 0.258145 \tabularnewline
23 & -0.062646 & -0.4853 & 0.314631 \tabularnewline
24 & -0.270009 & -2.0915 & 0.020363 \tabularnewline
25 & -0.201575 & -1.5614 & 0.061845 \tabularnewline
26 & -0.018541 & -0.1436 & 0.443141 \tabularnewline
27 & 0.044278 & 0.343 & 0.366407 \tabularnewline
28 & 0.046292 & 0.3586 & 0.360586 \tabularnewline
29 & 0.066164 & 0.5125 & 0.30509 \tabularnewline
30 & 0.065208 & 0.5051 & 0.307669 \tabularnewline
31 & -0.135005 & -1.0457 & 0.149938 \tabularnewline
32 & -0.014101 & -0.1092 & 0.456695 \tabularnewline
33 & -0.049142 & -0.3807 & 0.352403 \tabularnewline
34 & 0.019485 & 0.1509 & 0.440269 \tabularnewline
35 & -0.001921 & -0.0149 & 0.494088 \tabularnewline
36 & -0.19362 & -1.4998 & 0.069459 \tabularnewline
\hline
\end{tabular}
%Source: https://freestatistics.org/blog/index.php?pk=59229&T=2

[TABLE]
[ROW][C]Partial Autocorrelation Function[/C][/ROW]
[ROW][C]Time lag k[/C][C]PACF(k)[/C][C]T-STAT[/C][C]P-value[/C][/ROW]
[ROW][C]1[/C][C]0.641127[/C][C]4.9661[/C][C]3e-06[/C][/ROW]
[ROW][C]2[/C][C]0.364808[/C][C]2.8258[/C][C]0.003198[/C][/ROW]
[ROW][C]3[/C][C]0.094075[/C][C]0.7287[/C][C]0.234508[/C][/ROW]
[ROW][C]4[/C][C]-0.082761[/C][C]-0.6411[/C][C]0.261962[/C][/ROW]
[ROW][C]5[/C][C]-0.064817[/C][C]-0.5021[/C][C]0.308728[/C][/ROW]
[ROW][C]6[/C][C]-0.091916[/C][C]-0.712[/C][C]0.239619[/C][/ROW]
[ROW][C]7[/C][C]-0.077958[/C][C]-0.6039[/C][C]0.274108[/C][/ROW]
[ROW][C]8[/C][C]0.017019[/C][C]0.1318[/C][C]0.447779[/C][/ROW]
[ROW][C]9[/C][C]0.021425[/C][C]0.166[/C][C]0.434373[/C][/ROW]
[ROW][C]10[/C][C]-0.22593[/C][C]-1.75[/C][C]0.042611[/C][/ROW]
[ROW][C]11[/C][C]-0.007259[/C][C]-0.0562[/C][C]0.477673[/C][/ROW]
[ROW][C]12[/C][C]-0.034807[/C][C]-0.2696[/C][C]0.394191[/C][/ROW]
[ROW][C]13[/C][C]0.27157[/C][C]2.1036[/C][C]0.019808[/C][/ROW]
[ROW][C]14[/C][C]0.096889[/C][C]0.7505[/C][C]0.227945[/C][/ROW]
[ROW][C]15[/C][C]-0.13709[/C][C]-1.0619[/C][C]0.146269[/C][/ROW]
[ROW][C]16[/C][C]-0.029189[/C][C]-0.2261[/C][C]0.410946[/C][/ROW]
[ROW][C]17[/C][C]-0.036389[/C][C]-0.2819[/C][C]0.389507[/C][/ROW]
[ROW][C]18[/C][C]0.108029[/C][C]0.8368[/C][C]0.203017[/C][/ROW]
[ROW][C]19[/C][C]-0.024982[/C][C]-0.1935[/C][C]0.423607[/C][/ROW]
[ROW][C]20[/C][C]-0.137953[/C][C]-1.0686[/C][C]0.144771[/C][/ROW]
[ROW][C]21[/C][C]0.114554[/C][C]0.8873[/C][C]0.189221[/C][/ROW]
[ROW][C]22[/C][C]-0.084294[/C][C]-0.6529[/C][C]0.258145[/C][/ROW]
[ROW][C]23[/C][C]-0.062646[/C][C]-0.4853[/C][C]0.314631[/C][/ROW]
[ROW][C]24[/C][C]-0.270009[/C][C]-2.0915[/C][C]0.020363[/C][/ROW]
[ROW][C]25[/C][C]-0.201575[/C][C]-1.5614[/C][C]0.061845[/C][/ROW]
[ROW][C]26[/C][C]-0.018541[/C][C]-0.1436[/C][C]0.443141[/C][/ROW]
[ROW][C]27[/C][C]0.044278[/C][C]0.343[/C][C]0.366407[/C][/ROW]
[ROW][C]28[/C][C]0.046292[/C][C]0.3586[/C][C]0.360586[/C][/ROW]
[ROW][C]29[/C][C]0.066164[/C][C]0.5125[/C][C]0.30509[/C][/ROW]
[ROW][C]30[/C][C]0.065208[/C][C]0.5051[/C][C]0.307669[/C][/ROW]
[ROW][C]31[/C][C]-0.135005[/C][C]-1.0457[/C][C]0.149938[/C][/ROW]
[ROW][C]32[/C][C]-0.014101[/C][C]-0.1092[/C][C]0.456695[/C][/ROW]
[ROW][C]33[/C][C]-0.049142[/C][C]-0.3807[/C][C]0.352403[/C][/ROW]
[ROW][C]34[/C][C]0.019485[/C][C]0.1509[/C][C]0.440269[/C][/ROW]
[ROW][C]35[/C][C]-0.001921[/C][C]-0.0149[/C][C]0.494088[/C][/ROW]
[ROW][C]36[/C][C]-0.19362[/C][C]-1.4998[/C][C]0.069459[/C][/ROW]
[/TABLE]
Source: https://freestatistics.org/blog/index.php?pk=59229&T=2

Globally Unique Identifier (entire table): ba.freestatistics.org/blog/index.php?pk=59229&T=2

As an alternative you can also use a QR Code:  

The GUIDs for individual cells are displayed in the table below:

Partial Autocorrelation Function
Time lag kPACF(k)T-STATP-value
10.6411274.96613e-06
20.3648082.82580.003198
30.0940750.72870.234508
4-0.082761-0.64110.261962
5-0.064817-0.50210.308728
6-0.091916-0.7120.239619
7-0.077958-0.60390.274108
80.0170190.13180.447779
90.0214250.1660.434373
10-0.22593-1.750.042611
11-0.007259-0.05620.477673
12-0.034807-0.26960.394191
130.271572.10360.019808
140.0968890.75050.227945
15-0.13709-1.06190.146269
16-0.029189-0.22610.410946
17-0.036389-0.28190.389507
180.1080290.83680.203017
19-0.024982-0.19350.423607
20-0.137953-1.06860.144771
210.1145540.88730.189221
22-0.084294-0.65290.258145
23-0.062646-0.48530.314631
24-0.270009-2.09150.020363
25-0.201575-1.56140.061845
26-0.018541-0.14360.443141
270.0442780.3430.366407
280.0462920.35860.360586
290.0661640.51250.30509
300.0652080.50510.307669
31-0.135005-1.04570.149938
32-0.014101-0.10920.456695
33-0.049142-0.38070.352403
340.0194850.15090.440269
35-0.001921-0.01490.494088
36-0.19362-1.49980.069459


Parameters (Session):
par1 = 36 ; par2 = 1 ; par3 = 0 ; par4 = 1 ; par5 = 12 ; par6 = MA ; par7 = 0.95 ;
Parameters (R input):
par1 = 36 ; par2 = 1 ; par3 = 0 ; par4 = 1 ; par5 = 12 ; par6 = MA ; par7 = 0.95 ;
R code (references can be found in the software module):
if (par1 == 'Default') {
par1 = 10*log10(length(x))
} else {
par1 <- as.numeric(par1)
}
par2 <- as.numeric(par2)
par3 <- as.numeric(par3)
par4 <- as.numeric(par4)
par5 <- as.numeric(par5)
if (par6 == 'White Noise') par6 <- 'white' else par6 <- 'ma'
par7 <- as.numeric(par7)
if (par2 == 0) {
x <- log(x)
} else {
x <- (x ^ par2 - 1) / par2
}
if (par3 > 0) x <- diff(x,lag=1,difference=par3)
if (par4 > 0) x <- diff(x,lag=par5,difference=par4)
bitmap(file='pic1.png')
racf <- acf(x, par1, main='Autocorrelation', xlab='time lag', ylab='ACF', ci.type=par6, ci=par7, sub=paste('(lambda=',par2,', d=',par3,', D=',par4,', CI=', par7, ', CI type=',par6,')',sep=''))
dev.off()
bitmap(file='pic2.png')
rpacf <- pacf(x,par1,main='Partial Autocorrelation',xlab='lags',ylab='PACF')
dev.off()
(myacf <- c(racf$acf))
(mypacf <- c(rpacf$acf))
lengthx <- length(x)
sqrtn <- sqrt(lengthx)
load(file='createtable')
a<-table.start()
a<-table.row.start(a)
a<-table.element(a,'Autocorrelation Function',4,TRUE)
a<-table.row.end(a)
a<-table.row.start(a)
a<-table.element(a,'Time lag k',header=TRUE)
a<-table.element(a,hyperlink('basics.htm','ACF(k)','click here for more information about the Autocorrelation Function'),header=TRUE)
a<-table.element(a,'T-STAT',header=TRUE)
a<-table.element(a,'P-value',header=TRUE)
a<-table.row.end(a)
for (i in 2:(par1+1)) {
a<-table.row.start(a)
a<-table.element(a,i-1,header=TRUE)
a<-table.element(a,round(myacf[i],6))
mytstat <- myacf[i]*sqrtn
a<-table.element(a,round(mytstat,4))
a<-table.element(a,round(1-pt(abs(mytstat),lengthx),6))
a<-table.row.end(a)
}
a<-table.end(a)
table.save(a,file='mytable.tab')
a<-table.start()
a<-table.row.start(a)
a<-table.element(a,'Partial Autocorrelation Function',4,TRUE)
a<-table.row.end(a)
a<-table.row.start(a)
a<-table.element(a,'Time lag k',header=TRUE)
a<-table.element(a,hyperlink('basics.htm','PACF(k)','click here for more information about the Partial Autocorrelation Function'),header=TRUE)
a<-table.element(a,'T-STAT',header=TRUE)
a<-table.element(a,'P-value',header=TRUE)
a<-table.row.end(a)
for (i in 1:par1) {
a<-table.row.start(a)
a<-table.element(a,i,header=TRUE)
a<-table.element(a,round(mypacf[i],6))
mytstat <- mypacf[i]*sqrtn
a<-table.element(a,round(mytstat,4))
a<-table.element(a,round(1-pt(abs(mytstat),lengthx),6))
a<-table.row.end(a)
}
a<-table.end(a)
table.save(a,file='mytable1.tab')