Free Statistics
of Irreproducible Research!
Description of Statistical Computation | |||||||||||||||||||||||||||||||||
|---|---|---|---|---|---|---|---|---|---|---|---|---|---|---|---|---|---|---|---|---|---|---|---|---|---|---|---|---|---|---|---|---|---|
| Author's title | |||||||||||||||||||||||||||||||||
| Author | *Unverified author* | ||||||||||||||||||||||||||||||||
| R Software Module | rwasp_meanversusmedian.wasp | ||||||||||||||||||||||||||||||||
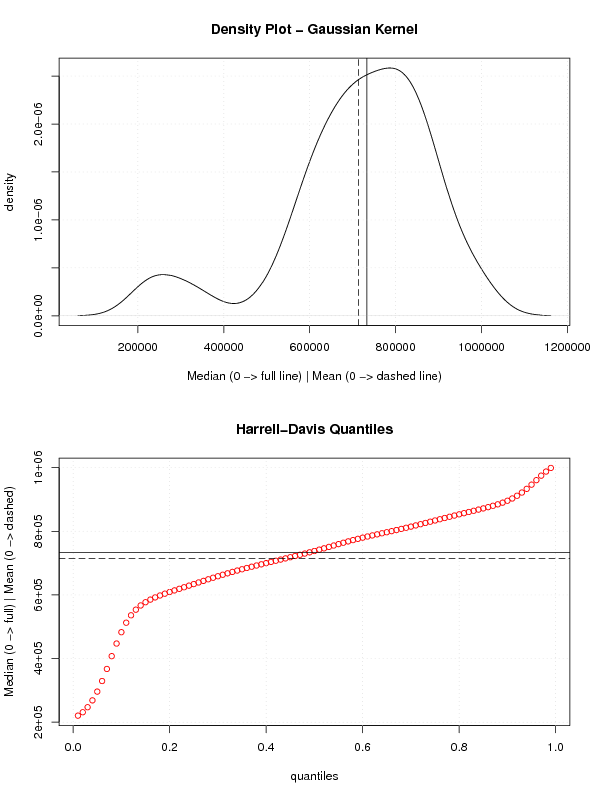
| Title produced by software | Mean versus Median | ||||||||||||||||||||||||||||||||
| Date of computation | Fri, 12 Mar 2010 12:12:31 -0700 | ||||||||||||||||||||||||||||||||
| Cite this page as follows | Statistical Computations at FreeStatistics.org, Office for Research Development and Education, URL https://freestatistics.org/blog/index.php?v=date/2010/Mar/12/t1268421221fyzgkt9exctmg30.htm/, Retrieved Mon, 28 Jul 2025 04:53:00 +0000 | ||||||||||||||||||||||||||||||||
| Statistical Computations at FreeStatistics.org, Office for Research Development and Education, URL https://freestatistics.org/blog/index.php?pk=74365, Retrieved Mon, 28 Jul 2025 04:53:00 +0000 | |||||||||||||||||||||||||||||||||
| QR Codes: | |||||||||||||||||||||||||||||||||
|
| |||||||||||||||||||||||||||||||||
| Original text written by user: | |||||||||||||||||||||||||||||||||
| IsPrivate? | No (this computation is public) | ||||||||||||||||||||||||||||||||
| User-defined keywords | KDGP1W52 | ||||||||||||||||||||||||||||||||
| Estimated Impact | 329 | ||||||||||||||||||||||||||||||||
Tree of Dependent Computations | |||||||||||||||||||||||||||||||||
| Family? (F = Feedback message, R = changed R code, M = changed R Module, P = changed Parameters, D = changed Data) | |||||||||||||||||||||||||||||||||
| - [Mean versus Median] [Opgave 5 oefening...] [2010-03-12 19:12:31] [d38ec69e6463020b6f9ce85941b20918] [Current] | |||||||||||||||||||||||||||||||||
| Feedback Forum | |||||||||||||||||||||||||||||||||
Post a new message | |||||||||||||||||||||||||||||||||
Dataset | |||||||||||||||||||||||||||||||||
| Dataseries X: | |||||||||||||||||||||||||||||||||
562674 599000 668516 597798 579889 668233 499232 215187 555813 586935 546136 571111 634712 639283 712182 621557 621000 675989 501322 220286 560727 602530 626379 605508 646783 658442 712906 687714 723916 707183 629000 237530 613296 730444 734925 651812 676155 748183 810681 729363 701108 790079 594621 230716 617189 691389 701067 705777 747636 773392 813788 766713 728875 749197 680954 241424 680234 708326 694238 772071 795337 788421 889968 797393 751000 821255 691605 290655 727147 868355 812390 799556 843038 847000 941952 804309 840307 871528 656330 370508 742000 847152 731675 898527 778139 856075 938833 813023 783417 828110 657311 310032 780000 860000 780000 807993 895217 856075 893268 875000 835088 934595 832500 300000 791443 900000 781729 880000 875024 992968 976804 968697 871675 1006852 832037 345587 849528 913871 868746 993733 | |||||||||||||||||||||||||||||||||
Tables (Output of Computation) | |||||||||||||||||||||||||||||||||
| |||||||||||||||||||||||||||||||||
Figures (Output of Computation) | |||||||||||||||||||||||||||||||||
Input Parameters & R Code | |||||||||||||||||||||||||||||||||
| Parameters (Session): | |||||||||||||||||||||||||||||||||
| Parameters (R input): | |||||||||||||||||||||||||||||||||
| R code (references can be found in the software module): | |||||||||||||||||||||||||||||||||
library(Hmisc) | |||||||||||||||||||||||||||||||||