Free Statistics
of Irreproducible Research!
Description of Statistical Computation | |||||||||||||||||||||||||||||||||||||||||
|---|---|---|---|---|---|---|---|---|---|---|---|---|---|---|---|---|---|---|---|---|---|---|---|---|---|---|---|---|---|---|---|---|---|---|---|---|---|---|---|---|---|
| Author's title | |||||||||||||||||||||||||||||||||||||||||
| Author | *Unverified author* | ||||||||||||||||||||||||||||||||||||||||
| R Software Module | rwasp_univariatedataseries.wasp | ||||||||||||||||||||||||||||||||||||||||
| Title produced by software | Univariate Data Series | ||||||||||||||||||||||||||||||||||||||||
| Date of computation | Sat, 05 Jan 2008 16:43:18 -0700 | ||||||||||||||||||||||||||||||||||||||||
| Cite this page as follows | Statistical Computations at FreeStatistics.org, Office for Research Development and Education, URL https://freestatistics.org/blog/index.php?v=date/2008/Jan/06/t11995765663rnq0f6tqd9tvuc.htm/, Retrieved Fri, 22 May 2026 08:18:43 +0000 | ||||||||||||||||||||||||||||||||||||||||
| Statistical Computations at FreeStatistics.org, Office for Research Development and Education, URL https://freestatistics.org/blog/index.php?pk=7781, Retrieved Fri, 22 May 2026 08:18:43 +0000 | |||||||||||||||||||||||||||||||||||||||||
| QR Codes: | |||||||||||||||||||||||||||||||||||||||||
|
| |||||||||||||||||||||||||||||||||||||||||
| Original text written by user: | |||||||||||||||||||||||||||||||||||||||||
| IsPrivate? | No (this computation is public) | ||||||||||||||||||||||||||||||||||||||||
| User-defined keywords | arabica, time series, price, usa, tutorial | ||||||||||||||||||||||||||||||||||||||||
| Estimated Impact | 1211 | ||||||||||||||||||||||||||||||||||||||||
Tree of Dependent Computations | |||||||||||||||||||||||||||||||||||||||||
| Family? (F = Feedback message, R = changed R code, M = changed R Module, P = changed Parameters, D = changed Data) | |||||||||||||||||||||||||||||||||||||||||
| - [Univariate Data Series] [Arabica Price in ...] [2008-01-05 23:43:18] [d41d8cd98f00b204e9800998ecf8427e] [Current] - PD [Univariate Data Series] [Paper stationair ...] [2008-12-08 21:30:08] [74be16979710d4c4e7c6647856088456] - R PD [Univariate Data Series] [test] [2008-12-08 21:37:26] [74be16979710d4c4e7c6647856088456] - PD [Univariate Data Series] [Bel-20 waarden] [2008-12-15 16:18:19] [74be16979710d4c4e7c6647856088456] - RMPD [Pearson Correlation] [autocorrelation t] [2008-12-16 20:58:01] [74be16979710d4c4e7c6647856088456] - R PD [Univariate Data Series] [Paper - run seque...] [2008-12-20 10:14:19] [1848c1c05ef454c234bcbe26cf08badc] - [Univariate Data Series] [Paper - run-seque...] [2008-12-20 10:36:19] [1848c1c05ef454c234bcbe26cf08badc] - MPD [Univariate Data Series] [mini tut] [2010-11-12 13:58:09] [4a7069087cf9e0eda253aeed7d8c30d6] - MPD [Univariate Data Series] [] [2010-11-12 14:26:20] [1251ac2db27b84d4a3ba43449388906b] - MPD [Univariate Data Series] [Berekening 3] [2010-11-15 13:46:04] [b659239b537e56f17142ee5c56ad6265] - RMPD [Univariate Data Series] [mini tutorial 3 r...] [2010-11-15 22:21:00] [4eaa304e6a28c475ba490fccf4c01ad3] F RMPD [Central Tendency] [Retailprices US] [2010-11-16 11:13:12] [c2a9e95daa10045f9fd6252038bcb219] - RMP [Blocked Bootstrap Plot - Central Tendency] [Blocked Bootstrap...] [2010-11-16 11:54:11] [c2a9e95daa10045f9fd6252038bcb219] - R [Central Tendency] [Retailprijzen USA] [2010-11-25 16:31:39] [5b90046bcdf0f277a2c54de2210570b9] - RMPD [Univariate Data Series] [] [2010-11-23 14:28:58] [9315c5fa5df29386545a575306c6a452] - [Univariate Data Series] [] [2010-11-25 10:59:16] [91de8b765895d6ee0c73f0d2e284be17] - RMPD [Univariate Data Series] [] [2010-11-23 15:55:22] [d151a1f90c2d38425a986bf939030c8f] - RMPD [Univariate Explorative Data Analysis] [workshop 3 onderd...] [2010-11-24 13:40:45] [efd13e24149aec704f3383e33c1e842a] - PD [Univariate Explorative Data Analysis] [autocorrelatie Di...] [2010-11-24 17:36:22] [8ed0bd3560b9ca2814a2ed0a29182575] - D [Univariate Explorative Data Analysis] [autocorrelatie wa...] [2010-11-24 17:39:02] [8ed0bd3560b9ca2814a2ed0a29182575] - RMPD [Univariate Data Series] [workshop 3 onderd...] [2010-11-24 13:57:34] [efd13e24149aec704f3383e33c1e842a] - RMPD [Standard Deviation Plot] [workshop 3 onderd...] [2010-11-24 14:02:02] [efd13e24149aec704f3383e33c1e842a] - D [Standard Deviation Plot] [seasonality] [2010-11-24 14:09:49] [8b7e5d4d87654725a776c7f35eb4752f] - [Standard Deviation Plot] [seasonality] [2010-11-24 14:12:37] [8b7e5d4d87654725a776c7f35eb4752f] - P [Standard Deviation Plot] [] [2010-11-26 19:58:47] [dc73d270d5d96f29ff77294e1b86f79b] - MPD [Univariate Data Series] [Run Sequence Plot...] [2010-11-24 16:15:27] [8ed0bd3560b9ca2814a2ed0a29182575] - MPD [Univariate Data Series] [Run Sequence Plot...] [2010-11-24 16:19:59] [8ed0bd3560b9ca2814a2ed0a29182575] - MPD [Univariate Data Series] [Workshop 6 - Simp...] [2010-11-24 16:39:36] [8677c3f87cec9201607d40be65aa9670] - RMPD [Univariate Data Series] [workshop 3 onderd...] [2010-11-25 16:33:50] [efd13e24149aec704f3383e33c1e842a] - RMPD [Univariate Data Series] [Mini-Tutorial] [2010-11-25 20:21:08] [845827b7f02503df17c96f445745fee7] - PD [Univariate Data Series] [Mini-Tutorial (Un...] [2010-11-25 20:59:07] [845827b7f02503df17c96f445745fee7] - RMPD [Univariate Data Series] [BBP in België] [2010-12-22 13:07:15] [96348ef82925ade81ab3c243141d80f1] - RMPD [Univariate Data Series] [inflatie in Belgi...] [2010-12-22 13:07:15] [96348ef82925ade81ab3c243141d80f1] - D [Univariate Data Series] [univariate analyse] [2010-12-22 14:11:03] [30b3e197115d238a51c18bcedc33a6a5] - PD [Univariate Data Series] [univariate analys...] [2010-12-22 14:14:11] [30b3e197115d238a51c18bcedc33a6a5] - PD [Univariate Data Series] [univariate analys...] [2010-12-22 17:44:43] [96348ef82925ade81ab3c243141d80f1] - RMPD [Histogram] [histogram inflatie] [2010-12-22 13:21:55] [96348ef82925ade81ab3c243141d80f1] - D [Histogram] [Historgram Inflatie] [2010-12-22 14:20:36] [30b3e197115d238a51c18bcedc33a6a5] - D [Histogram] [Histogram BBP] [2010-12-22 14:24:29] [30b3e197115d238a51c18bcedc33a6a5] - RMPD [Bootstrap Plot - Central Tendency] [blocked bootstrap] [2010-12-22 14:35:50] [30b3e197115d238a51c18bcedc33a6a5] - D [Bootstrap Plot - Central Tendency] [notched boxplots ...] [2010-12-22 17:51:05] [96348ef82925ade81ab3c243141d80f1] - RMPD [Bootstrap Plot - Central Tendency] [blocked bootstrap...] [2010-12-22 14:40:22] [30b3e197115d238a51c18bcedc33a6a5] - D [Histogram] [histogram BBP] [2010-12-22 17:46:44] [96348ef82925ade81ab3c243141d80f1] - RMPD [Univariate Data Series] [Arabica Price (USA)] [2011-11-12 14:43:33] [74be16979710d4c4e7c6647856088456] - RMPD [Univariate Data Series] [compendium 6] [2011-11-13 12:32:49] [74be16979710d4c4e7c6647856088456] - RMPD [Univariate Data Series] [america price] [2011-11-13 12:39:25] [22f8bc702946f784836540059d0d9516] - RMPD [Univariate Data Series] [] [2011-11-13 15:53:42] [50e3859e0b739a5118d466e989dfc0cb] - D [Univariate Data Series] [] [2011-11-13 16:26:18] [50e3859e0b739a5118d466e989dfc0cb] - RMPD [Univariate Data Series] [] [2011-11-13 15:53:44] [72554d79606dc183296fd485368f0ec1] [Truncated] | |||||||||||||||||||||||||||||||||||||||||
| Feedback Forum | |||||||||||||||||||||||||||||||||||||||||
Post a new message | |||||||||||||||||||||||||||||||||||||||||
Dataset | |||||||||||||||||||||||||||||||||||||||||
| Dataseries X: | |||||||||||||||||||||||||||||||||||||||||
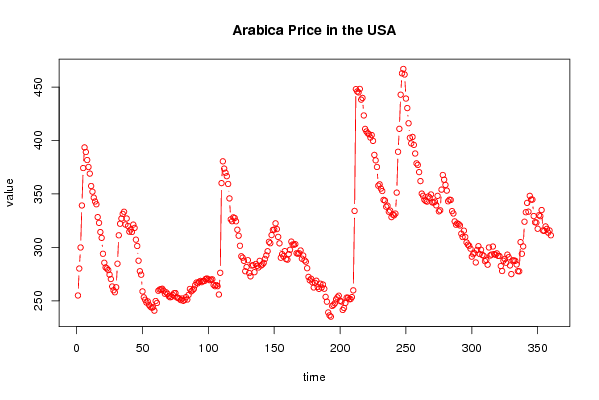
255 280.2 299.9 339.2 374.2 393.5 389.2 381.7 375.2 369 357.4 352.1 346.5 342.9 340.3 328.3 322.9 314.3 308.9 294 285.6 281.2 280.3 278.8 274.5 270.4 263.4 259.9 258 262.7 284.7 311.3 322.1 327 331.3 333.3 321.4 327 320 314.7 316.7 314.4 321.3 318.2 307.2 301.3 287.5 277.7 274.4 258.8 253.3 251 248.4 249.5 246.1 244.5 243.6 244 240.8 249.8 248 259.4 260.5 260.8 261.3 259.5 256.6 257.9 256.5 254.2 253.3 253.8 255.5 257.1 257.3 253.2 252.8 252 250.7 252.2 250 251 253.4 251.2 255.6 261.1 258.9 259.9 261.2 264.7 267.1 266.4 267.7 268.6 267.5 268.5 268.5 270.5 270.9 270.1 269.3 269.8 270.1 264.9 263.7 264.8 263.7 255.9 276.2 360.1 380.5 373.7 369.8 366.6 359.3 345.8 326.2 324.5 328.1 327.5 324.4 316.5 310.9 301.5 291.7 290.4 287.4 277.7 281.6 288 276 272.9 283 283.3 276.8 284.5 282.7 281.2 287.4 283.1 284 285.5 289.2 292.5 296.4 305.2 303.9 311.5 316.3 316.7 322.5 317.1 309.8 303.8 290.3 293.7 291.7 296.5 289.1 288.5 293.8 297.7 305.4 302.7 302.5 303 294.5 294.1 294.5 297.1 289.4 292.4 287.9 286.6 280.5 272.4 269.2 270.6 267.3 262.5 266.8 268.8 263.1 261.2 266 262.5 265.2 261.3 253.7 249.2 239.1 236.4 235.2 245.2 246.2 247.7 251.4 253.3 254.8 250 249.3 241.5 243.3 248 253 252.9 251.5 251.6 253.5 259.8 334.1 448 445.8 445 448.2 438.2 439.8 423.4 410.8 408.4 406.7 405.9 402.7 405.1 399.6 386.5 381.4 375.2 357.7 359 355 352.7 344.4 343.8 338 339 333.3 334.4 328.3 330.7 330 331.6 351.2 389.4 410.9 442.8 462.8 466.9 461.7 439.2 430.3 416.1 402.5 397.3 403.3 395.9 387.8 378.6 377.1 370.4 362 350.3 348.2 344.6 343.5 342.8 347.6 346.6 349.5 342.1 342 342.8 339.3 348.2 333.7 334.7 354 367.7 363.3 358.4 353.1 343.1 344.6 344.4 333.9 331.7 324.3 321.2 322.4 321.7 320.5 312.8 309.7 315.6 309.7 304.6 302.5 301.5 298.8 291.3 293.6 294.6 285.9 297.6 301.1 293.8 297.7 292.9 292.1 287.2 288.2 283.8 299.9 292.4 293.3 300.8 293.7 293.1 294.4 292.1 291.9 282.5 277.9 287.5 289.2 285.6 293.2 290.8 283.1 275 287.8 287.8 287.4 284 277.8 277.6 304.9 294 300.9 324 332.9 341.6 333.4 348.2 344.7 344.7 329.3 323.5 323.2 317.4 330.1 329.2 334.9 315.8 315.4 319.6 317.3 313.8 315.8 311.3 | |||||||||||||||||||||||||||||||||||||||||
Tables (Output of Computation) | |||||||||||||||||||||||||||||||||||||||||
| |||||||||||||||||||||||||||||||||||||||||
Figures (Output of Computation) | |||||||||||||||||||||||||||||||||||||||||
Input Parameters & R Code | |||||||||||||||||||||||||||||||||||||||||
| Parameters (Session): | |||||||||||||||||||||||||||||||||||||||||
| par1 = usa price ; par2 = www.ico.org ; par3 = Retail prices in importing Member countries in US cents per lb (Arabica, 1977/1 - 2006/12) ; | |||||||||||||||||||||||||||||||||||||||||
| Parameters (R input): | |||||||||||||||||||||||||||||||||||||||||
| par1 = usa price ; par2 = www.ico.org ; par3 = Retail prices in importing Member countries in US cents per lb (Arabica, 1977/1 - 2006/12) ; | |||||||||||||||||||||||||||||||||||||||||
| R code (references can be found in the software module): | |||||||||||||||||||||||||||||||||||||||||
bitmap(file='test1.png') | |||||||||||||||||||||||||||||||||||||||||