Free Statistics

of Irreproducible Research!

Author's title

Author*Unverified author*
R Software Modulerwasp_autocorrelation.wasp
Title produced by software(Partial) Autocorrelation Function
Date of computationTue, 20 Jul 2010 11:33:54 +0000
Cite this page as followsStatistical Computations at FreeStatistics.org, Office for Research Development and Education, URL https://freestatistics.org/blog/index.php?v=date/2010/Jul/20/t1279625657txek4j3n4rcu3fj.htm/, Retrieved Fri, 01 Nov 2024 01:27:03 +0000
Statistical Computations at FreeStatistics.org, Office for Research Development and Education, URL https://freestatistics.org/blog/index.php?pk=78043, Retrieved Fri, 01 Nov 2024 01:27:03 +0000
QR Codes:

Original text written by user:
IsPrivate?No (this computation is public)
User-defined keywordsVanhille Olivier
Estimated Impact237
Family? (F = Feedback message, R = changed R code, M = changed R Module, P = changed Parameters, D = changed Data)
-       [(Partial) Autocorrelation Function] [tijdreeks 1 - sta...] [2010-07-20 11:33:54] [ddb1c76c3acba5bf82e5ed3b5a08f68d] [Current]
Feedback Forum

Post a new message
Dataseries X:
568
567
566
564
584
583
568
558
559
559
560
562
563
552
552
555
575
567
548
541
544
546
551
550
546
532
523
528
555
543
525
517
519
521
520
516
509
494
484
482
508
500
480
467
471
482
481
477
471
455
441
434
459
448
432
414
415
423
425
427
415
399
386
377
397
379
361
350
348
363
367
365
354
327
312
307
335
317
298
286
288
303
310
301
293
264
255
251
279
253
233
226
232
245
250
242
230
196
188
181
212
186
166
155
157
173
182
182
168
131
114
106
134
103
83
74
83
96
95
100


Summary of computational transaction
Raw Inputview raw input (R code)
Raw Outputview raw output of R engine
Computing time2 seconds
R Server'RServer@AstonUniversity' @ vre.aston.ac.uk

\begin{tabular}{lllllllll}
\hline
Summary of computational transaction \tabularnewline
Raw Input & view raw input (R code)  \tabularnewline
Raw Output & view raw output of R engine  \tabularnewline
Computing time & 2 seconds \tabularnewline
R Server & 'RServer@AstonUniversity' @ vre.aston.ac.uk \tabularnewline
\hline
\end{tabular}
%Source: https://freestatistics.org/blog/index.php?pk=78043&T=0

[TABLE]
[ROW][C]Summary of computational transaction[/C][/ROW]
[ROW][C]Raw Input[/C][C]view raw input (R code) [/C][/ROW]
[ROW][C]Raw Output[/C][C]view raw output of R engine [/C][/ROW]
[ROW][C]Computing time[/C][C]2 seconds[/C][/ROW]
[ROW][C]R Server[/C][C]'RServer@AstonUniversity' @ vre.aston.ac.uk[/C][/ROW]
[/TABLE]
Source: https://freestatistics.org/blog/index.php?pk=78043&T=0

Globally Unique Identifier (entire table): ba.freestatistics.org/blog/index.php?pk=78043&T=0

As an alternative you can also use a QR Code:  

The GUIDs for individual cells are displayed in the table below:

Summary of computational transaction
Raw Inputview raw input (R code)
Raw Outputview raw output of R engine
Computing time2 seconds
R Server'RServer@AstonUniversity' @ vre.aston.ac.uk


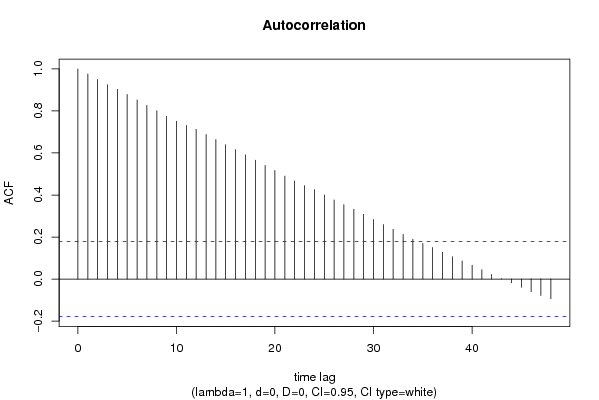
Autocorrelation Function
Time lag kACF(k)T-STATP-value
10.97595210.6910
20.94974310.40390
30.92522210.13530
40.9028429.89010
50.878199.62010
60.8519759.33290
70.8259369.04770
80.80148.77890
90.7743088.48210
100.7511048.22790
110.73098.00660
120.7125387.80550
130.6884017.54110
140.6636257.26970
150.6393197.00340
160.6160616.74860
170.5911656.47590
180.5656166.1960
190.5407635.92380
200.5169715.66310
210.4901775.36960
220.466655.11191e-06
230.4448544.87312e-06
240.4248734.65424e-06
250.4003294.38541.3e-05
260.3764074.12333.5e-05
270.3539133.87698.7e-05
280.3321753.63880.000203
290.3079753.37375e-04
300.2831783.10210.001198
310.2593182.84070.002645
320.2368552.59460.005325
330.2118122.32030.011007
340.1894272.07510.020058
350.168971.8510.033316
360.1500821.64410.05139
370.1274361.3960.082648
380.1059141.16020.124129
390.0856890.93870.174892
400.065970.72270.235647
410.0441970.48420.314581
420.0222750.2440.40382
430.0017450.01910.492392
44-0.017519-0.19190.42407
45-0.039575-0.43350.332706
46-0.05983-0.65540.256732
47-0.077762-0.85180.198001
48-0.094147-1.03130.15223

\begin{tabular}{lllllllll}
\hline
Autocorrelation Function \tabularnewline
Time lag k & ACF(k) & T-STAT & P-value \tabularnewline
1 & 0.975952 & 10.691 & 0 \tabularnewline
2 & 0.949743 & 10.4039 & 0 \tabularnewline
3 & 0.925222 & 10.1353 & 0 \tabularnewline
4 & 0.902842 & 9.8901 & 0 \tabularnewline
5 & 0.87819 & 9.6201 & 0 \tabularnewline
6 & 0.851975 & 9.3329 & 0 \tabularnewline
7 & 0.825936 & 9.0477 & 0 \tabularnewline
8 & 0.8014 & 8.7789 & 0 \tabularnewline
9 & 0.774308 & 8.4821 & 0 \tabularnewline
10 & 0.751104 & 8.2279 & 0 \tabularnewline
11 & 0.7309 & 8.0066 & 0 \tabularnewline
12 & 0.712538 & 7.8055 & 0 \tabularnewline
13 & 0.688401 & 7.5411 & 0 \tabularnewline
14 & 0.663625 & 7.2697 & 0 \tabularnewline
15 & 0.639319 & 7.0034 & 0 \tabularnewline
16 & 0.616061 & 6.7486 & 0 \tabularnewline
17 & 0.591165 & 6.4759 & 0 \tabularnewline
18 & 0.565616 & 6.196 & 0 \tabularnewline
19 & 0.540763 & 5.9238 & 0 \tabularnewline
20 & 0.516971 & 5.6631 & 0 \tabularnewline
21 & 0.490177 & 5.3696 & 0 \tabularnewline
22 & 0.46665 & 5.1119 & 1e-06 \tabularnewline
23 & 0.444854 & 4.8731 & 2e-06 \tabularnewline
24 & 0.424873 & 4.6542 & 4e-06 \tabularnewline
25 & 0.400329 & 4.3854 & 1.3e-05 \tabularnewline
26 & 0.376407 & 4.1233 & 3.5e-05 \tabularnewline
27 & 0.353913 & 3.8769 & 8.7e-05 \tabularnewline
28 & 0.332175 & 3.6388 & 0.000203 \tabularnewline
29 & 0.307975 & 3.3737 & 5e-04 \tabularnewline
30 & 0.283178 & 3.1021 & 0.001198 \tabularnewline
31 & 0.259318 & 2.8407 & 0.002645 \tabularnewline
32 & 0.236855 & 2.5946 & 0.005325 \tabularnewline
33 & 0.211812 & 2.3203 & 0.011007 \tabularnewline
34 & 0.189427 & 2.0751 & 0.020058 \tabularnewline
35 & 0.16897 & 1.851 & 0.033316 \tabularnewline
36 & 0.150082 & 1.6441 & 0.05139 \tabularnewline
37 & 0.127436 & 1.396 & 0.082648 \tabularnewline
38 & 0.105914 & 1.1602 & 0.124129 \tabularnewline
39 & 0.085689 & 0.9387 & 0.174892 \tabularnewline
40 & 0.06597 & 0.7227 & 0.235647 \tabularnewline
41 & 0.044197 & 0.4842 & 0.314581 \tabularnewline
42 & 0.022275 & 0.244 & 0.40382 \tabularnewline
43 & 0.001745 & 0.0191 & 0.492392 \tabularnewline
44 & -0.017519 & -0.1919 & 0.42407 \tabularnewline
45 & -0.039575 & -0.4335 & 0.332706 \tabularnewline
46 & -0.05983 & -0.6554 & 0.256732 \tabularnewline
47 & -0.077762 & -0.8518 & 0.198001 \tabularnewline
48 & -0.094147 & -1.0313 & 0.15223 \tabularnewline
\hline
\end{tabular}
%Source: https://freestatistics.org/blog/index.php?pk=78043&T=1

[TABLE]
[ROW][C]Autocorrelation Function[/C][/ROW]
[ROW][C]Time lag k[/C][C]ACF(k)[/C][C]T-STAT[/C][C]P-value[/C][/ROW]
[ROW][C]1[/C][C]0.975952[/C][C]10.691[/C][C]0[/C][/ROW]
[ROW][C]2[/C][C]0.949743[/C][C]10.4039[/C][C]0[/C][/ROW]
[ROW][C]3[/C][C]0.925222[/C][C]10.1353[/C][C]0[/C][/ROW]
[ROW][C]4[/C][C]0.902842[/C][C]9.8901[/C][C]0[/C][/ROW]
[ROW][C]5[/C][C]0.87819[/C][C]9.6201[/C][C]0[/C][/ROW]
[ROW][C]6[/C][C]0.851975[/C][C]9.3329[/C][C]0[/C][/ROW]
[ROW][C]7[/C][C]0.825936[/C][C]9.0477[/C][C]0[/C][/ROW]
[ROW][C]8[/C][C]0.8014[/C][C]8.7789[/C][C]0[/C][/ROW]
[ROW][C]9[/C][C]0.774308[/C][C]8.4821[/C][C]0[/C][/ROW]
[ROW][C]10[/C][C]0.751104[/C][C]8.2279[/C][C]0[/C][/ROW]
[ROW][C]11[/C][C]0.7309[/C][C]8.0066[/C][C]0[/C][/ROW]
[ROW][C]12[/C][C]0.712538[/C][C]7.8055[/C][C]0[/C][/ROW]
[ROW][C]13[/C][C]0.688401[/C][C]7.5411[/C][C]0[/C][/ROW]
[ROW][C]14[/C][C]0.663625[/C][C]7.2697[/C][C]0[/C][/ROW]
[ROW][C]15[/C][C]0.639319[/C][C]7.0034[/C][C]0[/C][/ROW]
[ROW][C]16[/C][C]0.616061[/C][C]6.7486[/C][C]0[/C][/ROW]
[ROW][C]17[/C][C]0.591165[/C][C]6.4759[/C][C]0[/C][/ROW]
[ROW][C]18[/C][C]0.565616[/C][C]6.196[/C][C]0[/C][/ROW]
[ROW][C]19[/C][C]0.540763[/C][C]5.9238[/C][C]0[/C][/ROW]
[ROW][C]20[/C][C]0.516971[/C][C]5.6631[/C][C]0[/C][/ROW]
[ROW][C]21[/C][C]0.490177[/C][C]5.3696[/C][C]0[/C][/ROW]
[ROW][C]22[/C][C]0.46665[/C][C]5.1119[/C][C]1e-06[/C][/ROW]
[ROW][C]23[/C][C]0.444854[/C][C]4.8731[/C][C]2e-06[/C][/ROW]
[ROW][C]24[/C][C]0.424873[/C][C]4.6542[/C][C]4e-06[/C][/ROW]
[ROW][C]25[/C][C]0.400329[/C][C]4.3854[/C][C]1.3e-05[/C][/ROW]
[ROW][C]26[/C][C]0.376407[/C][C]4.1233[/C][C]3.5e-05[/C][/ROW]
[ROW][C]27[/C][C]0.353913[/C][C]3.8769[/C][C]8.7e-05[/C][/ROW]
[ROW][C]28[/C][C]0.332175[/C][C]3.6388[/C][C]0.000203[/C][/ROW]
[ROW][C]29[/C][C]0.307975[/C][C]3.3737[/C][C]5e-04[/C][/ROW]
[ROW][C]30[/C][C]0.283178[/C][C]3.1021[/C][C]0.001198[/C][/ROW]
[ROW][C]31[/C][C]0.259318[/C][C]2.8407[/C][C]0.002645[/C][/ROW]
[ROW][C]32[/C][C]0.236855[/C][C]2.5946[/C][C]0.005325[/C][/ROW]
[ROW][C]33[/C][C]0.211812[/C][C]2.3203[/C][C]0.011007[/C][/ROW]
[ROW][C]34[/C][C]0.189427[/C][C]2.0751[/C][C]0.020058[/C][/ROW]
[ROW][C]35[/C][C]0.16897[/C][C]1.851[/C][C]0.033316[/C][/ROW]
[ROW][C]36[/C][C]0.150082[/C][C]1.6441[/C][C]0.05139[/C][/ROW]
[ROW][C]37[/C][C]0.127436[/C][C]1.396[/C][C]0.082648[/C][/ROW]
[ROW][C]38[/C][C]0.105914[/C][C]1.1602[/C][C]0.124129[/C][/ROW]
[ROW][C]39[/C][C]0.085689[/C][C]0.9387[/C][C]0.174892[/C][/ROW]
[ROW][C]40[/C][C]0.06597[/C][C]0.7227[/C][C]0.235647[/C][/ROW]
[ROW][C]41[/C][C]0.044197[/C][C]0.4842[/C][C]0.314581[/C][/ROW]
[ROW][C]42[/C][C]0.022275[/C][C]0.244[/C][C]0.40382[/C][/ROW]
[ROW][C]43[/C][C]0.001745[/C][C]0.0191[/C][C]0.492392[/C][/ROW]
[ROW][C]44[/C][C]-0.017519[/C][C]-0.1919[/C][C]0.42407[/C][/ROW]
[ROW][C]45[/C][C]-0.039575[/C][C]-0.4335[/C][C]0.332706[/C][/ROW]
[ROW][C]46[/C][C]-0.05983[/C][C]-0.6554[/C][C]0.256732[/C][/ROW]
[ROW][C]47[/C][C]-0.077762[/C][C]-0.8518[/C][C]0.198001[/C][/ROW]
[ROW][C]48[/C][C]-0.094147[/C][C]-1.0313[/C][C]0.15223[/C][/ROW]
[/TABLE]
Source: https://freestatistics.org/blog/index.php?pk=78043&T=1

Globally Unique Identifier (entire table): ba.freestatistics.org/blog/index.php?pk=78043&T=1

As an alternative you can also use a QR Code:  

The GUIDs for individual cells are displayed in the table below:

Autocorrelation Function
Time lag kACF(k)T-STATP-value
10.97595210.6910
20.94974310.40390
30.92522210.13530
40.9028429.89010
50.878199.62010
60.8519759.33290
70.8259369.04770
80.80148.77890
90.7743088.48210
100.7511048.22790
110.73098.00660
120.7125387.80550
130.6884017.54110
140.6636257.26970
150.6393197.00340
160.6160616.74860
170.5911656.47590
180.5656166.1960
190.5407635.92380
200.5169715.66310
210.4901775.36960
220.466655.11191e-06
230.4448544.87312e-06
240.4248734.65424e-06
250.4003294.38541.3e-05
260.3764074.12333.5e-05
270.3539133.87698.7e-05
280.3321753.63880.000203
290.3079753.37375e-04
300.2831783.10210.001198
310.2593182.84070.002645
320.2368552.59460.005325
330.2118122.32030.011007
340.1894272.07510.020058
350.168971.8510.033316
360.1500821.64410.05139
370.1274361.3960.082648
380.1059141.16020.124129
390.0856890.93870.174892
400.065970.72270.235647
410.0441970.48420.314581
420.0222750.2440.40382
430.0017450.01910.492392
44-0.017519-0.19190.42407
45-0.039575-0.43350.332706
46-0.05983-0.65540.256732
47-0.077762-0.85180.198001
48-0.094147-1.03130.15223


Partial Autocorrelation Function
Time lag kPACF(k)T-STATP-value
10.97595210.6910
2-0.057631-0.63130.264517
30.0241790.26490.395783
40.0292110.320.374767
5-0.062538-0.68510.24731
6-0.038763-0.42460.335933
7-0.009069-0.09930.460515
80.0110880.12150.451764
9-0.070571-0.77310.220502
100.0777970.85220.197895
110.0420880.46110.322797
120.0194310.21290.4159
13-0.123872-1.3570.088672
14-0.013518-0.14810.441264
15-0.018369-0.20120.420434
16-0.012579-0.13780.445315
17-0.035437-0.38820.34928
18-0.02266-0.24820.402191
190.0024980.02740.489107
20-0.000541-0.00590.497641
21-0.059903-0.65620.256475
220.0500060.54780.292427
230.0007060.00770.496919
240.006550.07170.471461
25-0.091667-1.00420.158661
260.0088260.09670.461569
27-0.002278-0.0250.490065
28-0.020916-0.22910.409581
29-0.045941-0.50330.307852
30-0.027121-0.29710.383453
310.0009420.01030.495891
32-0.00226-0.02480.490144
33-0.041443-0.4540.32533
340.0284930.31210.377744
350.0054120.05930.476411
36-0.003151-0.03450.48626
37-0.069375-0.760.224383
380.0110560.12110.4519
39-0.01554-0.17020.432559
40-0.028699-0.31440.376889
41-0.032396-0.35490.36165
42-0.020661-0.22630.410666
430.0065070.07130.471645
44-0.007954-0.08710.465356
45-0.041045-0.44960.326895
460.0040340.04420.482414
470.0123810.13560.446172
48-0.008178-0.08960.464383

\begin{tabular}{lllllllll}
\hline
Partial Autocorrelation Function \tabularnewline
Time lag k & PACF(k) & T-STAT & P-value \tabularnewline
1 & 0.975952 & 10.691 & 0 \tabularnewline
2 & -0.057631 & -0.6313 & 0.264517 \tabularnewline
3 & 0.024179 & 0.2649 & 0.395783 \tabularnewline
4 & 0.029211 & 0.32 & 0.374767 \tabularnewline
5 & -0.062538 & -0.6851 & 0.24731 \tabularnewline
6 & -0.038763 & -0.4246 & 0.335933 \tabularnewline
7 & -0.009069 & -0.0993 & 0.460515 \tabularnewline
8 & 0.011088 & 0.1215 & 0.451764 \tabularnewline
9 & -0.070571 & -0.7731 & 0.220502 \tabularnewline
10 & 0.077797 & 0.8522 & 0.197895 \tabularnewline
11 & 0.042088 & 0.4611 & 0.322797 \tabularnewline
12 & 0.019431 & 0.2129 & 0.4159 \tabularnewline
13 & -0.123872 & -1.357 & 0.088672 \tabularnewline
14 & -0.013518 & -0.1481 & 0.441264 \tabularnewline
15 & -0.018369 & -0.2012 & 0.420434 \tabularnewline
16 & -0.012579 & -0.1378 & 0.445315 \tabularnewline
17 & -0.035437 & -0.3882 & 0.34928 \tabularnewline
18 & -0.02266 & -0.2482 & 0.402191 \tabularnewline
19 & 0.002498 & 0.0274 & 0.489107 \tabularnewline
20 & -0.000541 & -0.0059 & 0.497641 \tabularnewline
21 & -0.059903 & -0.6562 & 0.256475 \tabularnewline
22 & 0.050006 & 0.5478 & 0.292427 \tabularnewline
23 & 0.000706 & 0.0077 & 0.496919 \tabularnewline
24 & 0.00655 & 0.0717 & 0.471461 \tabularnewline
25 & -0.091667 & -1.0042 & 0.158661 \tabularnewline
26 & 0.008826 & 0.0967 & 0.461569 \tabularnewline
27 & -0.002278 & -0.025 & 0.490065 \tabularnewline
28 & -0.020916 & -0.2291 & 0.409581 \tabularnewline
29 & -0.045941 & -0.5033 & 0.307852 \tabularnewline
30 & -0.027121 & -0.2971 & 0.383453 \tabularnewline
31 & 0.000942 & 0.0103 & 0.495891 \tabularnewline
32 & -0.00226 & -0.0248 & 0.490144 \tabularnewline
33 & -0.041443 & -0.454 & 0.32533 \tabularnewline
34 & 0.028493 & 0.3121 & 0.377744 \tabularnewline
35 & 0.005412 & 0.0593 & 0.476411 \tabularnewline
36 & -0.003151 & -0.0345 & 0.48626 \tabularnewline
37 & -0.069375 & -0.76 & 0.224383 \tabularnewline
38 & 0.011056 & 0.1211 & 0.4519 \tabularnewline
39 & -0.01554 & -0.1702 & 0.432559 \tabularnewline
40 & -0.028699 & -0.3144 & 0.376889 \tabularnewline
41 & -0.032396 & -0.3549 & 0.36165 \tabularnewline
42 & -0.020661 & -0.2263 & 0.410666 \tabularnewline
43 & 0.006507 & 0.0713 & 0.471645 \tabularnewline
44 & -0.007954 & -0.0871 & 0.465356 \tabularnewline
45 & -0.041045 & -0.4496 & 0.326895 \tabularnewline
46 & 0.004034 & 0.0442 & 0.482414 \tabularnewline
47 & 0.012381 & 0.1356 & 0.446172 \tabularnewline
48 & -0.008178 & -0.0896 & 0.464383 \tabularnewline
\hline
\end{tabular}
%Source: https://freestatistics.org/blog/index.php?pk=78043&T=2

[TABLE]
[ROW][C]Partial Autocorrelation Function[/C][/ROW]
[ROW][C]Time lag k[/C][C]PACF(k)[/C][C]T-STAT[/C][C]P-value[/C][/ROW]
[ROW][C]1[/C][C]0.975952[/C][C]10.691[/C][C]0[/C][/ROW]
[ROW][C]2[/C][C]-0.057631[/C][C]-0.6313[/C][C]0.264517[/C][/ROW]
[ROW][C]3[/C][C]0.024179[/C][C]0.2649[/C][C]0.395783[/C][/ROW]
[ROW][C]4[/C][C]0.029211[/C][C]0.32[/C][C]0.374767[/C][/ROW]
[ROW][C]5[/C][C]-0.062538[/C][C]-0.6851[/C][C]0.24731[/C][/ROW]
[ROW][C]6[/C][C]-0.038763[/C][C]-0.4246[/C][C]0.335933[/C][/ROW]
[ROW][C]7[/C][C]-0.009069[/C][C]-0.0993[/C][C]0.460515[/C][/ROW]
[ROW][C]8[/C][C]0.011088[/C][C]0.1215[/C][C]0.451764[/C][/ROW]
[ROW][C]9[/C][C]-0.070571[/C][C]-0.7731[/C][C]0.220502[/C][/ROW]
[ROW][C]10[/C][C]0.077797[/C][C]0.8522[/C][C]0.197895[/C][/ROW]
[ROW][C]11[/C][C]0.042088[/C][C]0.4611[/C][C]0.322797[/C][/ROW]
[ROW][C]12[/C][C]0.019431[/C][C]0.2129[/C][C]0.4159[/C][/ROW]
[ROW][C]13[/C][C]-0.123872[/C][C]-1.357[/C][C]0.088672[/C][/ROW]
[ROW][C]14[/C][C]-0.013518[/C][C]-0.1481[/C][C]0.441264[/C][/ROW]
[ROW][C]15[/C][C]-0.018369[/C][C]-0.2012[/C][C]0.420434[/C][/ROW]
[ROW][C]16[/C][C]-0.012579[/C][C]-0.1378[/C][C]0.445315[/C][/ROW]
[ROW][C]17[/C][C]-0.035437[/C][C]-0.3882[/C][C]0.34928[/C][/ROW]
[ROW][C]18[/C][C]-0.02266[/C][C]-0.2482[/C][C]0.402191[/C][/ROW]
[ROW][C]19[/C][C]0.002498[/C][C]0.0274[/C][C]0.489107[/C][/ROW]
[ROW][C]20[/C][C]-0.000541[/C][C]-0.0059[/C][C]0.497641[/C][/ROW]
[ROW][C]21[/C][C]-0.059903[/C][C]-0.6562[/C][C]0.256475[/C][/ROW]
[ROW][C]22[/C][C]0.050006[/C][C]0.5478[/C][C]0.292427[/C][/ROW]
[ROW][C]23[/C][C]0.000706[/C][C]0.0077[/C][C]0.496919[/C][/ROW]
[ROW][C]24[/C][C]0.00655[/C][C]0.0717[/C][C]0.471461[/C][/ROW]
[ROW][C]25[/C][C]-0.091667[/C][C]-1.0042[/C][C]0.158661[/C][/ROW]
[ROW][C]26[/C][C]0.008826[/C][C]0.0967[/C][C]0.461569[/C][/ROW]
[ROW][C]27[/C][C]-0.002278[/C][C]-0.025[/C][C]0.490065[/C][/ROW]
[ROW][C]28[/C][C]-0.020916[/C][C]-0.2291[/C][C]0.409581[/C][/ROW]
[ROW][C]29[/C][C]-0.045941[/C][C]-0.5033[/C][C]0.307852[/C][/ROW]
[ROW][C]30[/C][C]-0.027121[/C][C]-0.2971[/C][C]0.383453[/C][/ROW]
[ROW][C]31[/C][C]0.000942[/C][C]0.0103[/C][C]0.495891[/C][/ROW]
[ROW][C]32[/C][C]-0.00226[/C][C]-0.0248[/C][C]0.490144[/C][/ROW]
[ROW][C]33[/C][C]-0.041443[/C][C]-0.454[/C][C]0.32533[/C][/ROW]
[ROW][C]34[/C][C]0.028493[/C][C]0.3121[/C][C]0.377744[/C][/ROW]
[ROW][C]35[/C][C]0.005412[/C][C]0.0593[/C][C]0.476411[/C][/ROW]
[ROW][C]36[/C][C]-0.003151[/C][C]-0.0345[/C][C]0.48626[/C][/ROW]
[ROW][C]37[/C][C]-0.069375[/C][C]-0.76[/C][C]0.224383[/C][/ROW]
[ROW][C]38[/C][C]0.011056[/C][C]0.1211[/C][C]0.4519[/C][/ROW]
[ROW][C]39[/C][C]-0.01554[/C][C]-0.1702[/C][C]0.432559[/C][/ROW]
[ROW][C]40[/C][C]-0.028699[/C][C]-0.3144[/C][C]0.376889[/C][/ROW]
[ROW][C]41[/C][C]-0.032396[/C][C]-0.3549[/C][C]0.36165[/C][/ROW]
[ROW][C]42[/C][C]-0.020661[/C][C]-0.2263[/C][C]0.410666[/C][/ROW]
[ROW][C]43[/C][C]0.006507[/C][C]0.0713[/C][C]0.471645[/C][/ROW]
[ROW][C]44[/C][C]-0.007954[/C][C]-0.0871[/C][C]0.465356[/C][/ROW]
[ROW][C]45[/C][C]-0.041045[/C][C]-0.4496[/C][C]0.326895[/C][/ROW]
[ROW][C]46[/C][C]0.004034[/C][C]0.0442[/C][C]0.482414[/C][/ROW]
[ROW][C]47[/C][C]0.012381[/C][C]0.1356[/C][C]0.446172[/C][/ROW]
[ROW][C]48[/C][C]-0.008178[/C][C]-0.0896[/C][C]0.464383[/C][/ROW]
[/TABLE]
Source: https://freestatistics.org/blog/index.php?pk=78043&T=2

Globally Unique Identifier (entire table): ba.freestatistics.org/blog/index.php?pk=78043&T=2

As an alternative you can also use a QR Code:  

The GUIDs for individual cells are displayed in the table below:

Partial Autocorrelation Function
Time lag kPACF(k)T-STATP-value
10.97595210.6910
2-0.057631-0.63130.264517
30.0241790.26490.395783
40.0292110.320.374767
5-0.062538-0.68510.24731
6-0.038763-0.42460.335933
7-0.009069-0.09930.460515
80.0110880.12150.451764
9-0.070571-0.77310.220502
100.0777970.85220.197895
110.0420880.46110.322797
120.0194310.21290.4159
13-0.123872-1.3570.088672
14-0.013518-0.14810.441264
15-0.018369-0.20120.420434
16-0.012579-0.13780.445315
17-0.035437-0.38820.34928
18-0.02266-0.24820.402191
190.0024980.02740.489107
20-0.000541-0.00590.497641
21-0.059903-0.65620.256475
220.0500060.54780.292427
230.0007060.00770.496919
240.006550.07170.471461
25-0.091667-1.00420.158661
260.0088260.09670.461569
27-0.002278-0.0250.490065
28-0.020916-0.22910.409581
29-0.045941-0.50330.307852
30-0.027121-0.29710.383453
310.0009420.01030.495891
32-0.00226-0.02480.490144
33-0.041443-0.4540.32533
340.0284930.31210.377744
350.0054120.05930.476411
36-0.003151-0.03450.48626
37-0.069375-0.760.224383
380.0110560.12110.4519
39-0.01554-0.17020.432559
40-0.028699-0.31440.376889
41-0.032396-0.35490.36165
42-0.020661-0.22630.410666
430.0065070.07130.471645
44-0.007954-0.08710.465356
45-0.041045-0.44960.326895
460.0040340.04420.482414
470.0123810.13560.446172
48-0.008178-0.08960.464383


Parameters (Session):
par1 = 48 ; par2 = 1 ; par3 = 0 ; par4 = 0 ; par5 = 12 ; par6 = White Noise ; par7 = 0.95 ;
Parameters (R input):
par1 = 48 ; par2 = 1 ; par3 = 0 ; par4 = 0 ; par5 = 12 ; par6 = White Noise ; par7 = 0.95 ;
R code (references can be found in the software module):
if (par1 == 'Default') {
par1 = 10*log10(length(x))
} else {
par1 <- as.numeric(par1)
}
par2 <- as.numeric(par2)
par3 <- as.numeric(par3)
par4 <- as.numeric(par4)
par5 <- as.numeric(par5)
if (par6 == 'White Noise') par6 <- 'white' else par6 <- 'ma'
par7 <- as.numeric(par7)
if (par2 == 0) {
x <- log(x)
} else {
x <- (x ^ par2 - 1) / par2
}
if (par3 > 0) x <- diff(x,lag=1,difference=par3)
if (par4 > 0) x <- diff(x,lag=par5,difference=par4)
bitmap(file='pic1.png')
racf <- acf(x, par1, main='Autocorrelation', xlab='time lag', ylab='ACF', ci.type=par6, ci=par7, sub=paste('(lambda=',par2,', d=',par3,', D=',par4,', CI=', par7, ', CI type=',par6,')',sep=''))
dev.off()
bitmap(file='pic2.png')
rpacf <- pacf(x,par1,main='Partial Autocorrelation',xlab='lags',ylab='PACF')
dev.off()
(myacf <- c(racf$acf))
(mypacf <- c(rpacf$acf))
lengthx <- length(x)
sqrtn <- sqrt(lengthx)
load(file='createtable')
a<-table.start()
a<-table.row.start(a)
a<-table.element(a,'Autocorrelation Function',4,TRUE)
a<-table.row.end(a)
a<-table.row.start(a)
a<-table.element(a,'Time lag k',header=TRUE)
a<-table.element(a,hyperlink('basics.htm','ACF(k)','click here for more information about the Autocorrelation Function'),header=TRUE)
a<-table.element(a,'T-STAT',header=TRUE)
a<-table.element(a,'P-value',header=TRUE)
a<-table.row.end(a)
for (i in 2:(par1+1)) {
a<-table.row.start(a)
a<-table.element(a,i-1,header=TRUE)
a<-table.element(a,round(myacf[i],6))
mytstat <- myacf[i]*sqrtn
a<-table.element(a,round(mytstat,4))
a<-table.element(a,round(1-pt(abs(mytstat),lengthx),6))
a<-table.row.end(a)
}
a<-table.end(a)
table.save(a,file='mytable.tab')
a<-table.start()
a<-table.row.start(a)
a<-table.element(a,'Partial Autocorrelation Function',4,TRUE)
a<-table.row.end(a)
a<-table.row.start(a)
a<-table.element(a,'Time lag k',header=TRUE)
a<-table.element(a,hyperlink('basics.htm','PACF(k)','click here for more information about the Partial Autocorrelation Function'),header=TRUE)
a<-table.element(a,'T-STAT',header=TRUE)
a<-table.element(a,'P-value',header=TRUE)
a<-table.row.end(a)
for (i in 1:par1) {
a<-table.row.start(a)
a<-table.element(a,i,header=TRUE)
a<-table.element(a,round(mypacf[i],6))
mytstat <- mypacf[i]*sqrtn
a<-table.element(a,round(mytstat,4))
a<-table.element(a,round(1-pt(abs(mytstat),lengthx),6))
a<-table.row.end(a)
}
a<-table.end(a)
table.save(a,file='mytable1.tab')