Free Statistics
of Irreproducible Research!
Description of Statistical Computation | |||||||||||||||||||||||||||||||||
|---|---|---|---|---|---|---|---|---|---|---|---|---|---|---|---|---|---|---|---|---|---|---|---|---|---|---|---|---|---|---|---|---|---|
| Author's title | |||||||||||||||||||||||||||||||||
| Author | *Unverified author* | ||||||||||||||||||||||||||||||||
| R Software Module | rwasp_density.wasp | ||||||||||||||||||||||||||||||||
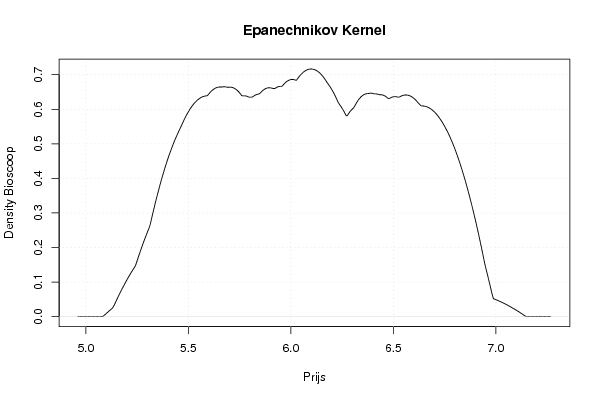
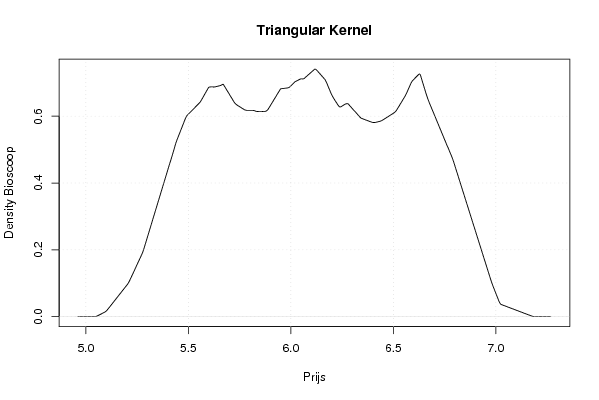
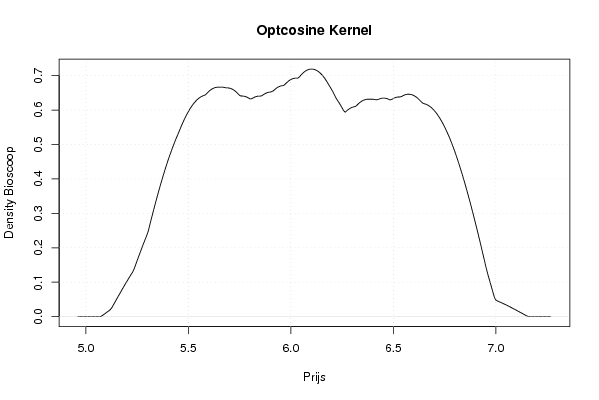
| Title produced by software | Kernel Density Estimation | ||||||||||||||||||||||||||||||||
| Date of computation | Tue, 19 Feb 2008 09:34:21 -0700 | ||||||||||||||||||||||||||||||||
| Cite this page as follows | Statistical Computations at FreeStatistics.org, Office for Research Development and Education, URL https://freestatistics.org/blog/index.php?v=date/2008/Feb/19/t1203438942a8s7u7r42vkfz83.htm/, Retrieved Tue, 09 Jun 2026 19:52:25 +0000 | ||||||||||||||||||||||||||||||||
| Statistical Computations at FreeStatistics.org, Office for Research Development and Education, URL https://freestatistics.org/blog/index.php?pk=8377, Retrieved Tue, 09 Jun 2026 19:52:25 +0000 | |||||||||||||||||||||||||||||||||
| QR Codes: | |||||||||||||||||||||||||||||||||
|
| |||||||||||||||||||||||||||||||||
| Original text written by user: | |||||||||||||||||||||||||||||||||
| IsPrivate? | No (this computation is public) | ||||||||||||||||||||||||||||||||
| User-defined keywords | Dichtheidsgrafiek van de bioscoop prijzen. | ||||||||||||||||||||||||||||||||
| Estimated Impact | 513 | ||||||||||||||||||||||||||||||||
Tree of Dependent Computations | |||||||||||||||||||||||||||||||||
| Family? (F = Feedback message, R = changed R code, M = changed R Module, P = changed Parameters, D = changed Data) | |||||||||||||||||||||||||||||||||
| - [Kernel Density Estimation] [Dichtheidsgrafiek...] [2008-02-19 16:34:21] [e5d4dd27997f361fc44e43a7aa346cdf] [Current] | |||||||||||||||||||||||||||||||||
| Feedback Forum | |||||||||||||||||||||||||||||||||
Post a new message | |||||||||||||||||||||||||||||||||
Dataset | |||||||||||||||||||||||||||||||||
| Dataseries X: | |||||||||||||||||||||||||||||||||
6,79 6,79 6,79 6,63 6,63 6,63 6,63 6,63 6,63 6,63 6,63 6,63 6,63 6,63 6,63 6,63 6,63 6,63 6,63 6,63 6,59 6,59 6,59 6,59 6,59 6,28 6,27 6,27 6,28 6,28 6,27 6,28 6,17 6,17 6,17 6,17 6,17 6,12 6,12 6,12 6,12 6,12 6,12 6,12 6,12 6,05 6,05 6,05 6,02 6,02 5,95 5,95 5,95 5,95 5,95 5,95 5,82 5,82 5,67 5,67 5,67 5,67 5,67 5,67 5,67 5,67 5,67 5,6 5,6 5,6 5,6 5,6 5,6 5,6 5,49 5,49 5,49 5,49 5,49 5,49 5,44 5,44 5,44 5,44 | |||||||||||||||||||||||||||||||||
Tables (Output of Computation) | |||||||||||||||||||||||||||||||||
| |||||||||||||||||||||||||||||||||
Figures (Output of Computation) | |||||||||||||||||||||||||||||||||
Input Parameters & R Code | |||||||||||||||||||||||||||||||||
| Parameters (Session): | |||||||||||||||||||||||||||||||||
| Parameters (R input): | |||||||||||||||||||||||||||||||||
| R code (references can be found in the software module): | |||||||||||||||||||||||||||||||||
bitmap(file='density1.png') | |||||||||||||||||||||||||||||||||