Free Statistics
of Irreproducible Research!
Description of Statistical Computation | |||||||||||||||||||||||||||||||||||||||||||||||||||||
|---|---|---|---|---|---|---|---|---|---|---|---|---|---|---|---|---|---|---|---|---|---|---|---|---|---|---|---|---|---|---|---|---|---|---|---|---|---|---|---|---|---|---|---|---|---|---|---|---|---|---|---|---|---|
| Author's title | |||||||||||||||||||||||||||||||||||||||||||||||||||||
| Author | *The author of this computation has been verified* | ||||||||||||||||||||||||||||||||||||||||||||||||||||
| R Software Module | rwasp_edauni.wasp | ||||||||||||||||||||||||||||||||||||||||||||||||||||
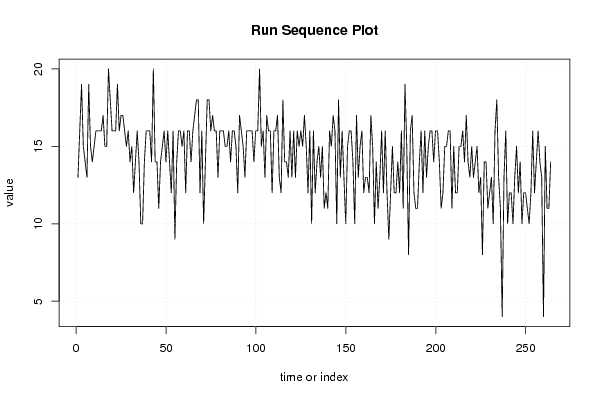
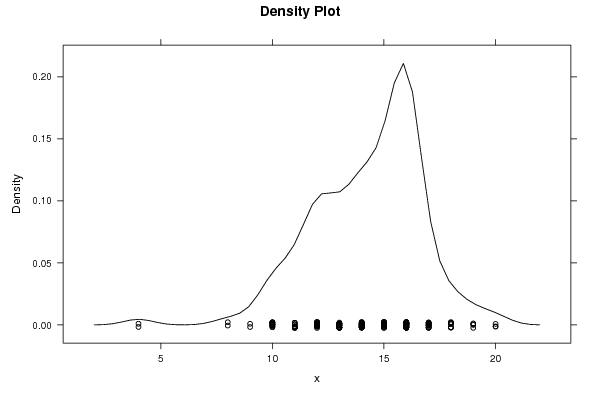
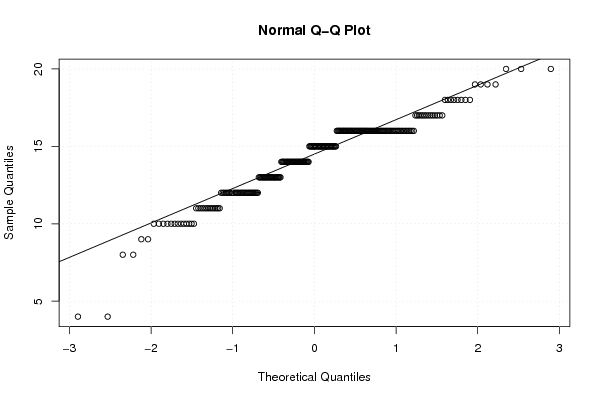
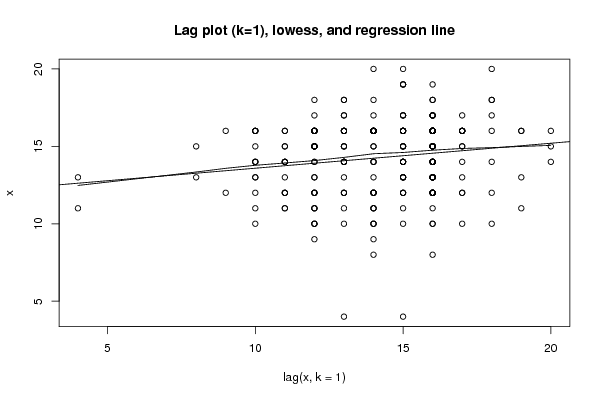
| Title produced by software | Univariate Explorative Data Analysis | ||||||||||||||||||||||||||||||||||||||||||||||||||||
| Date of computation | Wed, 17 Nov 2010 08:55:33 +0000 | ||||||||||||||||||||||||||||||||||||||||||||||||||||
| Cite this page as follows | Statistical Computations at FreeStatistics.org, Office for Research Development and Education, URL https://freestatistics.org/blog/index.php?v=date/2010/Nov/17/t1289984313fiq9ol6jc8ggb97.htm/, Retrieved Wed, 10 Jun 2026 18:25:08 +0000 | ||||||||||||||||||||||||||||||||||||||||||||||||||||
| Statistical Computations at FreeStatistics.org, Office for Research Development and Education, URL https://freestatistics.org/blog/index.php?pk=96536, Retrieved Wed, 10 Jun 2026 18:25:08 +0000 | |||||||||||||||||||||||||||||||||||||||||||||||||||||
| QR Codes: | |||||||||||||||||||||||||||||||||||||||||||||||||||||
|
| |||||||||||||||||||||||||||||||||||||||||||||||||||||
| Original text written by user: | |||||||||||||||||||||||||||||||||||||||||||||||||||||
| IsPrivate? | No (this computation is public) | ||||||||||||||||||||||||||||||||||||||||||||||||||||
| User-defined keywords | |||||||||||||||||||||||||||||||||||||||||||||||||||||
| Estimated Impact | 1359 | ||||||||||||||||||||||||||||||||||||||||||||||||||||
Tree of Dependent Computations | |||||||||||||||||||||||||||||||||||||||||||||||||||||
| Family? (F = Feedback message, R = changed R code, M = changed R Module, P = changed Parameters, D = changed Data) | |||||||||||||||||||||||||||||||||||||||||||||||||||||
| - [Univariate Explorative Data Analysis] [time effect in su...] [2010-11-17 08:55:33] [d76b387543b13b5e3afd8ff9e5fdc89f] [Current] - D [Univariate Explorative Data Analysis] [W7 Run Sequence Plot] [2010-11-19 10:53:33] [56d90b683fcd93137645f9226b43c62b] - [Univariate Explorative Data Analysis] [] [2010-11-23 21:48:37] [6e5489189f7de5cfbcc25dd35ae15009] - PD [Univariate Explorative Data Analysis] [Paper Run Sequenc...] [2010-12-05 17:30:39] [56d90b683fcd93137645f9226b43c62b] - D [Univariate Explorative Data Analysis] [Workshop 7 - Run ...] [2010-11-19 11:28:51] [6f0e7a2d1a07390e3505a2db8288f975] - P [Univariate Explorative Data Analysis] [W7] [2010-11-23 16:24:10] [5ddc7dfb25e070b079c4c8fcccc4d42e] - R D [Univariate Explorative Data Analysis] [run sequence plot...] [2010-11-19 11:30:00] [4eaa304e6a28c475ba490fccf4c01ad3] - R D [Univariate Explorative Data Analysis] [Workshop 7 - Run ...] [2010-11-19 11:29:29] [8b017ffbf7b0eded54d8efebfb3e4cfa] - [Univariate Explorative Data Analysis] [workshop 7 multip...] [2010-11-23 13:58:35] [af8eb90b4bf1bcfcc4325c143dbee260] - D [Univariate Explorative Data Analysis] [W7 run seq plot] [2010-11-23 20:54:54] [6e6854a111a7f2438dd668bfaa6f3aa0] - RM [Univariate Explorative Data Analysis] [hjjhhgh] [2011-11-20 13:57:43] [a9671b130b33f9fcb98554992ce4582f] - D [Univariate Explorative Data Analysis] [workshop 7 - tuto...] [2010-11-19 11:36:57] [956e8df26b41c50d9c6c2ec1b6a122a8] - D [Univariate Explorative Data Analysis] [WS7 comp 2] [2010-11-23 09:21:46] [dc30d19c3bc2be07fe595ad36c2cf923] F P [Univariate Explorative Data Analysis] [ws 7] [2010-11-23 18:35:16] [4f85667043e8913570b3eb8f368f82b2] - D [Univariate Explorative Data Analysis] [] [2010-12-01 14:40:52] [07fa8844ca5618cd0482008937d9acea] - [Univariate Explorative Data Analysis] [Workshop 7 run se...] [2010-12-02 20:31:42] [38afc57aa6474689f791e00be1754a89] - [Univariate Explorative Data Analysis] [] [2010-12-02 15:13:01] [2e1e44f0ae3cb9513dc28781dfdb387b] - R D [Univariate Explorative Data Analysis] [WS 7 run sequence...] [2011-11-24 16:30:23] [65d03b877b3f337979d6af245efa927d] - [Univariate Explorative Data Analysis] [] [2010-12-03 17:42:33] [b07cd1964830aab808142229b1166ece] - D [Univariate Explorative Data Analysis] [run sequence plot...] [2010-11-19 11:43:47] [74deae64b71f9d77c839af86f7c687b5] - D [Univariate Explorative Data Analysis] [] [2010-11-23 21:49:52] [8ef75e99f9f5061c72c54640f2f1c3e7] - D [Univariate Explorative Data Analysis] [Workshop 7 DMA] [2010-11-24 11:12:16] [74be16979710d4c4e7c6647856088456] - R PD [Univariate Explorative Data Analysis] [] [2011-11-21 19:58:29] [46d7ccc24e5d35a2decd922dfb3b3a39] - D [Univariate Explorative Data Analysis] [Sequence plot] [2010-11-19 11:46:26] [8a9a6f7c332640af31ddca253a8ded58] - D [Univariate Explorative Data Analysis] [] [2010-11-19 11:52:24] [7789b9488494790f41ddb7f073cada1b] - D [Univariate Explorative Data Analysis] [Run sequence plot...] [2010-11-19 11:56:19] [2960375a246cc0628590c95c4038a43c] - D [Univariate Explorative Data Analysis] [Multiple regressi...] [2010-11-22 11:31:22] [62f7c80c4d96454bbd2b2b026ea9aad9] - D [Univariate Explorative Data Analysis] [Run Sequence Plot...] [2010-11-26 10:10:34] [2960375a246cc0628590c95c4038a43c] - D [Univariate Explorative Data Analysis] [Run Sequence Plot...] [2010-11-27 08:37:42] [62f7c80c4d96454bbd2b2b026ea9aad9] - D [Univariate Explorative Data Analysis] [Run Sequence Plot...] [2010-11-30 12:21:09] [d7a673bc47e3999e70f4e1e2276e5189] F PD [Univariate Explorative Data Analysis] [run sequence plot...] [2010-11-26 10:14:42] [c1605865773cc027e55b238d879a644c] - RMPD [Multiple Regression] [Meervoudig regres...] [2010-11-26 10:30:30] [2960375a246cc0628590c95c4038a43c] - D [Multiple Regression] [Regressiemodel 1] [2010-11-27 09:03:12] [62f7c80c4d96454bbd2b2b026ea9aad9] - D [Multiple Regression] [Meervoudig regres...] [2010-11-30 12:23:01] [d7a673bc47e3999e70f4e1e2276e5189] - D [Univariate Explorative Data Analysis] [WS7: Mini-tutorial d] [2010-11-19 13:46:44] [1fd136673b2a4fecb5c545b9b4a05d64] - [Univariate Explorative Data Analysis] [ws7 mini-tutorial 2] [2010-11-23 18:02:20] [e4076051fbfb461c886b1e223cd7862f] - [Univariate Explorative Data Analysis] [ws7 mini2] [2010-11-23 18:33:09] [e4076051fbfb461c886b1e223cd7862f] - R [Univariate Explorative Data Analysis] [WS7] [2013-11-19 22:47:57] [74be16979710d4c4e7c6647856088456] - D [Univariate Explorative Data Analysis] [Run Sequence Plot...] [2010-11-20 09:17:59] [aeb27d5c05332f2e597ad139ee63fbe4] - D [Univariate Explorative Data Analysis] [ws7- mini tut] [2010-11-20 12:12:10] [4a7069087cf9e0eda253aeed7d8c30d6] - D [Univariate Explorative Data Analysis] [Run sequency plot...] [2010-11-20 14:46:56] [95e8426e0df851c9330605aa1e892ab5] - [Univariate Explorative Data Analysis] [] [2010-12-01 15:00:34] [42a441ca3193af442aa2201743dfb347] - [Univariate Explorative Data Analysis] [] [2010-12-03 17:26:41] [5e7b9ab9ddedd2d2f5ce6c303ba3ebe3] - PD [Univariate Explorative Data Analysis] [run sequence plot...] [2011-11-24 10:08:43] [ca5872d1d4d784184b94263c274137e3] - RMPD [Multiple Regression] [tre] [2011-11-24 10:14:29] [ca5872d1d4d784184b94263c274137e3] - [Univariate Explorative Data Analysis] [] [2010-12-02 18:18:18] [fa409bd323d47d7cf4d4bfe80571749f] - R PD [Univariate Explorative Data Analysis] [WS7 - mini tutori...] [2011-11-22 15:03:06] [74be16979710d4c4e7c6647856088456] - D [Univariate Explorative Data Analysis] [Workshop 7 sequen...] [2011-11-23 09:41:16] [b1d8f9e536fbb1cbb331f583f7f5f24b] - RM [Univariate Explorative Data Analysis] [] [2011-11-24 18:54:24] [7d86e24de0a0f8503ecffdef58e8c96c] [Truncated] | |||||||||||||||||||||||||||||||||||||||||||||||||||||
| Feedback Forum | |||||||||||||||||||||||||||||||||||||||||||||||||||||
Post a new message | |||||||||||||||||||||||||||||||||||||||||||||||||||||
Dataset | |||||||||||||||||||||||||||||||||||||||||||||||||||||
| Dataseries X: | |||||||||||||||||||||||||||||||||||||||||||||||||||||
13 16 19 15 14 13 19 15 14 15 16 16 16 16 17 15 15 20 18 16 16 16 19 16 17 17 16 15 16 14 15 12 14 16 14 10 10 14 16 16 16 14 20 14 14 11 14 15 16 14 16 14 12 16 9 14 16 16 15 16 12 16 16 14 16 17 18 18 12 16 10 14 18 18 16 17 16 16 13 16 16 16 15 15 16 14 16 16 15 12 17 16 15 13 16 16 16 16 14 16 16 20 15 16 13 17 16 16 12 16 16 17 13 12 18 14 14 13 16 13 16 13 16 15 16 15 17 15 12 16 10 16 12 14 15 13 15 11 12 11 16 15 17 16 10 18 13 16 13 10 15 16 16 14 10 17 13 15 16 12 13 13 12 17 15 10 14 11 13 16 12 16 12 9 12 15 12 12 14 12 16 11 19 15 8 16 17 12 11 11 14 16 12 16 13 15 16 16 14 16 16 14 11 12 15 15 16 16 11 15 12 12 15 15 16 14 17 14 13 15 13 14 15 12 13 8 14 14 11 12 13 10 16 18 13 11 4 13 16 10 12 12 10 13 15 12 14 10 12 12 11 10 12 16 12 14 16 14 13 4 15 11 11 14 | |||||||||||||||||||||||||||||||||||||||||||||||||||||
Tables (Output of Computation) | |||||||||||||||||||||||||||||||||||||||||||||||||||||
| |||||||||||||||||||||||||||||||||||||||||||||||||||||
Figures (Output of Computation) | |||||||||||||||||||||||||||||||||||||||||||||||||||||
Input Parameters & R Code | |||||||||||||||||||||||||||||||||||||||||||||||||||||
| Parameters (Session): | |||||||||||||||||||||||||||||||||||||||||||||||||||||
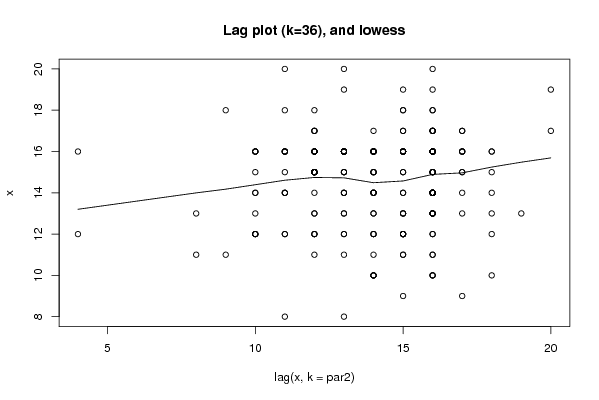
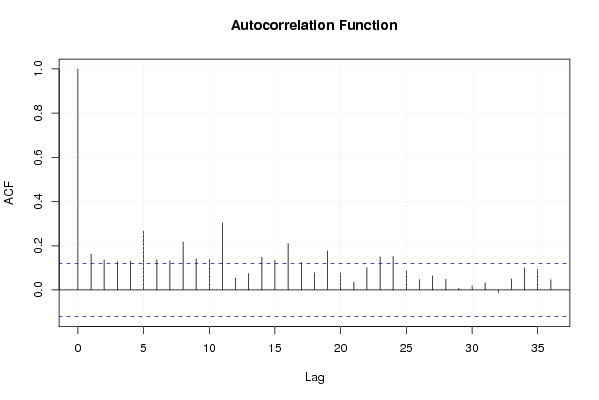
| par1 = 0 ; par2 = 36 ; | |||||||||||||||||||||||||||||||||||||||||||||||||||||
| Parameters (R input): | |||||||||||||||||||||||||||||||||||||||||||||||||||||
| par1 = 0 ; par2 = 36 ; | |||||||||||||||||||||||||||||||||||||||||||||||||||||
| R code (references can be found in the software module): | |||||||||||||||||||||||||||||||||||||||||||||||||||||
par1 <- as.numeric(par1) | |||||||||||||||||||||||||||||||||||||||||||||||||||||