Free Statistics

of Irreproducible Research!

Author's title

Author*Unverified author*
R Software Modulerwasp_autocorrelation.wasp
Title produced by software(Partial) Autocorrelation Function
Date of computationTue, 02 Dec 2008 09:05:49 -0700
Cite this page as followsStatistical Computations at FreeStatistics.org, Office for Research Development and Education, URL https://freestatistics.org/blog/index.php?v=date/2008/Dec/02/t1228234010f25wack3b04bbu7.htm/, Retrieved Sat, 18 May 2024 06:30:16 +0000
Statistical Computations at FreeStatistics.org, Office for Research Development and Education, URL https://freestatistics.org/blog/index.php?pk=28001, Retrieved Sat, 18 May 2024 06:30:16 +0000
QR Codes:

Original text written by user:
IsPrivate?No (this computation is public)
User-defined keywords
Estimated Impact135
Family? (F = Feedback message, R = changed R code, M = changed R Module, P = changed Parameters, D = changed Data)
-       [(Partial) Autocorrelation Function] [Non stationary ti...] [2008-12-02 16:05:49] [b72e060d4eaf5aae1831b15bc791ef7e] [Current]
Feedback Forum

Post a new message
Dataseries X:
97.3
101
113.2
101
105.7
113.9
86.4
96.5
103.3
114.9
105.8
94.2
98.4
99.4
108.8
112.6
104.4
112.2
81.1
97.1
112.6
113.8
107.8
103.2
103.3
101.2
107.7
110.4
101.9
115.9
89.9
88.6
117.2
123.9
100
103.6
94.1
98.7
119.5
112.7
104.4
124.7
89.1
97
121.6
118.8
114
111.5
97.2
102.5
113.4
109.8
104.9
126.1
80
96.8
117.2
112.3
117.3
111.1
102.2
104.3
122.9
107.6
121.3
131.5
89
104.4
128.9
135.9
133.3
121.3
120.5
120.4
137.9
126.1
133.2
151.1
105
119
140.4
156.6
137.1
122.7


Summary of computational transaction
Raw Inputview raw input (R code)
Raw Outputview raw output of R engine
Computing time3 seconds
R Server'Herman Ole Andreas Wold' @ 193.190.124.10:1001

\begin{tabular}{lllllllll}
\hline
Summary of computational transaction \tabularnewline
Raw Input & view raw input (R code)  \tabularnewline
Raw Output & view raw output of R engine  \tabularnewline
Computing time & 3 seconds \tabularnewline
R Server & 'Herman Ole Andreas Wold' @ 193.190.124.10:1001 \tabularnewline
\hline
\end{tabular}
%Source: https://freestatistics.org/blog/index.php?pk=28001&T=0

[TABLE]
[ROW][C]Summary of computational transaction[/C][/ROW]
[ROW][C]Raw Input[/C][C]view raw input (R code) [/C][/ROW]
[ROW][C]Raw Output[/C][C]view raw output of R engine [/C][/ROW]
[ROW][C]Computing time[/C][C]3 seconds[/C][/ROW]
[ROW][C]R Server[/C][C]'Herman Ole Andreas Wold' @ 193.190.124.10:1001[/C][/ROW]
[/TABLE]
Source: https://freestatistics.org/blog/index.php?pk=28001&T=0

Globally Unique Identifier (entire table): ba.freestatistics.org/blog/index.php?pk=28001&T=0

As an alternative you can also use a QR Code:  

The GUIDs for individual cells are displayed in the table below:

Summary of computational transaction
Raw Inputview raw input (R code)
Raw Outputview raw output of R engine
Computing time3 seconds
R Server'Herman Ole Andreas Wold' @ 193.190.124.10:1001


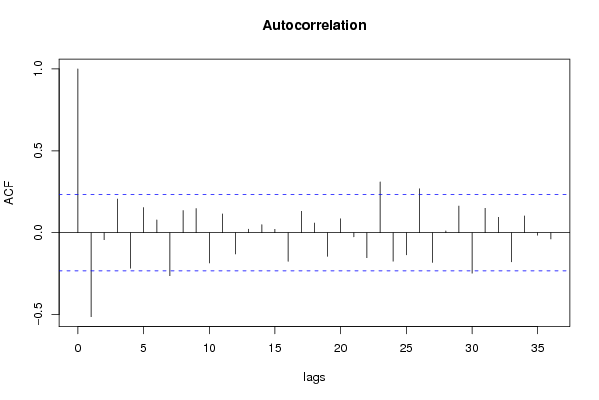
Autocorrelation Function
Time lag kACF(k)T-STATP-value
1-0.512922-4.3222.5e-05
2-0.042591-0.35890.360375
30.2054591.73120.043877
4-0.216599-1.82510.036096
50.1535011.29340.100028
60.0776140.6540.257615
7-0.262755-2.2140.01502
80.1353271.14030.129
90.1475141.2430.108984
10-0.185052-1.55930.061689
110.1144490.96440.169067
12-0.130208-1.09720.13814
130.0211750.17840.429448
140.0491540.41420.339994
150.0207770.17510.430761
16-0.174952-1.47420.072428
170.1306851.10120.13727
180.0589520.49670.310454
19-0.14428-1.21570.114059
200.0845180.71220.23935
21-0.025493-0.21480.415268
22-0.153008-1.28930.100745
230.30962.60870.005537
24-0.174569-1.47090.072862
25-0.134996-1.13750.129577
260.2678412.25690.013548
27-0.181887-1.53260.064908
280.0106340.08960.464428
290.1622941.36750.087889
30-0.247228-2.08320.020419
310.1491551.25680.106473
320.0937620.79010.216063
33-0.178049-1.50030.06899
340.1023330.86230.195721
35-0.015742-0.13260.447424
36-0.03844-0.32390.373482

\begin{tabular}{lllllllll}
\hline
Autocorrelation Function \tabularnewline
Time lag k & ACF(k) & T-STAT & P-value \tabularnewline
1 & -0.512922 & -4.322 & 2.5e-05 \tabularnewline
2 & -0.042591 & -0.3589 & 0.360375 \tabularnewline
3 & 0.205459 & 1.7312 & 0.043877 \tabularnewline
4 & -0.216599 & -1.8251 & 0.036096 \tabularnewline
5 & 0.153501 & 1.2934 & 0.100028 \tabularnewline
6 & 0.077614 & 0.654 & 0.257615 \tabularnewline
7 & -0.262755 & -2.214 & 0.01502 \tabularnewline
8 & 0.135327 & 1.1403 & 0.129 \tabularnewline
9 & 0.147514 & 1.243 & 0.108984 \tabularnewline
10 & -0.185052 & -1.5593 & 0.061689 \tabularnewline
11 & 0.114449 & 0.9644 & 0.169067 \tabularnewline
12 & -0.130208 & -1.0972 & 0.13814 \tabularnewline
13 & 0.021175 & 0.1784 & 0.429448 \tabularnewline
14 & 0.049154 & 0.4142 & 0.339994 \tabularnewline
15 & 0.020777 & 0.1751 & 0.430761 \tabularnewline
16 & -0.174952 & -1.4742 & 0.072428 \tabularnewline
17 & 0.130685 & 1.1012 & 0.13727 \tabularnewline
18 & 0.058952 & 0.4967 & 0.310454 \tabularnewline
19 & -0.14428 & -1.2157 & 0.114059 \tabularnewline
20 & 0.084518 & 0.7122 & 0.23935 \tabularnewline
21 & -0.025493 & -0.2148 & 0.415268 \tabularnewline
22 & -0.153008 & -1.2893 & 0.100745 \tabularnewline
23 & 0.3096 & 2.6087 & 0.005537 \tabularnewline
24 & -0.174569 & -1.4709 & 0.072862 \tabularnewline
25 & -0.134996 & -1.1375 & 0.129577 \tabularnewline
26 & 0.267841 & 2.2569 & 0.013548 \tabularnewline
27 & -0.181887 & -1.5326 & 0.064908 \tabularnewline
28 & 0.010634 & 0.0896 & 0.464428 \tabularnewline
29 & 0.162294 & 1.3675 & 0.087889 \tabularnewline
30 & -0.247228 & -2.0832 & 0.020419 \tabularnewline
31 & 0.149155 & 1.2568 & 0.106473 \tabularnewline
32 & 0.093762 & 0.7901 & 0.216063 \tabularnewline
33 & -0.178049 & -1.5003 & 0.06899 \tabularnewline
34 & 0.102333 & 0.8623 & 0.195721 \tabularnewline
35 & -0.015742 & -0.1326 & 0.447424 \tabularnewline
36 & -0.03844 & -0.3239 & 0.373482 \tabularnewline
\hline
\end{tabular}
%Source: https://freestatistics.org/blog/index.php?pk=28001&T=1

[TABLE]
[ROW][C]Autocorrelation Function[/C][/ROW]
[ROW][C]Time lag k[/C][C]ACF(k)[/C][C]T-STAT[/C][C]P-value[/C][/ROW]
[ROW][C]1[/C][C]-0.512922[/C][C]-4.322[/C][C]2.5e-05[/C][/ROW]
[ROW][C]2[/C][C]-0.042591[/C][C]-0.3589[/C][C]0.360375[/C][/ROW]
[ROW][C]3[/C][C]0.205459[/C][C]1.7312[/C][C]0.043877[/C][/ROW]
[ROW][C]4[/C][C]-0.216599[/C][C]-1.8251[/C][C]0.036096[/C][/ROW]
[ROW][C]5[/C][C]0.153501[/C][C]1.2934[/C][C]0.100028[/C][/ROW]
[ROW][C]6[/C][C]0.077614[/C][C]0.654[/C][C]0.257615[/C][/ROW]
[ROW][C]7[/C][C]-0.262755[/C][C]-2.214[/C][C]0.01502[/C][/ROW]
[ROW][C]8[/C][C]0.135327[/C][C]1.1403[/C][C]0.129[/C][/ROW]
[ROW][C]9[/C][C]0.147514[/C][C]1.243[/C][C]0.108984[/C][/ROW]
[ROW][C]10[/C][C]-0.185052[/C][C]-1.5593[/C][C]0.061689[/C][/ROW]
[ROW][C]11[/C][C]0.114449[/C][C]0.9644[/C][C]0.169067[/C][/ROW]
[ROW][C]12[/C][C]-0.130208[/C][C]-1.0972[/C][C]0.13814[/C][/ROW]
[ROW][C]13[/C][C]0.021175[/C][C]0.1784[/C][C]0.429448[/C][/ROW]
[ROW][C]14[/C][C]0.049154[/C][C]0.4142[/C][C]0.339994[/C][/ROW]
[ROW][C]15[/C][C]0.020777[/C][C]0.1751[/C][C]0.430761[/C][/ROW]
[ROW][C]16[/C][C]-0.174952[/C][C]-1.4742[/C][C]0.072428[/C][/ROW]
[ROW][C]17[/C][C]0.130685[/C][C]1.1012[/C][C]0.13727[/C][/ROW]
[ROW][C]18[/C][C]0.058952[/C][C]0.4967[/C][C]0.310454[/C][/ROW]
[ROW][C]19[/C][C]-0.14428[/C][C]-1.2157[/C][C]0.114059[/C][/ROW]
[ROW][C]20[/C][C]0.084518[/C][C]0.7122[/C][C]0.23935[/C][/ROW]
[ROW][C]21[/C][C]-0.025493[/C][C]-0.2148[/C][C]0.415268[/C][/ROW]
[ROW][C]22[/C][C]-0.153008[/C][C]-1.2893[/C][C]0.100745[/C][/ROW]
[ROW][C]23[/C][C]0.3096[/C][C]2.6087[/C][C]0.005537[/C][/ROW]
[ROW][C]24[/C][C]-0.174569[/C][C]-1.4709[/C][C]0.072862[/C][/ROW]
[ROW][C]25[/C][C]-0.134996[/C][C]-1.1375[/C][C]0.129577[/C][/ROW]
[ROW][C]26[/C][C]0.267841[/C][C]2.2569[/C][C]0.013548[/C][/ROW]
[ROW][C]27[/C][C]-0.181887[/C][C]-1.5326[/C][C]0.064908[/C][/ROW]
[ROW][C]28[/C][C]0.010634[/C][C]0.0896[/C][C]0.464428[/C][/ROW]
[ROW][C]29[/C][C]0.162294[/C][C]1.3675[/C][C]0.087889[/C][/ROW]
[ROW][C]30[/C][C]-0.247228[/C][C]-2.0832[/C][C]0.020419[/C][/ROW]
[ROW][C]31[/C][C]0.149155[/C][C]1.2568[/C][C]0.106473[/C][/ROW]
[ROW][C]32[/C][C]0.093762[/C][C]0.7901[/C][C]0.216063[/C][/ROW]
[ROW][C]33[/C][C]-0.178049[/C][C]-1.5003[/C][C]0.06899[/C][/ROW]
[ROW][C]34[/C][C]0.102333[/C][C]0.8623[/C][C]0.195721[/C][/ROW]
[ROW][C]35[/C][C]-0.015742[/C][C]-0.1326[/C][C]0.447424[/C][/ROW]
[ROW][C]36[/C][C]-0.03844[/C][C]-0.3239[/C][C]0.373482[/C][/ROW]
[/TABLE]
Source: https://freestatistics.org/blog/index.php?pk=28001&T=1

Globally Unique Identifier (entire table): ba.freestatistics.org/blog/index.php?pk=28001&T=1

As an alternative you can also use a QR Code:  

The GUIDs for individual cells are displayed in the table below:

Autocorrelation Function
Time lag kACF(k)T-STATP-value
1-0.512922-4.3222.5e-05
2-0.042591-0.35890.360375
30.2054591.73120.043877
4-0.216599-1.82510.036096
50.1535011.29340.100028
60.0776140.6540.257615
7-0.262755-2.2140.01502
80.1353271.14030.129
90.1475141.2430.108984
10-0.185052-1.55930.061689
110.1144490.96440.169067
12-0.130208-1.09720.13814
130.0211750.17840.429448
140.0491540.41420.339994
150.0207770.17510.430761
16-0.174952-1.47420.072428
170.1306851.10120.13727
180.0589520.49670.310454
19-0.14428-1.21570.114059
200.0845180.71220.23935
21-0.025493-0.21480.415268
22-0.153008-1.28930.100745
230.30962.60870.005537
24-0.174569-1.47090.072862
25-0.134996-1.13750.129577
260.2678412.25690.013548
27-0.181887-1.53260.064908
280.0106340.08960.464428
290.1622941.36750.087889
30-0.247228-2.08320.020419
310.1491551.25680.106473
320.0937620.79010.216063
33-0.178049-1.50030.06899
340.1023330.86230.195721
35-0.015742-0.13260.447424
36-0.03844-0.32390.373482


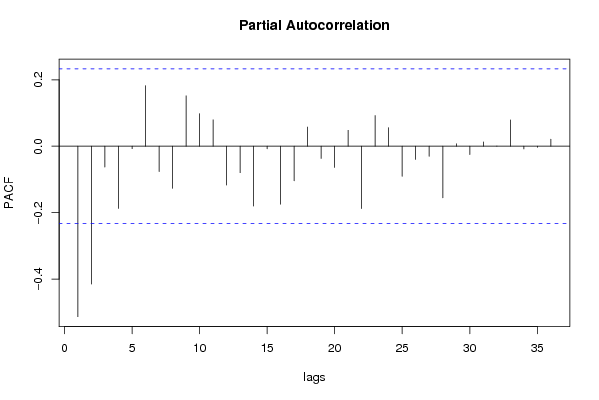
Partial Autocorrelation Function
Time lag kPACF(k)T-STATP-value
1-0.512922-4.3222.5e-05
2-0.414813-3.49530.00041
3-0.062637-0.52780.299646
4-0.18741-1.57910.059374
5-0.007432-0.06260.47512
60.182351.53650.064429
7-0.076297-0.64290.261184
8-0.126645-1.06710.144764
90.1515681.27710.102857
100.0978310.82430.206254
110.0794590.66950.252663
12-0.116719-0.98350.164352
13-0.079509-0.670.252531
14-0.17992-1.5160.066976
15-0.00776-0.06540.474025
16-0.174605-1.47120.072822
17-0.103978-0.87610.191957
180.0575530.48490.314602
19-0.0369-0.31090.378385
20-0.063669-0.53650.296649
210.0480250.40470.343469
22-0.187621-1.58090.05917
230.0923450.77810.219543
240.0559450.47140.3194
25-0.090457-0.76220.224232
26-0.039689-0.33440.369522
27-0.03031-0.25540.399579
28-0.15539-1.30930.09732
290.007410.06240.475193
30-0.025218-0.21250.416167
310.0129460.10910.456722
320.0006370.00540.497865
330.0792960.66820.2531
34-0.008258-0.06960.472362
35-0.003232-0.02720.489175
360.0210490.17740.429863

\begin{tabular}{lllllllll}
\hline
Partial Autocorrelation Function \tabularnewline
Time lag k & PACF(k) & T-STAT & P-value \tabularnewline
1 & -0.512922 & -4.322 & 2.5e-05 \tabularnewline
2 & -0.414813 & -3.4953 & 0.00041 \tabularnewline
3 & -0.062637 & -0.5278 & 0.299646 \tabularnewline
4 & -0.18741 & -1.5791 & 0.059374 \tabularnewline
5 & -0.007432 & -0.0626 & 0.47512 \tabularnewline
6 & 0.18235 & 1.5365 & 0.064429 \tabularnewline
7 & -0.076297 & -0.6429 & 0.261184 \tabularnewline
8 & -0.126645 & -1.0671 & 0.144764 \tabularnewline
9 & 0.151568 & 1.2771 & 0.102857 \tabularnewline
10 & 0.097831 & 0.8243 & 0.206254 \tabularnewline
11 & 0.079459 & 0.6695 & 0.252663 \tabularnewline
12 & -0.116719 & -0.9835 & 0.164352 \tabularnewline
13 & -0.079509 & -0.67 & 0.252531 \tabularnewline
14 & -0.17992 & -1.516 & 0.066976 \tabularnewline
15 & -0.00776 & -0.0654 & 0.474025 \tabularnewline
16 & -0.174605 & -1.4712 & 0.072822 \tabularnewline
17 & -0.103978 & -0.8761 & 0.191957 \tabularnewline
18 & 0.057553 & 0.4849 & 0.314602 \tabularnewline
19 & -0.0369 & -0.3109 & 0.378385 \tabularnewline
20 & -0.063669 & -0.5365 & 0.296649 \tabularnewline
21 & 0.048025 & 0.4047 & 0.343469 \tabularnewline
22 & -0.187621 & -1.5809 & 0.05917 \tabularnewline
23 & 0.092345 & 0.7781 & 0.219543 \tabularnewline
24 & 0.055945 & 0.4714 & 0.3194 \tabularnewline
25 & -0.090457 & -0.7622 & 0.224232 \tabularnewline
26 & -0.039689 & -0.3344 & 0.369522 \tabularnewline
27 & -0.03031 & -0.2554 & 0.399579 \tabularnewline
28 & -0.15539 & -1.3093 & 0.09732 \tabularnewline
29 & 0.00741 & 0.0624 & 0.475193 \tabularnewline
30 & -0.025218 & -0.2125 & 0.416167 \tabularnewline
31 & 0.012946 & 0.1091 & 0.456722 \tabularnewline
32 & 0.000637 & 0.0054 & 0.497865 \tabularnewline
33 & 0.079296 & 0.6682 & 0.2531 \tabularnewline
34 & -0.008258 & -0.0696 & 0.472362 \tabularnewline
35 & -0.003232 & -0.0272 & 0.489175 \tabularnewline
36 & 0.021049 & 0.1774 & 0.429863 \tabularnewline
\hline
\end{tabular}
%Source: https://freestatistics.org/blog/index.php?pk=28001&T=2

[TABLE]
[ROW][C]Partial Autocorrelation Function[/C][/ROW]
[ROW][C]Time lag k[/C][C]PACF(k)[/C][C]T-STAT[/C][C]P-value[/C][/ROW]
[ROW][C]1[/C][C]-0.512922[/C][C]-4.322[/C][C]2.5e-05[/C][/ROW]
[ROW][C]2[/C][C]-0.414813[/C][C]-3.4953[/C][C]0.00041[/C][/ROW]
[ROW][C]3[/C][C]-0.062637[/C][C]-0.5278[/C][C]0.299646[/C][/ROW]
[ROW][C]4[/C][C]-0.18741[/C][C]-1.5791[/C][C]0.059374[/C][/ROW]
[ROW][C]5[/C][C]-0.007432[/C][C]-0.0626[/C][C]0.47512[/C][/ROW]
[ROW][C]6[/C][C]0.18235[/C][C]1.5365[/C][C]0.064429[/C][/ROW]
[ROW][C]7[/C][C]-0.076297[/C][C]-0.6429[/C][C]0.261184[/C][/ROW]
[ROW][C]8[/C][C]-0.126645[/C][C]-1.0671[/C][C]0.144764[/C][/ROW]
[ROW][C]9[/C][C]0.151568[/C][C]1.2771[/C][C]0.102857[/C][/ROW]
[ROW][C]10[/C][C]0.097831[/C][C]0.8243[/C][C]0.206254[/C][/ROW]
[ROW][C]11[/C][C]0.079459[/C][C]0.6695[/C][C]0.252663[/C][/ROW]
[ROW][C]12[/C][C]-0.116719[/C][C]-0.9835[/C][C]0.164352[/C][/ROW]
[ROW][C]13[/C][C]-0.079509[/C][C]-0.67[/C][C]0.252531[/C][/ROW]
[ROW][C]14[/C][C]-0.17992[/C][C]-1.516[/C][C]0.066976[/C][/ROW]
[ROW][C]15[/C][C]-0.00776[/C][C]-0.0654[/C][C]0.474025[/C][/ROW]
[ROW][C]16[/C][C]-0.174605[/C][C]-1.4712[/C][C]0.072822[/C][/ROW]
[ROW][C]17[/C][C]-0.103978[/C][C]-0.8761[/C][C]0.191957[/C][/ROW]
[ROW][C]18[/C][C]0.057553[/C][C]0.4849[/C][C]0.314602[/C][/ROW]
[ROW][C]19[/C][C]-0.0369[/C][C]-0.3109[/C][C]0.378385[/C][/ROW]
[ROW][C]20[/C][C]-0.063669[/C][C]-0.5365[/C][C]0.296649[/C][/ROW]
[ROW][C]21[/C][C]0.048025[/C][C]0.4047[/C][C]0.343469[/C][/ROW]
[ROW][C]22[/C][C]-0.187621[/C][C]-1.5809[/C][C]0.05917[/C][/ROW]
[ROW][C]23[/C][C]0.092345[/C][C]0.7781[/C][C]0.219543[/C][/ROW]
[ROW][C]24[/C][C]0.055945[/C][C]0.4714[/C][C]0.3194[/C][/ROW]
[ROW][C]25[/C][C]-0.090457[/C][C]-0.7622[/C][C]0.224232[/C][/ROW]
[ROW][C]26[/C][C]-0.039689[/C][C]-0.3344[/C][C]0.369522[/C][/ROW]
[ROW][C]27[/C][C]-0.03031[/C][C]-0.2554[/C][C]0.399579[/C][/ROW]
[ROW][C]28[/C][C]-0.15539[/C][C]-1.3093[/C][C]0.09732[/C][/ROW]
[ROW][C]29[/C][C]0.00741[/C][C]0.0624[/C][C]0.475193[/C][/ROW]
[ROW][C]30[/C][C]-0.025218[/C][C]-0.2125[/C][C]0.416167[/C][/ROW]
[ROW][C]31[/C][C]0.012946[/C][C]0.1091[/C][C]0.456722[/C][/ROW]
[ROW][C]32[/C][C]0.000637[/C][C]0.0054[/C][C]0.497865[/C][/ROW]
[ROW][C]33[/C][C]0.079296[/C][C]0.6682[/C][C]0.2531[/C][/ROW]
[ROW][C]34[/C][C]-0.008258[/C][C]-0.0696[/C][C]0.472362[/C][/ROW]
[ROW][C]35[/C][C]-0.003232[/C][C]-0.0272[/C][C]0.489175[/C][/ROW]
[ROW][C]36[/C][C]0.021049[/C][C]0.1774[/C][C]0.429863[/C][/ROW]
[/TABLE]
Source: https://freestatistics.org/blog/index.php?pk=28001&T=2

Globally Unique Identifier (entire table): ba.freestatistics.org/blog/index.php?pk=28001&T=2

As an alternative you can also use a QR Code:  

The GUIDs for individual cells are displayed in the table below:

Partial Autocorrelation Function
Time lag kPACF(k)T-STATP-value
1-0.512922-4.3222.5e-05
2-0.414813-3.49530.00041
3-0.062637-0.52780.299646
4-0.18741-1.57910.059374
5-0.007432-0.06260.47512
60.182351.53650.064429
7-0.076297-0.64290.261184
8-0.126645-1.06710.144764
90.1515681.27710.102857
100.0978310.82430.206254
110.0794590.66950.252663
12-0.116719-0.98350.164352
13-0.079509-0.670.252531
14-0.17992-1.5160.066976
15-0.00776-0.06540.474025
16-0.174605-1.47120.072822
17-0.103978-0.87610.191957
180.0575530.48490.314602
19-0.0369-0.31090.378385
20-0.063669-0.53650.296649
210.0480250.40470.343469
22-0.187621-1.58090.05917
230.0923450.77810.219543
240.0559450.47140.3194
25-0.090457-0.76220.224232
26-0.039689-0.33440.369522
27-0.03031-0.25540.399579
28-0.15539-1.30930.09732
290.007410.06240.475193
30-0.025218-0.21250.416167
310.0129460.10910.456722
320.0006370.00540.497865
330.0792960.66820.2531
34-0.008258-0.06960.472362
35-0.003232-0.02720.489175
360.0210490.17740.429863


Parameters (Session):
par1 = 36 ; par2 = 1 ; par3 = 1 ; par4 = 1 ; par5 = 12 ;
Parameters (R input):
par1 = 36 ; par2 = 1 ; par3 = 1 ; par4 = 1 ; par5 = 12 ;
R code (references can be found in the software module):
if (par1 == 'Default') {
par1 = 10*log10(length(x))
} else {
par1 <- as.numeric(par1)
}
par2 <- as.numeric(par2)
par3 <- as.numeric(par3)
par4 <- as.numeric(par4)
par5 <- as.numeric(par5)
if (par2 == 0) {
x <- log(x)
} else {
x <- (x ^ par2 - 1) / par2
}
if (par3 > 0) x <- diff(x,lag=1,difference=par3)
if (par4 > 0) x <- diff(x,lag=par5,difference=par4)
bitmap(file='pic1.png')
racf <- acf(x,par1,main='Autocorrelation',xlab='lags',ylab='ACF')
dev.off()
bitmap(file='pic2.png')
rpacf <- pacf(x,par1,main='Partial Autocorrelation',xlab='lags',ylab='PACF')
dev.off()
(myacf <- c(racf$acf))
(mypacf <- c(rpacf$acf))
lengthx <- length(x)
sqrtn <- sqrt(lengthx)
load(file='createtable')
a<-table.start()
a<-table.row.start(a)
a<-table.element(a,'Autocorrelation Function',4,TRUE)
a<-table.row.end(a)
a<-table.row.start(a)
a<-table.element(a,'Time lag k',header=TRUE)
a<-table.element(a,hyperlink('basics.htm','ACF(k)','click here for more information about the Autocorrelation Function'),header=TRUE)
a<-table.element(a,'T-STAT',header=TRUE)
a<-table.element(a,'P-value',header=TRUE)
a<-table.row.end(a)
for (i in 2:(par1+1)) {
a<-table.row.start(a)
a<-table.element(a,i-1,header=TRUE)
a<-table.element(a,round(myacf[i],6))
mytstat <- myacf[i]*sqrtn
a<-table.element(a,round(mytstat,4))
a<-table.element(a,round(1-pt(abs(mytstat),lengthx),6))
a<-table.row.end(a)
}
a<-table.end(a)
table.save(a,file='mytable.tab')
a<-table.start()
a<-table.row.start(a)
a<-table.element(a,'Partial Autocorrelation Function',4,TRUE)
a<-table.row.end(a)
a<-table.row.start(a)
a<-table.element(a,'Time lag k',header=TRUE)
a<-table.element(a,hyperlink('basics.htm','PACF(k)','click here for more information about the Partial Autocorrelation Function'),header=TRUE)
a<-table.element(a,'T-STAT',header=TRUE)
a<-table.element(a,'P-value',header=TRUE)
a<-table.row.end(a)
for (i in 1:par1) {
a<-table.row.start(a)
a<-table.element(a,i,header=TRUE)
a<-table.element(a,round(mypacf[i],6))
mytstat <- mypacf[i]*sqrtn
a<-table.element(a,round(mytstat,4))
a<-table.element(a,round(1-pt(abs(mytstat),lengthx),6))
a<-table.row.end(a)
}
a<-table.end(a)
table.save(a,file='mytable1.tab')