Free Statistics

of Irreproducible Research!

Author's title

Author*Unverified author*
R Software Modulerwasp_cross.wasp
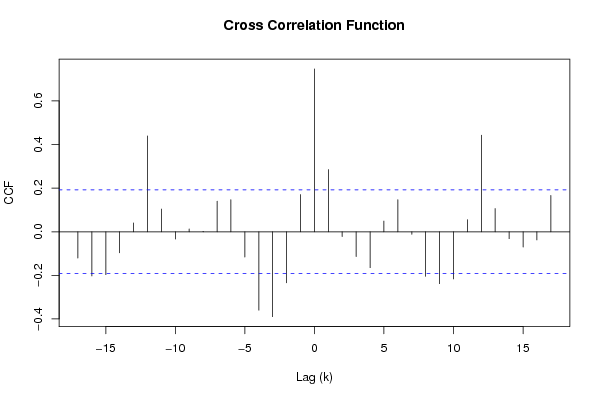
Title produced by softwareCross Correlation Function
Date of computationTue, 02 Dec 2008 11:22:47 -0700
Cite this page as followsStatistical Computations at FreeStatistics.org, Office for Research Development and Education, URL https://freestatistics.org/blog/index.php?v=date/2008/Dec/02/t1228242194ns3msw6ip93bs9b.htm/, Retrieved Sat, 18 May 2024 07:29:06 +0000
Statistical Computations at FreeStatistics.org, Office for Research Development and Education, URL https://freestatistics.org/blog/index.php?pk=28214, Retrieved Sat, 18 May 2024 07:29:06 +0000
QR Codes:

Original text written by user:
IsPrivate?No (this computation is public)
User-defined keywords
Estimated Impact165
Family? (F = Feedback message, R = changed R code, M = changed R Module, P = changed Parameters, D = changed Data)
F     [Cross Correlation Function] [] [2008-12-02 16:29:33] [b53e8d20687f12ca59f39c9b7c3a629a]
F         [Cross Correlation Function] [Q9] [2008-12-02 18:22:47] [d41d8cd98f00b204e9800998ecf8427e] [Current]
Feedback Forum
2008-12-03 19:36:44 [407693b66d7f2e0b350979005057872d] [reply
Dit antwoord is volledig juist. Grafiek: typisch fenomeen
onderzoeken of ere en verband is tussen Yt en Xt , maar de correlatie kan vertekend zijn door Zt , een variabele die invloed heeft op Yt en Xt.
2008-12-04 19:12:14 [c97d2ae59c98cf77a04815c1edffab5a] [reply
Q8 was niet opgelost, dus eigenlijk kan Q9 ook niet gemaakt worden.
bij Q8 moest d, D en lambda bepaald worden waarmee je x(t) EN y(t) gaat differentiëren/transformeren. d en D kon je nagaan door:
*Autocorrelatie
Lange termijn trend?
Seizoenaliteit?
Spreiding autocorrelatie?
*Variantie reductie matrix
Kleinste variantie
D?
d?
*Spectrum analysis
-Raw periodogram: LT trend (langzaam stijgende/dalende lijn),seizoenaliteit(terugkerende pieken in jaren 4,6,12,..)
-Cumulative periodogram: LT trend (steil stijgende/dalende grafiek bij lage freq),Seizoenaliteit (trappen)

het klop inderdaad dat de cross correlatie in Q7 een nonsenscorrelatie on zijn, doordat daar de invloed van een derde variabele z op x en y nog niet was weggewerkt.
het is dus ook logisch dat het aantal significante correlaties bij Q9 lager ligt dan bij Q7.
2008-12-04 19:12:51 [c97d2ae59c98cf77a04815c1edffab5a] [reply
ik was vergeten te zeggen dat je lambda kan nagaan dmv de standard deviation-mean plot.

Post a new message
Dataseries X:
7.5
7.2
6.9
6.7
6.4
6.3
6.8
7.3
7.1
7.1
6.8
6.5
6.3
6.1
6.1
6.3
6.3
6
6.2
6.4
6.8
7.5
7.5
7.6
7.6
7.4
7.3
7.1
6.9
6.8
7.5
7.6
7.8
8.0
8.1
8.2
8.3
8.2
8.0
7.9
7.6
7.6
8.2
8.3
8.4
8.4
8.4
8.6
8.9
8.8
8.3
7.5
7.2
7.5
8.8
9.3
9.3
8.7
8.2
8.3
8.5
8.6
8.6
8.2
8.1
8.0
8.6
8.7
8.8
8.5
8.4
8.5
8.7
8.7
8.6
8.5
8.3
8.1
8.2
8.1
8.1
7.9
7.9
7.9
8.0
8.0
7.9
8.0
7.7
7.2
7.5
7.3
7.0
7.0
7.0
7.2
7.3
7.1
6.8
6.6
6.2
6.2
6.8
6.9
6.8
Dataseries Y:
15.9
15.5
15.3
14.5
14.4
14.7
19.1
21.6
20.2
17.9
15.7
14.5
14.1
13.9
14.2
15.3
15.4
15.2
16.5
18.2
18.6
21.0
19.2
18.7
18.4
17.8
17.2
16.2
15.5
15.3
18.3
19.2
19.0
18.7
18.1
18.5
21.1
21.0
20.4
19.5
18.6
18.8
23.7
24.8
25.0
23.6
22.3
21.8
20.8
19.7
18.3
17.4
17.0
18.1
23.9
25.6
25.3
23.6
21.9
21.4
20.6
20.5
20.2
20.6
19.7
19.3
22.8
23.5
23.8
22.6
22.0
21.7
20.7
20.2
19.1
19.5
18.7
18.6
22.2
23.2
23.5
21.3
20.0
18.7
18.9
18.3
18.4
19.9
19.2
18.5
20.9
20.5
19.4
18.1
17.0
17.0
17.3
16.7
15.5
15.3
13.7
14.1
17.3
18.1
18.1


Summary of computational transaction
Raw Inputview raw input (R code)
Raw Outputview raw output of R engine
Computing time1 seconds
R Server'Gwilym Jenkins' @ 72.249.127.135

\begin{tabular}{lllllllll}
\hline
Summary of computational transaction \tabularnewline
Raw Input & view raw input (R code)  \tabularnewline
Raw Output & view raw output of R engine  \tabularnewline
Computing time & 1 seconds \tabularnewline
R Server & 'Gwilym Jenkins' @ 72.249.127.135 \tabularnewline
\hline
\end{tabular}
%Source: https://freestatistics.org/blog/index.php?pk=28214&T=0

[TABLE]
[ROW][C]Summary of computational transaction[/C][/ROW]
[ROW][C]Raw Input[/C][C]view raw input (R code) [/C][/ROW]
[ROW][C]Raw Output[/C][C]view raw output of R engine [/C][/ROW]
[ROW][C]Computing time[/C][C]1 seconds[/C][/ROW]
[ROW][C]R Server[/C][C]'Gwilym Jenkins' @ 72.249.127.135[/C][/ROW]
[/TABLE]
Source: https://freestatistics.org/blog/index.php?pk=28214&T=0

Globally Unique Identifier (entire table): ba.freestatistics.org/blog/index.php?pk=28214&T=0

As an alternative you can also use a QR Code:  

The GUIDs for individual cells are displayed in the table below:

Summary of computational transaction
Raw Inputview raw input (R code)
Raw Outputview raw output of R engine
Computing time1 seconds
R Server'Gwilym Jenkins' @ 72.249.127.135


Cross Correlation Function
ParameterValue
Box-Cox transformation parameter (lambda) of X series1
Degree of non-seasonal differencing (d) of X series1
Degree of seasonal differencing (D) of X series0
Seasonal Period (s)1
Box-Cox transformation parameter (lambda) of Y series1
Degree of non-seasonal differencing (d) of Y series1
Degree of seasonal differencing (D) of Y series0
krho(Y[t],X[t+k])
-17-0.120489580146780
-16-0.202474750912598
-15-0.197006936183794
-14-0.09638749276413
-130.0404911573110885
-120.439511016007128
-110.103899834303140
-10-0.0336780408811036
-90.0127200909114158
-80.00209968852846959
-70.140471167703204
-60.146851848473226
-5-0.115889173371662
-4-0.359759411662646
-3-0.389390877472803
-2-0.234315624727332
-10.170616925942105
00.746762108846864
10.285219301245167
2-0.0220575203084153
3-0.113634146223441
4-0.164998604276901
50.0492390810751717
60.146835098637607
7-0.0117115575398368
8-0.204637251324637
9-0.237993542358556
10-0.216571589731008
110.0554216225637522
120.442896576531556
130.106330573669246
14-0.0318775946082062
15-0.0700222448996172
16-0.037689868095947
170.166742882230836

\begin{tabular}{lllllllll}
\hline
Cross Correlation Function \tabularnewline
Parameter & Value \tabularnewline
Box-Cox transformation parameter (lambda) of X series & 1 \tabularnewline
Degree of non-seasonal differencing (d) of X series & 1 \tabularnewline
Degree of seasonal differencing (D) of X series & 0 \tabularnewline
Seasonal Period (s) & 1 \tabularnewline
Box-Cox transformation parameter (lambda) of Y series & 1 \tabularnewline
Degree of non-seasonal differencing (d) of Y series & 1 \tabularnewline
Degree of seasonal differencing (D) of Y series & 0 \tabularnewline
k & rho(Y[t],X[t+k]) \tabularnewline
-17 & -0.120489580146780 \tabularnewline
-16 & -0.202474750912598 \tabularnewline
-15 & -0.197006936183794 \tabularnewline
-14 & -0.09638749276413 \tabularnewline
-13 & 0.0404911573110885 \tabularnewline
-12 & 0.439511016007128 \tabularnewline
-11 & 0.103899834303140 \tabularnewline
-10 & -0.0336780408811036 \tabularnewline
-9 & 0.0127200909114158 \tabularnewline
-8 & 0.00209968852846959 \tabularnewline
-7 & 0.140471167703204 \tabularnewline
-6 & 0.146851848473226 \tabularnewline
-5 & -0.115889173371662 \tabularnewline
-4 & -0.359759411662646 \tabularnewline
-3 & -0.389390877472803 \tabularnewline
-2 & -0.234315624727332 \tabularnewline
-1 & 0.170616925942105 \tabularnewline
0 & 0.746762108846864 \tabularnewline
1 & 0.285219301245167 \tabularnewline
2 & -0.0220575203084153 \tabularnewline
3 & -0.113634146223441 \tabularnewline
4 & -0.164998604276901 \tabularnewline
5 & 0.0492390810751717 \tabularnewline
6 & 0.146835098637607 \tabularnewline
7 & -0.0117115575398368 \tabularnewline
8 & -0.204637251324637 \tabularnewline
9 & -0.237993542358556 \tabularnewline
10 & -0.216571589731008 \tabularnewline
11 & 0.0554216225637522 \tabularnewline
12 & 0.442896576531556 \tabularnewline
13 & 0.106330573669246 \tabularnewline
14 & -0.0318775946082062 \tabularnewline
15 & -0.0700222448996172 \tabularnewline
16 & -0.037689868095947 \tabularnewline
17 & 0.166742882230836 \tabularnewline
\hline
\end{tabular}
%Source: https://freestatistics.org/blog/index.php?pk=28214&T=1

[TABLE]
[ROW][C]Cross Correlation Function[/C][/ROW]
[ROW][C]Parameter[/C][C]Value[/C][/ROW]
[ROW][C]Box-Cox transformation parameter (lambda) of X series[/C][C]1[/C][/ROW]
[ROW][C]Degree of non-seasonal differencing (d) of X series[/C][C]1[/C][/ROW]
[ROW][C]Degree of seasonal differencing (D) of X series[/C][C]0[/C][/ROW]
[ROW][C]Seasonal Period (s)[/C][C]1[/C][/ROW]
[ROW][C]Box-Cox transformation parameter (lambda) of Y series[/C][C]1[/C][/ROW]
[ROW][C]Degree of non-seasonal differencing (d) of Y series[/C][C]1[/C][/ROW]
[ROW][C]Degree of seasonal differencing (D) of Y series[/C][C]0[/C][/ROW]
[ROW][C]k[/C][C]rho(Y[t],X[t+k])[/C][/ROW]
[ROW][C]-17[/C][C]-0.120489580146780[/C][/ROW]
[ROW][C]-16[/C][C]-0.202474750912598[/C][/ROW]
[ROW][C]-15[/C][C]-0.197006936183794[/C][/ROW]
[ROW][C]-14[/C][C]-0.09638749276413[/C][/ROW]
[ROW][C]-13[/C][C]0.0404911573110885[/C][/ROW]
[ROW][C]-12[/C][C]0.439511016007128[/C][/ROW]
[ROW][C]-11[/C][C]0.103899834303140[/C][/ROW]
[ROW][C]-10[/C][C]-0.0336780408811036[/C][/ROW]
[ROW][C]-9[/C][C]0.0127200909114158[/C][/ROW]
[ROW][C]-8[/C][C]0.00209968852846959[/C][/ROW]
[ROW][C]-7[/C][C]0.140471167703204[/C][/ROW]
[ROW][C]-6[/C][C]0.146851848473226[/C][/ROW]
[ROW][C]-5[/C][C]-0.115889173371662[/C][/ROW]
[ROW][C]-4[/C][C]-0.359759411662646[/C][/ROW]
[ROW][C]-3[/C][C]-0.389390877472803[/C][/ROW]
[ROW][C]-2[/C][C]-0.234315624727332[/C][/ROW]
[ROW][C]-1[/C][C]0.170616925942105[/C][/ROW]
[ROW][C]0[/C][C]0.746762108846864[/C][/ROW]
[ROW][C]1[/C][C]0.285219301245167[/C][/ROW]
[ROW][C]2[/C][C]-0.0220575203084153[/C][/ROW]
[ROW][C]3[/C][C]-0.113634146223441[/C][/ROW]
[ROW][C]4[/C][C]-0.164998604276901[/C][/ROW]
[ROW][C]5[/C][C]0.0492390810751717[/C][/ROW]
[ROW][C]6[/C][C]0.146835098637607[/C][/ROW]
[ROW][C]7[/C][C]-0.0117115575398368[/C][/ROW]
[ROW][C]8[/C][C]-0.204637251324637[/C][/ROW]
[ROW][C]9[/C][C]-0.237993542358556[/C][/ROW]
[ROW][C]10[/C][C]-0.216571589731008[/C][/ROW]
[ROW][C]11[/C][C]0.0554216225637522[/C][/ROW]
[ROW][C]12[/C][C]0.442896576531556[/C][/ROW]
[ROW][C]13[/C][C]0.106330573669246[/C][/ROW]
[ROW][C]14[/C][C]-0.0318775946082062[/C][/ROW]
[ROW][C]15[/C][C]-0.0700222448996172[/C][/ROW]
[ROW][C]16[/C][C]-0.037689868095947[/C][/ROW]
[ROW][C]17[/C][C]0.166742882230836[/C][/ROW]
[/TABLE]
Source: https://freestatistics.org/blog/index.php?pk=28214&T=1

Globally Unique Identifier (entire table): ba.freestatistics.org/blog/index.php?pk=28214&T=1

As an alternative you can also use a QR Code:  

The GUIDs for individual cells are displayed in the table below:

Cross Correlation Function
ParameterValue
Box-Cox transformation parameter (lambda) of X series1
Degree of non-seasonal differencing (d) of X series1
Degree of seasonal differencing (D) of X series0
Seasonal Period (s)1
Box-Cox transformation parameter (lambda) of Y series1
Degree of non-seasonal differencing (d) of Y series1
Degree of seasonal differencing (D) of Y series0
krho(Y[t],X[t+k])
-17-0.120489580146780
-16-0.202474750912598
-15-0.197006936183794
-14-0.09638749276413
-130.0404911573110885
-120.439511016007128
-110.103899834303140
-10-0.0336780408811036
-90.0127200909114158
-80.00209968852846959
-70.140471167703204
-60.146851848473226
-5-0.115889173371662
-4-0.359759411662646
-3-0.389390877472803
-2-0.234315624727332
-10.170616925942105
00.746762108846864
10.285219301245167
2-0.0220575203084153
3-0.113634146223441
4-0.164998604276901
50.0492390810751717
60.146835098637607
7-0.0117115575398368
8-0.204637251324637
9-0.237993542358556
10-0.216571589731008
110.0554216225637522
120.442896576531556
130.106330573669246
14-0.0318775946082062
15-0.0700222448996172
16-0.037689868095947
170.166742882230836


Parameters (Session):
par1 = 1 ; par2 = 1 ; par3 = 0 ; par4 = 1 ; par5 = 1 ; par6 = 1 ; par7 = 0 ;
Parameters (R input):
par1 = 1 ; par2 = 1 ; par3 = 0 ; par4 = 1 ; par5 = 1 ; par6 = 1 ; par7 = 0 ;
R code (references can be found in the software module):
par1 <- as.numeric(par1)
par2 <- as.numeric(par2)
par3 <- as.numeric(par3)
par4 <- as.numeric(par4)
par5 <- as.numeric(par5)
par6 <- as.numeric(par6)
par7 <- as.numeric(par7)
if (par1 == 0) {
x <- log(x)
} else {
x <- (x ^ par1 - 1) / par1
}
if (par5 == 0) {
y <- log(y)
} else {
y <- (y ^ par5 - 1) / par5
}
if (par2 > 0) x <- diff(x,lag=1,difference=par2)
if (par6 > 0) y <- diff(y,lag=1,difference=par6)
if (par3 > 0) x <- diff(x,lag=par4,difference=par3)
if (par7 > 0) y <- diff(y,lag=par4,difference=par7)
x
y
bitmap(file='test1.png')
(r <- ccf(x,y,main='Cross Correlation Function',ylab='CCF',xlab='Lag (k)'))
dev.off()
load(file='createtable')
a<-table.start()
a<-table.row.start(a)
a<-table.element(a,'Cross Correlation Function',2,TRUE)
a<-table.row.end(a)
a<-table.row.start(a)
a<-table.element(a,'Parameter',header=TRUE)
a<-table.element(a,'Value',header=TRUE)
a<-table.row.end(a)
a<-table.row.start(a)
a<-table.element(a,'Box-Cox transformation parameter (lambda) of X series',header=TRUE)
a<-table.element(a,par1)
a<-table.row.end(a)
a<-table.row.start(a)
a<-table.element(a,'Degree of non-seasonal differencing (d) of X series',header=TRUE)
a<-table.element(a,par2)
a<-table.row.end(a)
a<-table.row.start(a)
a<-table.element(a,'Degree of seasonal differencing (D) of X series',header=TRUE)
a<-table.element(a,par3)
a<-table.row.end(a)
a<-table.row.start(a)
a<-table.element(a,'Seasonal Period (s)',header=TRUE)
a<-table.element(a,par4)
a<-table.row.end(a)
a<-table.row.start(a)
a<-table.element(a,'Box-Cox transformation parameter (lambda) of Y series',header=TRUE)
a<-table.element(a,par5)
a<-table.row.end(a)
a<-table.row.start(a)
a<-table.element(a,'Degree of non-seasonal differencing (d) of Y series',header=TRUE)
a<-table.element(a,par6)
a<-table.row.end(a)
a<-table.row.start(a)
a<-table.element(a,'Degree of seasonal differencing (D) of Y series',header=TRUE)
a<-table.element(a,par7)
a<-table.row.end(a)
a<-table.row.start(a)
a<-table.element(a,'k',header=TRUE)
a<-table.element(a,'rho(Y[t],X[t+k])',header=TRUE)
a<-table.row.end(a)
mylength <- length(r$acf)
myhalf <- floor((mylength-1)/2)
for (i in 1:mylength) {
a<-table.row.start(a)
a<-table.element(a,i-myhalf-1,header=TRUE)
a<-table.element(a,r$acf[i])
a<-table.row.end(a)
}
a<-table.end(a)
table.save(a,file='mytable.tab')