Free Statistics

of Irreproducible Research!

Author's title

Author*The author of this computation has been verified*
R Software Modulerwasp_cross.wasp
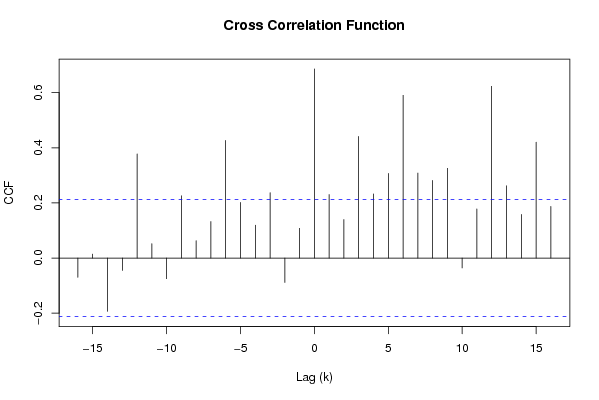
Title produced by softwareCross Correlation Function
Date of computationTue, 02 Dec 2008 13:11:03 -0700
Cite this page as followsStatistical Computations at FreeStatistics.org, Office for Research Development and Education, URL https://freestatistics.org/blog/index.php?v=date/2008/Dec/02/t1228248747lq80cx56o1fgzmn.htm/, Retrieved Wed, 22 May 2024 20:35:39 +0000
Statistical Computations at FreeStatistics.org, Office for Research Development and Education, URL https://freestatistics.org/blog/index.php?pk=28338, Retrieved Wed, 22 May 2024 20:35:39 +0000
QR Codes:

Original text written by user:
IsPrivate?No (this computation is public)
User-defined keywords
Estimated Impact157
Family? (F = Feedback message, R = changed R code, M = changed R Module, P = changed Parameters, D = changed Data)
F     [Cross Correlation Function] [non -stationary t...] [2008-12-02 16:46:47] [b1bd16d1f47bfe13feacf1c27a0abba5]
F    D    [Cross Correlation Function] [NonStationaryTime...] [2008-12-02 20:11:03] [ff1f39dba9ec26bf89aa666d9dcb6cc1] [Current]
Feedback Forum
2008-12-05 15:59:51 [Angelique Van de Vijver] [reply
Goede berekening van de kruiscorrelatie, maar wel foute uitleg gegeven.
Foute interpretatie van de student !: de oppervlakte tussen de 2 stippellijnen vormt het betrouwbaarheidsinterval en NIET wat er buiten ligt. De waarden die zich boven deze stippellijnen bevinden zijn significant verschillend van o en hier is het verschil dus niet aan toeval te wijten. De student heeft dit dus omgedraaid in haar interpretatie.

De kruiscorrelatiefunctie heeft niks te maken met een trend. Het geef het verband weer tussen 2 verschillende tijdreeksen.
De student heeft ook niks vermeld over de k-waarde. Als deze k-waarde negatief is dan kan je het verleden gebruiken van X om Y te voorspellen. Als deze k-waarde positief is dan kan je Y voorspellen m.b.v. de toekomst van X.
Een leading indicator is een voorspellende waarde, iets dat vooroploopt. Het is een indicator die je op voorhand zegt wat het verloop van een andere variabele is.
Hier zie je dat bij de k-waarden -12,-6, 0, 6 en 12 de hoogste correlatiewaarden zijn. Dit zie je op de grafiek en ook in de tabel. Hier is de kruiscorrelatie dus het hoogst.
2008-12-08 19:43:55 [Stef Vermeiren] [reply
De crosscorrelation werd inderdaad goed berekend, maar de conclusie is echter foutief. De lijnen die tussen de blauwe horizontale lijnen liggen, vallen in het betrouwbaarheidsinterval! Tegenovergesteld van wat de student zegt dus.

De leading indicator is een indicator die op voorhand informatie geeft over een andere variabele. In welke mate kan y[t] verklaard worden door naar het verleden van x[t] te kijken.

Post a new message
Dataseries X:
78.4
114.6
113.3
117.0
99.6
99.4
101.9
115.2
108.5
113.8
121.0
92.2
90.2
101.5
126.6
93.9
89.8
93.4
101.5
110.4
105.9
108.4
113.9
86.1
69.4
101.2
100.5
98.0
106.6
90.1
96.9
125.9
112.0
100.0
123.9
79.8
83.4
113.6
112.9
104.0
109.9
99.0
106.3
128.9
111.1
102.9
130.0
87.0
87.5
117.6
103.4
110.8
112.6
102.5
112.4
135.6
105.1
127.7
137.0
91.0
90.5
122.4
123.3
124.3
120.0
118.1
119.0
142.7
123.6
129.6
151.6
110.4
99.2
130.5
136.2
129.7
128.0
121.6
135.8
143.8
147.5
136.2
156.6
123.3
100.4
Dataseries Y:
97.8
107.4
117.5
105.6
97.4
99.5
98.0
104.3
100.6
101.1
103.9
96.9
95.5
108.4
117.0
103.8
100.8
110.6
104.0
112.6
107.3
98.9
109.8
104.9
102.2
123.9
124.9
112.7
121.9
100.6
104.3
120.4
107.5
102.9
125.6
107.5
108.8
128.4
121.1
119.5
128.7
108.7
105.5
119.8
111.3
110.6
120.1
97.5
107.7
127.3
117.2
119.8
116.2
111.0
112.4
130.6
109.1
118.8
123.9
101.6
112.8
128.0
129.6
125.8
119.5
115.7
113.6
129.7
112.0
116.8
127.0
112.1
114.2
121.1
131.6
125.0
120.4
117.7
117.5
120.6
127.5
112.3
124.5
115.2
105.4


Summary of computational transaction
Raw Inputview raw input (R code)
Raw Outputview raw output of R engine
Computing time0 seconds
R Server'Gwilym Jenkins' @ 72.249.127.135

\begin{tabular}{lllllllll}
\hline
Summary of computational transaction \tabularnewline
Raw Input & view raw input (R code)  \tabularnewline
Raw Output & view raw output of R engine  \tabularnewline
Computing time & 0 seconds \tabularnewline
R Server & 'Gwilym Jenkins' @ 72.249.127.135 \tabularnewline
\hline
\end{tabular}
%Source: https://freestatistics.org/blog/index.php?pk=28338&T=0

[TABLE]
[ROW][C]Summary of computational transaction[/C][/ROW]
[ROW][C]Raw Input[/C][C]view raw input (R code) [/C][/ROW]
[ROW][C]Raw Output[/C][C]view raw output of R engine [/C][/ROW]
[ROW][C]Computing time[/C][C]0 seconds[/C][/ROW]
[ROW][C]R Server[/C][C]'Gwilym Jenkins' @ 72.249.127.135[/C][/ROW]
[/TABLE]
Source: https://freestatistics.org/blog/index.php?pk=28338&T=0

Globally Unique Identifier (entire table): ba.freestatistics.org/blog/index.php?pk=28338&T=0

As an alternative you can also use a QR Code:  

The GUIDs for individual cells are displayed in the table below:

Summary of computational transaction
Raw Inputview raw input (R code)
Raw Outputview raw output of R engine
Computing time0 seconds
R Server'Gwilym Jenkins' @ 72.249.127.135


Cross Correlation Function
ParameterValue
Box-Cox transformation parameter (lambda) of X series1
Degree of non-seasonal differencing (d) of X series0
Degree of seasonal differencing (D) of X series0
Seasonal Period (s)12
Box-Cox transformation parameter (lambda) of Y series1
Degree of non-seasonal differencing (d) of Y series0
Degree of seasonal differencing (D) of Y series0
krho(Y[t],X[t+k])
-16-0.0700213890544833
-150.0142990905644138
-14-0.193365488956066
-13-0.0450890745987972
-120.377965898280041
-110.0519906803063849
-10-0.0746958549880802
-90.225762577193397
-80.0630934719706794
-70.132622602806340
-60.426786401686938
-50.201701426202626
-40.119284736444523
-30.237122659296598
-2-0.0886280683008975
-10.108125980015205
00.686100625132908
10.230290912212587
20.139624344725165
30.441454371940561
40.232682044125126
50.306827743228845
60.590262231124296
70.308599562256039
80.281539285337359
90.32576371189541
10-0.0360541777512949
110.178304899355525
120.623018971583643
130.262213896511307
140.158442969008772
150.420419585992301
160.187429749797794

\begin{tabular}{lllllllll}
\hline
Cross Correlation Function \tabularnewline
Parameter & Value \tabularnewline
Box-Cox transformation parameter (lambda) of X series & 1 \tabularnewline
Degree of non-seasonal differencing (d) of X series & 0 \tabularnewline
Degree of seasonal differencing (D) of X series & 0 \tabularnewline
Seasonal Period (s) & 12 \tabularnewline
Box-Cox transformation parameter (lambda) of Y series & 1 \tabularnewline
Degree of non-seasonal differencing (d) of Y series & 0 \tabularnewline
Degree of seasonal differencing (D) of Y series & 0 \tabularnewline
k & rho(Y[t],X[t+k]) \tabularnewline
-16 & -0.0700213890544833 \tabularnewline
-15 & 0.0142990905644138 \tabularnewline
-14 & -0.193365488956066 \tabularnewline
-13 & -0.0450890745987972 \tabularnewline
-12 & 0.377965898280041 \tabularnewline
-11 & 0.0519906803063849 \tabularnewline
-10 & -0.0746958549880802 \tabularnewline
-9 & 0.225762577193397 \tabularnewline
-8 & 0.0630934719706794 \tabularnewline
-7 & 0.132622602806340 \tabularnewline
-6 & 0.426786401686938 \tabularnewline
-5 & 0.201701426202626 \tabularnewline
-4 & 0.119284736444523 \tabularnewline
-3 & 0.237122659296598 \tabularnewline
-2 & -0.0886280683008975 \tabularnewline
-1 & 0.108125980015205 \tabularnewline
0 & 0.686100625132908 \tabularnewline
1 & 0.230290912212587 \tabularnewline
2 & 0.139624344725165 \tabularnewline
3 & 0.441454371940561 \tabularnewline
4 & 0.232682044125126 \tabularnewline
5 & 0.306827743228845 \tabularnewline
6 & 0.590262231124296 \tabularnewline
7 & 0.308599562256039 \tabularnewline
8 & 0.281539285337359 \tabularnewline
9 & 0.32576371189541 \tabularnewline
10 & -0.0360541777512949 \tabularnewline
11 & 0.178304899355525 \tabularnewline
12 & 0.623018971583643 \tabularnewline
13 & 0.262213896511307 \tabularnewline
14 & 0.158442969008772 \tabularnewline
15 & 0.420419585992301 \tabularnewline
16 & 0.187429749797794 \tabularnewline
\hline
\end{tabular}
%Source: https://freestatistics.org/blog/index.php?pk=28338&T=1

[TABLE]
[ROW][C]Cross Correlation Function[/C][/ROW]
[ROW][C]Parameter[/C][C]Value[/C][/ROW]
[ROW][C]Box-Cox transformation parameter (lambda) of X series[/C][C]1[/C][/ROW]
[ROW][C]Degree of non-seasonal differencing (d) of X series[/C][C]0[/C][/ROW]
[ROW][C]Degree of seasonal differencing (D) of X series[/C][C]0[/C][/ROW]
[ROW][C]Seasonal Period (s)[/C][C]12[/C][/ROW]
[ROW][C]Box-Cox transformation parameter (lambda) of Y series[/C][C]1[/C][/ROW]
[ROW][C]Degree of non-seasonal differencing (d) of Y series[/C][C]0[/C][/ROW]
[ROW][C]Degree of seasonal differencing (D) of Y series[/C][C]0[/C][/ROW]
[ROW][C]k[/C][C]rho(Y[t],X[t+k])[/C][/ROW]
[ROW][C]-16[/C][C]-0.0700213890544833[/C][/ROW]
[ROW][C]-15[/C][C]0.0142990905644138[/C][/ROW]
[ROW][C]-14[/C][C]-0.193365488956066[/C][/ROW]
[ROW][C]-13[/C][C]-0.0450890745987972[/C][/ROW]
[ROW][C]-12[/C][C]0.377965898280041[/C][/ROW]
[ROW][C]-11[/C][C]0.0519906803063849[/C][/ROW]
[ROW][C]-10[/C][C]-0.0746958549880802[/C][/ROW]
[ROW][C]-9[/C][C]0.225762577193397[/C][/ROW]
[ROW][C]-8[/C][C]0.0630934719706794[/C][/ROW]
[ROW][C]-7[/C][C]0.132622602806340[/C][/ROW]
[ROW][C]-6[/C][C]0.426786401686938[/C][/ROW]
[ROW][C]-5[/C][C]0.201701426202626[/C][/ROW]
[ROW][C]-4[/C][C]0.119284736444523[/C][/ROW]
[ROW][C]-3[/C][C]0.237122659296598[/C][/ROW]
[ROW][C]-2[/C][C]-0.0886280683008975[/C][/ROW]
[ROW][C]-1[/C][C]0.108125980015205[/C][/ROW]
[ROW][C]0[/C][C]0.686100625132908[/C][/ROW]
[ROW][C]1[/C][C]0.230290912212587[/C][/ROW]
[ROW][C]2[/C][C]0.139624344725165[/C][/ROW]
[ROW][C]3[/C][C]0.441454371940561[/C][/ROW]
[ROW][C]4[/C][C]0.232682044125126[/C][/ROW]
[ROW][C]5[/C][C]0.306827743228845[/C][/ROW]
[ROW][C]6[/C][C]0.590262231124296[/C][/ROW]
[ROW][C]7[/C][C]0.308599562256039[/C][/ROW]
[ROW][C]8[/C][C]0.281539285337359[/C][/ROW]
[ROW][C]9[/C][C]0.32576371189541[/C][/ROW]
[ROW][C]10[/C][C]-0.0360541777512949[/C][/ROW]
[ROW][C]11[/C][C]0.178304899355525[/C][/ROW]
[ROW][C]12[/C][C]0.623018971583643[/C][/ROW]
[ROW][C]13[/C][C]0.262213896511307[/C][/ROW]
[ROW][C]14[/C][C]0.158442969008772[/C][/ROW]
[ROW][C]15[/C][C]0.420419585992301[/C][/ROW]
[ROW][C]16[/C][C]0.187429749797794[/C][/ROW]
[/TABLE]
Source: https://freestatistics.org/blog/index.php?pk=28338&T=1

Globally Unique Identifier (entire table): ba.freestatistics.org/blog/index.php?pk=28338&T=1

As an alternative you can also use a QR Code:  

The GUIDs for individual cells are displayed in the table below:

Cross Correlation Function
ParameterValue
Box-Cox transformation parameter (lambda) of X series1
Degree of non-seasonal differencing (d) of X series0
Degree of seasonal differencing (D) of X series0
Seasonal Period (s)12
Box-Cox transformation parameter (lambda) of Y series1
Degree of non-seasonal differencing (d) of Y series0
Degree of seasonal differencing (D) of Y series0
krho(Y[t],X[t+k])
-16-0.0700213890544833
-150.0142990905644138
-14-0.193365488956066
-13-0.0450890745987972
-120.377965898280041
-110.0519906803063849
-10-0.0746958549880802
-90.225762577193397
-80.0630934719706794
-70.132622602806340
-60.426786401686938
-50.201701426202626
-40.119284736444523
-30.237122659296598
-2-0.0886280683008975
-10.108125980015205
00.686100625132908
10.230290912212587
20.139624344725165
30.441454371940561
40.232682044125126
50.306827743228845
60.590262231124296
70.308599562256039
80.281539285337359
90.32576371189541
10-0.0360541777512949
110.178304899355525
120.623018971583643
130.262213896511307
140.158442969008772
150.420419585992301
160.187429749797794


Parameters (Session):
par1 = 1 ; par2 = 0 ; par3 = 0 ; par4 = 12 ; par5 = 1 ; par6 = 0 ; par7 = 0 ;
Parameters (R input):
par1 = 1 ; par2 = 0 ; par3 = 0 ; par4 = 12 ; par5 = 1 ; par6 = 0 ; par7 = 0 ;
R code (references can be found in the software module):
par1 <- as.numeric(par1)
par2 <- as.numeric(par2)
par3 <- as.numeric(par3)
par4 <- as.numeric(par4)
par5 <- as.numeric(par5)
par6 <- as.numeric(par6)
par7 <- as.numeric(par7)
if (par1 == 0) {
x <- log(x)
} else {
x <- (x ^ par1 - 1) / par1
}
if (par5 == 0) {
y <- log(y)
} else {
y <- (y ^ par5 - 1) / par5
}
if (par2 > 0) x <- diff(x,lag=1,difference=par2)
if (par6 > 0) y <- diff(y,lag=1,difference=par6)
if (par3 > 0) x <- diff(x,lag=par4,difference=par3)
if (par7 > 0) y <- diff(y,lag=par4,difference=par7)
x
y
bitmap(file='test1.png')
(r <- ccf(x,y,main='Cross Correlation Function',ylab='CCF',xlab='Lag (k)'))
dev.off()
load(file='createtable')
a<-table.start()
a<-table.row.start(a)
a<-table.element(a,'Cross Correlation Function',2,TRUE)
a<-table.row.end(a)
a<-table.row.start(a)
a<-table.element(a,'Parameter',header=TRUE)
a<-table.element(a,'Value',header=TRUE)
a<-table.row.end(a)
a<-table.row.start(a)
a<-table.element(a,'Box-Cox transformation parameter (lambda) of X series',header=TRUE)
a<-table.element(a,par1)
a<-table.row.end(a)
a<-table.row.start(a)
a<-table.element(a,'Degree of non-seasonal differencing (d) of X series',header=TRUE)
a<-table.element(a,par2)
a<-table.row.end(a)
a<-table.row.start(a)
a<-table.element(a,'Degree of seasonal differencing (D) of X series',header=TRUE)
a<-table.element(a,par3)
a<-table.row.end(a)
a<-table.row.start(a)
a<-table.element(a,'Seasonal Period (s)',header=TRUE)
a<-table.element(a,par4)
a<-table.row.end(a)
a<-table.row.start(a)
a<-table.element(a,'Box-Cox transformation parameter (lambda) of Y series',header=TRUE)
a<-table.element(a,par5)
a<-table.row.end(a)
a<-table.row.start(a)
a<-table.element(a,'Degree of non-seasonal differencing (d) of Y series',header=TRUE)
a<-table.element(a,par6)
a<-table.row.end(a)
a<-table.row.start(a)
a<-table.element(a,'Degree of seasonal differencing (D) of Y series',header=TRUE)
a<-table.element(a,par7)
a<-table.row.end(a)
a<-table.row.start(a)
a<-table.element(a,'k',header=TRUE)
a<-table.element(a,'rho(Y[t],X[t+k])',header=TRUE)
a<-table.row.end(a)
mylength <- length(r$acf)
myhalf <- floor((mylength-1)/2)
for (i in 1:mylength) {
a<-table.row.start(a)
a<-table.element(a,i-myhalf-1,header=TRUE)
a<-table.element(a,r$acf[i])
a<-table.row.end(a)
}
a<-table.end(a)
table.save(a,file='mytable.tab')