Free Statistics

of Irreproducible Research!

Author's title

Author*The author of this computation has been verified*
R Software Modulerwasp_autocorrelation.wasp
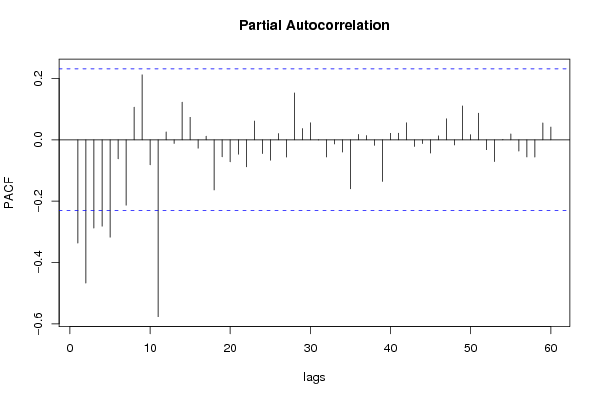
Title produced by software(Partial) Autocorrelation Function
Date of computationThu, 04 Dec 2008 10:48:53 -0700
Cite this page as followsStatistical Computations at FreeStatistics.org, Office for Research Development and Education, URL https://freestatistics.org/blog/index.php?v=date/2008/Dec/04/t1228413036y8xubb3u1a8wft3.htm/, Retrieved Sat, 18 May 2024 08:55:47 +0000
Statistical Computations at FreeStatistics.org, Office for Research Development and Education, URL https://freestatistics.org/blog/index.php?pk=28977, Retrieved Sat, 18 May 2024 08:55:47 +0000
QR Codes:

Original text written by user:
IsPrivate?No (this computation is public)
User-defined keywords
Estimated Impact184
Family? (F = Feedback message, R = changed R code, M = changed R Module, P = changed Parameters, D = changed Data)
-     [(Partial) Autocorrelation Function] [Uitvoer EU - (Par...] [2008-12-04 17:13:31] [9e54d1454d464f1bf9ee4a54d5d56945]
-   PD    [(Partial) Autocorrelation Function] [Uitvoer EU - Part...] [2008-12-04 17:48:53] [8da7502cfecb272886bc60b3f290b8b8] [Current]
-   P       [(Partial) Autocorrelation Function] [Uitvoer EU - (Par...] [2008-12-04 17:52:47] [9e54d1454d464f1bf9ee4a54d5d56945]
Feedback Forum

Post a new message
Dataseries X:
11178.4
9516.4
12102.8
12989.0
11610.2
10205.5
11356.2
11307.1
12648.6
11947.2
11714.1
12192.5
11268.8
9097.4
12639.8
13040.1
11687.3
11191.7
11391.9
11793.1
13933.2
12778.1
11810.3
13698.4
11956.6
10723.8
13938.9
13979.8
13807.4
12973.9
12509.8
12934.1
14908.3
13772.1
13012.6
14049.9
11816.5
11593.2
14466.2
13615.9
14733.9
13880.7
13527.5
13584.0
16170.2
13260.6
14741.9
15486.5
13154.5
12621.2
15031.6
15452.4
15428
13105.9
14716.8
14180.0
16202.2
14392.4
15140.6
15960.1
14351.3
13230.2
15202.1
17157.3
16159.1
13405.7
17224.7
17338.4
17370.6
18817.8
16593.2
17979.5
17015.2


Summary of computational transaction
Raw Inputview raw input (R code)
Raw Outputview raw output of R engine
Computing time3 seconds
R Server'Herman Ole Andreas Wold' @ 193.190.124.10:1001

\begin{tabular}{lllllllll}
\hline
Summary of computational transaction \tabularnewline
Raw Input & view raw input (R code)  \tabularnewline
Raw Output & view raw output of R engine  \tabularnewline
Computing time & 3 seconds \tabularnewline
R Server & 'Herman Ole Andreas Wold' @ 193.190.124.10:1001 \tabularnewline
\hline
\end{tabular}
%Source: https://freestatistics.org/blog/index.php?pk=28977&T=0

[TABLE]
[ROW][C]Summary of computational transaction[/C][/ROW]
[ROW][C]Raw Input[/C][C]view raw input (R code) [/C][/ROW]
[ROW][C]Raw Output[/C][C]view raw output of R engine [/C][/ROW]
[ROW][C]Computing time[/C][C]3 seconds[/C][/ROW]
[ROW][C]R Server[/C][C]'Herman Ole Andreas Wold' @ 193.190.124.10:1001[/C][/ROW]
[/TABLE]
Source: https://freestatistics.org/blog/index.php?pk=28977&T=0

Globally Unique Identifier (entire table): ba.freestatistics.org/blog/index.php?pk=28977&T=0

As an alternative you can also use a QR Code:  

The GUIDs for individual cells are displayed in the table below:

Summary of computational transaction
Raw Inputview raw input (R code)
Raw Outputview raw output of R engine
Computing time3 seconds
R Server'Herman Ole Andreas Wold' @ 193.190.124.10:1001


Autocorrelation Function
Time lag kACF(k)T-STATP-value
1-0.336945-2.85910.002777
2-0.300881-2.55310.006399
30.106870.90680.183763
40.0342160.29030.386197
5-0.058641-0.49760.310146
60.1659241.40790.081731
7-0.146385-1.24210.109112
80.111270.94420.174124
90.0373460.31690.376122
10-0.278482-2.3630.010416
11-0.142264-1.20710.115663
120.6356525.39370
13-0.209025-1.77360.040176
14-0.19088-1.61970.054837
150.0355020.30120.38205
16-0.019301-0.16380.435185
170.0475190.40320.343993
180.0704950.59820.275803
19-0.093282-0.79150.215619
200.11740.99620.161252
21-0.022053-0.18710.426045
22-0.235399-1.99740.024779
230.0246270.2090.417534
240.3281672.78460.003422
25-0.105629-0.89630.186541
26-0.069654-0.5910.278174
27-0.062067-0.52670.300026
280.028990.2460.403195
290.0402870.34180.366732
30-0.001797-0.01520.493938
31-0.00838-0.07110.471757
320.0828910.70340.242052
33-0.056727-0.48130.315867
34-0.160078-1.35830.089303
350.0056940.04830.480801
360.2641712.24160.014036
37-0.075462-0.64030.261999
38-0.068057-0.57750.282707
39-0.091837-0.77930.219189
400.1349681.14520.127951
41-0.028429-0.24120.405032
42-0.030168-0.2560.399348
430.0168930.14330.443212
440.0820580.69630.244245
45-0.062441-0.52980.29893
46-0.080394-0.68220.24866
47-0.045811-0.38870.349317
480.2055561.74420.042696
490.0034290.02910.488434
50-0.125654-1.06620.144946
51-0.055985-0.4750.318095
520.1386881.17680.121574
53-0.056931-0.48310.315253
54-0.001726-0.01460.494179
550.0039230.03330.486768
560.0122990.10440.458587
570.0106120.090.464252
58-0.066165-0.56140.288125
59-0.019135-0.16240.435735
600.1079830.91630.181293

\begin{tabular}{lllllllll}
\hline
Autocorrelation Function \tabularnewline
Time lag k & ACF(k) & T-STAT & P-value \tabularnewline
1 & -0.336945 & -2.8591 & 0.002777 \tabularnewline
2 & -0.300881 & -2.5531 & 0.006399 \tabularnewline
3 & 0.10687 & 0.9068 & 0.183763 \tabularnewline
4 & 0.034216 & 0.2903 & 0.386197 \tabularnewline
5 & -0.058641 & -0.4976 & 0.310146 \tabularnewline
6 & 0.165924 & 1.4079 & 0.081731 \tabularnewline
7 & -0.146385 & -1.2421 & 0.109112 \tabularnewline
8 & 0.11127 & 0.9442 & 0.174124 \tabularnewline
9 & 0.037346 & 0.3169 & 0.376122 \tabularnewline
10 & -0.278482 & -2.363 & 0.010416 \tabularnewline
11 & -0.142264 & -1.2071 & 0.115663 \tabularnewline
12 & 0.635652 & 5.3937 & 0 \tabularnewline
13 & -0.209025 & -1.7736 & 0.040176 \tabularnewline
14 & -0.19088 & -1.6197 & 0.054837 \tabularnewline
15 & 0.035502 & 0.3012 & 0.38205 \tabularnewline
16 & -0.019301 & -0.1638 & 0.435185 \tabularnewline
17 & 0.047519 & 0.4032 & 0.343993 \tabularnewline
18 & 0.070495 & 0.5982 & 0.275803 \tabularnewline
19 & -0.093282 & -0.7915 & 0.215619 \tabularnewline
20 & 0.1174 & 0.9962 & 0.161252 \tabularnewline
21 & -0.022053 & -0.1871 & 0.426045 \tabularnewline
22 & -0.235399 & -1.9974 & 0.024779 \tabularnewline
23 & 0.024627 & 0.209 & 0.417534 \tabularnewline
24 & 0.328167 & 2.7846 & 0.003422 \tabularnewline
25 & -0.105629 & -0.8963 & 0.186541 \tabularnewline
26 & -0.069654 & -0.591 & 0.278174 \tabularnewline
27 & -0.062067 & -0.5267 & 0.300026 \tabularnewline
28 & 0.02899 & 0.246 & 0.403195 \tabularnewline
29 & 0.040287 & 0.3418 & 0.366732 \tabularnewline
30 & -0.001797 & -0.0152 & 0.493938 \tabularnewline
31 & -0.00838 & -0.0711 & 0.471757 \tabularnewline
32 & 0.082891 & 0.7034 & 0.242052 \tabularnewline
33 & -0.056727 & -0.4813 & 0.315867 \tabularnewline
34 & -0.160078 & -1.3583 & 0.089303 \tabularnewline
35 & 0.005694 & 0.0483 & 0.480801 \tabularnewline
36 & 0.264171 & 2.2416 & 0.014036 \tabularnewline
37 & -0.075462 & -0.6403 & 0.261999 \tabularnewline
38 & -0.068057 & -0.5775 & 0.282707 \tabularnewline
39 & -0.091837 & -0.7793 & 0.219189 \tabularnewline
40 & 0.134968 & 1.1452 & 0.127951 \tabularnewline
41 & -0.028429 & -0.2412 & 0.405032 \tabularnewline
42 & -0.030168 & -0.256 & 0.399348 \tabularnewline
43 & 0.016893 & 0.1433 & 0.443212 \tabularnewline
44 & 0.082058 & 0.6963 & 0.244245 \tabularnewline
45 & -0.062441 & -0.5298 & 0.29893 \tabularnewline
46 & -0.080394 & -0.6822 & 0.24866 \tabularnewline
47 & -0.045811 & -0.3887 & 0.349317 \tabularnewline
48 & 0.205556 & 1.7442 & 0.042696 \tabularnewline
49 & 0.003429 & 0.0291 & 0.488434 \tabularnewline
50 & -0.125654 & -1.0662 & 0.144946 \tabularnewline
51 & -0.055985 & -0.475 & 0.318095 \tabularnewline
52 & 0.138688 & 1.1768 & 0.121574 \tabularnewline
53 & -0.056931 & -0.4831 & 0.315253 \tabularnewline
54 & -0.001726 & -0.0146 & 0.494179 \tabularnewline
55 & 0.003923 & 0.0333 & 0.486768 \tabularnewline
56 & 0.012299 & 0.1044 & 0.458587 \tabularnewline
57 & 0.010612 & 0.09 & 0.464252 \tabularnewline
58 & -0.066165 & -0.5614 & 0.288125 \tabularnewline
59 & -0.019135 & -0.1624 & 0.435735 \tabularnewline
60 & 0.107983 & 0.9163 & 0.181293 \tabularnewline
\hline
\end{tabular}
%Source: https://freestatistics.org/blog/index.php?pk=28977&T=1

[TABLE]
[ROW][C]Autocorrelation Function[/C][/ROW]
[ROW][C]Time lag k[/C][C]ACF(k)[/C][C]T-STAT[/C][C]P-value[/C][/ROW]
[ROW][C]1[/C][C]-0.336945[/C][C]-2.8591[/C][C]0.002777[/C][/ROW]
[ROW][C]2[/C][C]-0.300881[/C][C]-2.5531[/C][C]0.006399[/C][/ROW]
[ROW][C]3[/C][C]0.10687[/C][C]0.9068[/C][C]0.183763[/C][/ROW]
[ROW][C]4[/C][C]0.034216[/C][C]0.2903[/C][C]0.386197[/C][/ROW]
[ROW][C]5[/C][C]-0.058641[/C][C]-0.4976[/C][C]0.310146[/C][/ROW]
[ROW][C]6[/C][C]0.165924[/C][C]1.4079[/C][C]0.081731[/C][/ROW]
[ROW][C]7[/C][C]-0.146385[/C][C]-1.2421[/C][C]0.109112[/C][/ROW]
[ROW][C]8[/C][C]0.11127[/C][C]0.9442[/C][C]0.174124[/C][/ROW]
[ROW][C]9[/C][C]0.037346[/C][C]0.3169[/C][C]0.376122[/C][/ROW]
[ROW][C]10[/C][C]-0.278482[/C][C]-2.363[/C][C]0.010416[/C][/ROW]
[ROW][C]11[/C][C]-0.142264[/C][C]-1.2071[/C][C]0.115663[/C][/ROW]
[ROW][C]12[/C][C]0.635652[/C][C]5.3937[/C][C]0[/C][/ROW]
[ROW][C]13[/C][C]-0.209025[/C][C]-1.7736[/C][C]0.040176[/C][/ROW]
[ROW][C]14[/C][C]-0.19088[/C][C]-1.6197[/C][C]0.054837[/C][/ROW]
[ROW][C]15[/C][C]0.035502[/C][C]0.3012[/C][C]0.38205[/C][/ROW]
[ROW][C]16[/C][C]-0.019301[/C][C]-0.1638[/C][C]0.435185[/C][/ROW]
[ROW][C]17[/C][C]0.047519[/C][C]0.4032[/C][C]0.343993[/C][/ROW]
[ROW][C]18[/C][C]0.070495[/C][C]0.5982[/C][C]0.275803[/C][/ROW]
[ROW][C]19[/C][C]-0.093282[/C][C]-0.7915[/C][C]0.215619[/C][/ROW]
[ROW][C]20[/C][C]0.1174[/C][C]0.9962[/C][C]0.161252[/C][/ROW]
[ROW][C]21[/C][C]-0.022053[/C][C]-0.1871[/C][C]0.426045[/C][/ROW]
[ROW][C]22[/C][C]-0.235399[/C][C]-1.9974[/C][C]0.024779[/C][/ROW]
[ROW][C]23[/C][C]0.024627[/C][C]0.209[/C][C]0.417534[/C][/ROW]
[ROW][C]24[/C][C]0.328167[/C][C]2.7846[/C][C]0.003422[/C][/ROW]
[ROW][C]25[/C][C]-0.105629[/C][C]-0.8963[/C][C]0.186541[/C][/ROW]
[ROW][C]26[/C][C]-0.069654[/C][C]-0.591[/C][C]0.278174[/C][/ROW]
[ROW][C]27[/C][C]-0.062067[/C][C]-0.5267[/C][C]0.300026[/C][/ROW]
[ROW][C]28[/C][C]0.02899[/C][C]0.246[/C][C]0.403195[/C][/ROW]
[ROW][C]29[/C][C]0.040287[/C][C]0.3418[/C][C]0.366732[/C][/ROW]
[ROW][C]30[/C][C]-0.001797[/C][C]-0.0152[/C][C]0.493938[/C][/ROW]
[ROW][C]31[/C][C]-0.00838[/C][C]-0.0711[/C][C]0.471757[/C][/ROW]
[ROW][C]32[/C][C]0.082891[/C][C]0.7034[/C][C]0.242052[/C][/ROW]
[ROW][C]33[/C][C]-0.056727[/C][C]-0.4813[/C][C]0.315867[/C][/ROW]
[ROW][C]34[/C][C]-0.160078[/C][C]-1.3583[/C][C]0.089303[/C][/ROW]
[ROW][C]35[/C][C]0.005694[/C][C]0.0483[/C][C]0.480801[/C][/ROW]
[ROW][C]36[/C][C]0.264171[/C][C]2.2416[/C][C]0.014036[/C][/ROW]
[ROW][C]37[/C][C]-0.075462[/C][C]-0.6403[/C][C]0.261999[/C][/ROW]
[ROW][C]38[/C][C]-0.068057[/C][C]-0.5775[/C][C]0.282707[/C][/ROW]
[ROW][C]39[/C][C]-0.091837[/C][C]-0.7793[/C][C]0.219189[/C][/ROW]
[ROW][C]40[/C][C]0.134968[/C][C]1.1452[/C][C]0.127951[/C][/ROW]
[ROW][C]41[/C][C]-0.028429[/C][C]-0.2412[/C][C]0.405032[/C][/ROW]
[ROW][C]42[/C][C]-0.030168[/C][C]-0.256[/C][C]0.399348[/C][/ROW]
[ROW][C]43[/C][C]0.016893[/C][C]0.1433[/C][C]0.443212[/C][/ROW]
[ROW][C]44[/C][C]0.082058[/C][C]0.6963[/C][C]0.244245[/C][/ROW]
[ROW][C]45[/C][C]-0.062441[/C][C]-0.5298[/C][C]0.29893[/C][/ROW]
[ROW][C]46[/C][C]-0.080394[/C][C]-0.6822[/C][C]0.24866[/C][/ROW]
[ROW][C]47[/C][C]-0.045811[/C][C]-0.3887[/C][C]0.349317[/C][/ROW]
[ROW][C]48[/C][C]0.205556[/C][C]1.7442[/C][C]0.042696[/C][/ROW]
[ROW][C]49[/C][C]0.003429[/C][C]0.0291[/C][C]0.488434[/C][/ROW]
[ROW][C]50[/C][C]-0.125654[/C][C]-1.0662[/C][C]0.144946[/C][/ROW]
[ROW][C]51[/C][C]-0.055985[/C][C]-0.475[/C][C]0.318095[/C][/ROW]
[ROW][C]52[/C][C]0.138688[/C][C]1.1768[/C][C]0.121574[/C][/ROW]
[ROW][C]53[/C][C]-0.056931[/C][C]-0.4831[/C][C]0.315253[/C][/ROW]
[ROW][C]54[/C][C]-0.001726[/C][C]-0.0146[/C][C]0.494179[/C][/ROW]
[ROW][C]55[/C][C]0.003923[/C][C]0.0333[/C][C]0.486768[/C][/ROW]
[ROW][C]56[/C][C]0.012299[/C][C]0.1044[/C][C]0.458587[/C][/ROW]
[ROW][C]57[/C][C]0.010612[/C][C]0.09[/C][C]0.464252[/C][/ROW]
[ROW][C]58[/C][C]-0.066165[/C][C]-0.5614[/C][C]0.288125[/C][/ROW]
[ROW][C]59[/C][C]-0.019135[/C][C]-0.1624[/C][C]0.435735[/C][/ROW]
[ROW][C]60[/C][C]0.107983[/C][C]0.9163[/C][C]0.181293[/C][/ROW]
[/TABLE]
Source: https://freestatistics.org/blog/index.php?pk=28977&T=1

Globally Unique Identifier (entire table): ba.freestatistics.org/blog/index.php?pk=28977&T=1

As an alternative you can also use a QR Code:  

The GUIDs for individual cells are displayed in the table below:

Autocorrelation Function
Time lag kACF(k)T-STATP-value
1-0.336945-2.85910.002777
2-0.300881-2.55310.006399
30.106870.90680.183763
40.0342160.29030.386197
5-0.058641-0.49760.310146
60.1659241.40790.081731
7-0.146385-1.24210.109112
80.111270.94420.174124
90.0373460.31690.376122
10-0.278482-2.3630.010416
11-0.142264-1.20710.115663
120.6356525.39370
13-0.209025-1.77360.040176
14-0.19088-1.61970.054837
150.0355020.30120.38205
16-0.019301-0.16380.435185
170.0475190.40320.343993
180.0704950.59820.275803
19-0.093282-0.79150.215619
200.11740.99620.161252
21-0.022053-0.18710.426045
22-0.235399-1.99740.024779
230.0246270.2090.417534
240.3281672.78460.003422
25-0.105629-0.89630.186541
26-0.069654-0.5910.278174
27-0.062067-0.52670.300026
280.028990.2460.403195
290.0402870.34180.366732
30-0.001797-0.01520.493938
31-0.00838-0.07110.471757
320.0828910.70340.242052
33-0.056727-0.48130.315867
34-0.160078-1.35830.089303
350.0056940.04830.480801
360.2641712.24160.014036
37-0.075462-0.64030.261999
38-0.068057-0.57750.282707
39-0.091837-0.77930.219189
400.1349681.14520.127951
41-0.028429-0.24120.405032
42-0.030168-0.2560.399348
430.0168930.14330.443212
440.0820580.69630.244245
45-0.062441-0.52980.29893
46-0.080394-0.68220.24866
47-0.045811-0.38870.349317
480.2055561.74420.042696
490.0034290.02910.488434
50-0.125654-1.06620.144946
51-0.055985-0.4750.318095
520.1386881.17680.121574
53-0.056931-0.48310.315253
54-0.001726-0.01460.494179
550.0039230.03330.486768
560.0122990.10440.458587
570.0106120.090.464252
58-0.066165-0.56140.288125
59-0.019135-0.16240.435735
600.1079830.91630.181293


Partial Autocorrelation Function
Time lag kPACF(k)T-STATP-value
1-0.336945-2.85910.002777
2-0.467487-3.96688.5e-05
3-0.287875-2.44270.008516
4-0.281811-2.39120.009703
5-0.317525-2.69430.004386
6-0.061913-0.52530.300477
7-0.213394-1.81070.037179
80.1063630.90250.184896
90.2117741.7970.038268
10-0.081715-0.69340.245153
11-0.576836-4.89463e-06
120.0253980.21550.414989
13-0.012095-0.10260.459272
140.1226371.04060.15077
150.0731210.62050.268459
16-0.027601-0.23420.407745
170.0117770.09990.460338
18-0.163637-1.38850.084632
19-0.055722-0.47280.318886
20-0.071995-0.61090.271596
21-0.046804-0.39710.346219
22-0.088196-0.74840.228339
230.0609180.51690.303403
24-0.045096-0.38260.351553
25-0.066658-0.56560.286708
260.0204650.17370.431312
27-0.056198-0.47690.317455
280.1529491.29780.099246
290.0365560.31020.378658
300.0551940.46830.320479
31-0.000339-0.00290.498856
32-0.055906-0.47440.318334
33-0.013435-0.1140.454779
34-0.040028-0.33960.367556
35-0.159848-1.35640.089612
360.017550.14890.441019
370.0138940.11790.453241
38-0.017895-0.15180.439868
39-0.135786-1.15220.126528
400.0209390.17770.429741
410.0215790.18310.427614
420.0553980.47010.319862
43-0.021936-0.18610.426433
44-0.012506-0.10610.457892
45-0.043379-0.36810.356945
460.0127280.1080.457149
470.0684230.58060.281664
48-0.01671-0.14180.443822
490.1103050.9360.176209
500.0165280.14020.44443
510.0867420.7360.232052
52-0.032398-0.27490.392088
53-0.07095-0.6020.274522
540.0012560.01070.495765
550.0190220.16140.436113
56-0.036902-0.31310.377545
57-0.055914-0.47440.318309
58-0.056399-0.47860.316849
590.054820.46520.321608
600.0416160.35310.362515

\begin{tabular}{lllllllll}
\hline
Partial Autocorrelation Function \tabularnewline
Time lag k & PACF(k) & T-STAT & P-value \tabularnewline
1 & -0.336945 & -2.8591 & 0.002777 \tabularnewline
2 & -0.467487 & -3.9668 & 8.5e-05 \tabularnewline
3 & -0.287875 & -2.4427 & 0.008516 \tabularnewline
4 & -0.281811 & -2.3912 & 0.009703 \tabularnewline
5 & -0.317525 & -2.6943 & 0.004386 \tabularnewline
6 & -0.061913 & -0.5253 & 0.300477 \tabularnewline
7 & -0.213394 & -1.8107 & 0.037179 \tabularnewline
8 & 0.106363 & 0.9025 & 0.184896 \tabularnewline
9 & 0.211774 & 1.797 & 0.038268 \tabularnewline
10 & -0.081715 & -0.6934 & 0.245153 \tabularnewline
11 & -0.576836 & -4.8946 & 3e-06 \tabularnewline
12 & 0.025398 & 0.2155 & 0.414989 \tabularnewline
13 & -0.012095 & -0.1026 & 0.459272 \tabularnewline
14 & 0.122637 & 1.0406 & 0.15077 \tabularnewline
15 & 0.073121 & 0.6205 & 0.268459 \tabularnewline
16 & -0.027601 & -0.2342 & 0.407745 \tabularnewline
17 & 0.011777 & 0.0999 & 0.460338 \tabularnewline
18 & -0.163637 & -1.3885 & 0.084632 \tabularnewline
19 & -0.055722 & -0.4728 & 0.318886 \tabularnewline
20 & -0.071995 & -0.6109 & 0.271596 \tabularnewline
21 & -0.046804 & -0.3971 & 0.346219 \tabularnewline
22 & -0.088196 & -0.7484 & 0.228339 \tabularnewline
23 & 0.060918 & 0.5169 & 0.303403 \tabularnewline
24 & -0.045096 & -0.3826 & 0.351553 \tabularnewline
25 & -0.066658 & -0.5656 & 0.286708 \tabularnewline
26 & 0.020465 & 0.1737 & 0.431312 \tabularnewline
27 & -0.056198 & -0.4769 & 0.317455 \tabularnewline
28 & 0.152949 & 1.2978 & 0.099246 \tabularnewline
29 & 0.036556 & 0.3102 & 0.378658 \tabularnewline
30 & 0.055194 & 0.4683 & 0.320479 \tabularnewline
31 & -0.000339 & -0.0029 & 0.498856 \tabularnewline
32 & -0.055906 & -0.4744 & 0.318334 \tabularnewline
33 & -0.013435 & -0.114 & 0.454779 \tabularnewline
34 & -0.040028 & -0.3396 & 0.367556 \tabularnewline
35 & -0.159848 & -1.3564 & 0.089612 \tabularnewline
36 & 0.01755 & 0.1489 & 0.441019 \tabularnewline
37 & 0.013894 & 0.1179 & 0.453241 \tabularnewline
38 & -0.017895 & -0.1518 & 0.439868 \tabularnewline
39 & -0.135786 & -1.1522 & 0.126528 \tabularnewline
40 & 0.020939 & 0.1777 & 0.429741 \tabularnewline
41 & 0.021579 & 0.1831 & 0.427614 \tabularnewline
42 & 0.055398 & 0.4701 & 0.319862 \tabularnewline
43 & -0.021936 & -0.1861 & 0.426433 \tabularnewline
44 & -0.012506 & -0.1061 & 0.457892 \tabularnewline
45 & -0.043379 & -0.3681 & 0.356945 \tabularnewline
46 & 0.012728 & 0.108 & 0.457149 \tabularnewline
47 & 0.068423 & 0.5806 & 0.281664 \tabularnewline
48 & -0.01671 & -0.1418 & 0.443822 \tabularnewline
49 & 0.110305 & 0.936 & 0.176209 \tabularnewline
50 & 0.016528 & 0.1402 & 0.44443 \tabularnewline
51 & 0.086742 & 0.736 & 0.232052 \tabularnewline
52 & -0.032398 & -0.2749 & 0.392088 \tabularnewline
53 & -0.07095 & -0.602 & 0.274522 \tabularnewline
54 & 0.001256 & 0.0107 & 0.495765 \tabularnewline
55 & 0.019022 & 0.1614 & 0.436113 \tabularnewline
56 & -0.036902 & -0.3131 & 0.377545 \tabularnewline
57 & -0.055914 & -0.4744 & 0.318309 \tabularnewline
58 & -0.056399 & -0.4786 & 0.316849 \tabularnewline
59 & 0.05482 & 0.4652 & 0.321608 \tabularnewline
60 & 0.041616 & 0.3531 & 0.362515 \tabularnewline
\hline
\end{tabular}
%Source: https://freestatistics.org/blog/index.php?pk=28977&T=2

[TABLE]
[ROW][C]Partial Autocorrelation Function[/C][/ROW]
[ROW][C]Time lag k[/C][C]PACF(k)[/C][C]T-STAT[/C][C]P-value[/C][/ROW]
[ROW][C]1[/C][C]-0.336945[/C][C]-2.8591[/C][C]0.002777[/C][/ROW]
[ROW][C]2[/C][C]-0.467487[/C][C]-3.9668[/C][C]8.5e-05[/C][/ROW]
[ROW][C]3[/C][C]-0.287875[/C][C]-2.4427[/C][C]0.008516[/C][/ROW]
[ROW][C]4[/C][C]-0.281811[/C][C]-2.3912[/C][C]0.009703[/C][/ROW]
[ROW][C]5[/C][C]-0.317525[/C][C]-2.6943[/C][C]0.004386[/C][/ROW]
[ROW][C]6[/C][C]-0.061913[/C][C]-0.5253[/C][C]0.300477[/C][/ROW]
[ROW][C]7[/C][C]-0.213394[/C][C]-1.8107[/C][C]0.037179[/C][/ROW]
[ROW][C]8[/C][C]0.106363[/C][C]0.9025[/C][C]0.184896[/C][/ROW]
[ROW][C]9[/C][C]0.211774[/C][C]1.797[/C][C]0.038268[/C][/ROW]
[ROW][C]10[/C][C]-0.081715[/C][C]-0.6934[/C][C]0.245153[/C][/ROW]
[ROW][C]11[/C][C]-0.576836[/C][C]-4.8946[/C][C]3e-06[/C][/ROW]
[ROW][C]12[/C][C]0.025398[/C][C]0.2155[/C][C]0.414989[/C][/ROW]
[ROW][C]13[/C][C]-0.012095[/C][C]-0.1026[/C][C]0.459272[/C][/ROW]
[ROW][C]14[/C][C]0.122637[/C][C]1.0406[/C][C]0.15077[/C][/ROW]
[ROW][C]15[/C][C]0.073121[/C][C]0.6205[/C][C]0.268459[/C][/ROW]
[ROW][C]16[/C][C]-0.027601[/C][C]-0.2342[/C][C]0.407745[/C][/ROW]
[ROW][C]17[/C][C]0.011777[/C][C]0.0999[/C][C]0.460338[/C][/ROW]
[ROW][C]18[/C][C]-0.163637[/C][C]-1.3885[/C][C]0.084632[/C][/ROW]
[ROW][C]19[/C][C]-0.055722[/C][C]-0.4728[/C][C]0.318886[/C][/ROW]
[ROW][C]20[/C][C]-0.071995[/C][C]-0.6109[/C][C]0.271596[/C][/ROW]
[ROW][C]21[/C][C]-0.046804[/C][C]-0.3971[/C][C]0.346219[/C][/ROW]
[ROW][C]22[/C][C]-0.088196[/C][C]-0.7484[/C][C]0.228339[/C][/ROW]
[ROW][C]23[/C][C]0.060918[/C][C]0.5169[/C][C]0.303403[/C][/ROW]
[ROW][C]24[/C][C]-0.045096[/C][C]-0.3826[/C][C]0.351553[/C][/ROW]
[ROW][C]25[/C][C]-0.066658[/C][C]-0.5656[/C][C]0.286708[/C][/ROW]
[ROW][C]26[/C][C]0.020465[/C][C]0.1737[/C][C]0.431312[/C][/ROW]
[ROW][C]27[/C][C]-0.056198[/C][C]-0.4769[/C][C]0.317455[/C][/ROW]
[ROW][C]28[/C][C]0.152949[/C][C]1.2978[/C][C]0.099246[/C][/ROW]
[ROW][C]29[/C][C]0.036556[/C][C]0.3102[/C][C]0.378658[/C][/ROW]
[ROW][C]30[/C][C]0.055194[/C][C]0.4683[/C][C]0.320479[/C][/ROW]
[ROW][C]31[/C][C]-0.000339[/C][C]-0.0029[/C][C]0.498856[/C][/ROW]
[ROW][C]32[/C][C]-0.055906[/C][C]-0.4744[/C][C]0.318334[/C][/ROW]
[ROW][C]33[/C][C]-0.013435[/C][C]-0.114[/C][C]0.454779[/C][/ROW]
[ROW][C]34[/C][C]-0.040028[/C][C]-0.3396[/C][C]0.367556[/C][/ROW]
[ROW][C]35[/C][C]-0.159848[/C][C]-1.3564[/C][C]0.089612[/C][/ROW]
[ROW][C]36[/C][C]0.01755[/C][C]0.1489[/C][C]0.441019[/C][/ROW]
[ROW][C]37[/C][C]0.013894[/C][C]0.1179[/C][C]0.453241[/C][/ROW]
[ROW][C]38[/C][C]-0.017895[/C][C]-0.1518[/C][C]0.439868[/C][/ROW]
[ROW][C]39[/C][C]-0.135786[/C][C]-1.1522[/C][C]0.126528[/C][/ROW]
[ROW][C]40[/C][C]0.020939[/C][C]0.1777[/C][C]0.429741[/C][/ROW]
[ROW][C]41[/C][C]0.021579[/C][C]0.1831[/C][C]0.427614[/C][/ROW]
[ROW][C]42[/C][C]0.055398[/C][C]0.4701[/C][C]0.319862[/C][/ROW]
[ROW][C]43[/C][C]-0.021936[/C][C]-0.1861[/C][C]0.426433[/C][/ROW]
[ROW][C]44[/C][C]-0.012506[/C][C]-0.1061[/C][C]0.457892[/C][/ROW]
[ROW][C]45[/C][C]-0.043379[/C][C]-0.3681[/C][C]0.356945[/C][/ROW]
[ROW][C]46[/C][C]0.012728[/C][C]0.108[/C][C]0.457149[/C][/ROW]
[ROW][C]47[/C][C]0.068423[/C][C]0.5806[/C][C]0.281664[/C][/ROW]
[ROW][C]48[/C][C]-0.01671[/C][C]-0.1418[/C][C]0.443822[/C][/ROW]
[ROW][C]49[/C][C]0.110305[/C][C]0.936[/C][C]0.176209[/C][/ROW]
[ROW][C]50[/C][C]0.016528[/C][C]0.1402[/C][C]0.44443[/C][/ROW]
[ROW][C]51[/C][C]0.086742[/C][C]0.736[/C][C]0.232052[/C][/ROW]
[ROW][C]52[/C][C]-0.032398[/C][C]-0.2749[/C][C]0.392088[/C][/ROW]
[ROW][C]53[/C][C]-0.07095[/C][C]-0.602[/C][C]0.274522[/C][/ROW]
[ROW][C]54[/C][C]0.001256[/C][C]0.0107[/C][C]0.495765[/C][/ROW]
[ROW][C]55[/C][C]0.019022[/C][C]0.1614[/C][C]0.436113[/C][/ROW]
[ROW][C]56[/C][C]-0.036902[/C][C]-0.3131[/C][C]0.377545[/C][/ROW]
[ROW][C]57[/C][C]-0.055914[/C][C]-0.4744[/C][C]0.318309[/C][/ROW]
[ROW][C]58[/C][C]-0.056399[/C][C]-0.4786[/C][C]0.316849[/C][/ROW]
[ROW][C]59[/C][C]0.05482[/C][C]0.4652[/C][C]0.321608[/C][/ROW]
[ROW][C]60[/C][C]0.041616[/C][C]0.3531[/C][C]0.362515[/C][/ROW]
[/TABLE]
Source: https://freestatistics.org/blog/index.php?pk=28977&T=2

Globally Unique Identifier (entire table): ba.freestatistics.org/blog/index.php?pk=28977&T=2

As an alternative you can also use a QR Code:  

The GUIDs for individual cells are displayed in the table below:

Partial Autocorrelation Function
Time lag kPACF(k)T-STATP-value
1-0.336945-2.85910.002777
2-0.467487-3.96688.5e-05
3-0.287875-2.44270.008516
4-0.281811-2.39120.009703
5-0.317525-2.69430.004386
6-0.061913-0.52530.300477
7-0.213394-1.81070.037179
80.1063630.90250.184896
90.2117741.7970.038268
10-0.081715-0.69340.245153
11-0.576836-4.89463e-06
120.0253980.21550.414989
13-0.012095-0.10260.459272
140.1226371.04060.15077
150.0731210.62050.268459
16-0.027601-0.23420.407745
170.0117770.09990.460338
18-0.163637-1.38850.084632
19-0.055722-0.47280.318886
20-0.071995-0.61090.271596
21-0.046804-0.39710.346219
22-0.088196-0.74840.228339
230.0609180.51690.303403
24-0.045096-0.38260.351553
25-0.066658-0.56560.286708
260.0204650.17370.431312
27-0.056198-0.47690.317455
280.1529491.29780.099246
290.0365560.31020.378658
300.0551940.46830.320479
31-0.000339-0.00290.498856
32-0.055906-0.47440.318334
33-0.013435-0.1140.454779
34-0.040028-0.33960.367556
35-0.159848-1.35640.089612
360.017550.14890.441019
370.0138940.11790.453241
38-0.017895-0.15180.439868
39-0.135786-1.15220.126528
400.0209390.17770.429741
410.0215790.18310.427614
420.0553980.47010.319862
43-0.021936-0.18610.426433
44-0.012506-0.10610.457892
45-0.043379-0.36810.356945
460.0127280.1080.457149
470.0684230.58060.281664
48-0.01671-0.14180.443822
490.1103050.9360.176209
500.0165280.14020.44443
510.0867420.7360.232052
52-0.032398-0.27490.392088
53-0.07095-0.6020.274522
540.0012560.01070.495765
550.0190220.16140.436113
56-0.036902-0.31310.377545
57-0.055914-0.47440.318309
58-0.056399-0.47860.316849
590.054820.46520.321608
600.0416160.35310.362515


Parameters (Session):
par1 = 60 ; par2 = 1 ; par3 = 1 ; par4 = 0 ; par5 = 12 ;
Parameters (R input):
par1 = 60 ; par2 = 1 ; par3 = 1 ; par4 = 0 ; par5 = 12 ;
R code (references can be found in the software module):
if (par1 == 'Default') {
par1 = 10*log10(length(x))
} else {
par1 <- as.numeric(par1)
}
par2 <- as.numeric(par2)
par3 <- as.numeric(par3)
par4 <- as.numeric(par4)
par5 <- as.numeric(par5)
if (par2 == 0) {
x <- log(x)
} else {
x <- (x ^ par2 - 1) / par2
}
if (par3 > 0) x <- diff(x,lag=1,difference=par3)
if (par4 > 0) x <- diff(x,lag=par5,difference=par4)
bitmap(file='pic1.png')
racf <- acf(x,par1,main='Autocorrelation',xlab='lags',ylab='ACF')
dev.off()
bitmap(file='pic2.png')
rpacf <- pacf(x,par1,main='Partial Autocorrelation',xlab='lags',ylab='PACF')
dev.off()
(myacf <- c(racf$acf))
(mypacf <- c(rpacf$acf))
lengthx <- length(x)
sqrtn <- sqrt(lengthx)
load(file='createtable')
a<-table.start()
a<-table.row.start(a)
a<-table.element(a,'Autocorrelation Function',4,TRUE)
a<-table.row.end(a)
a<-table.row.start(a)
a<-table.element(a,'Time lag k',header=TRUE)
a<-table.element(a,hyperlink('basics.htm','ACF(k)','click here for more information about the Autocorrelation Function'),header=TRUE)
a<-table.element(a,'T-STAT',header=TRUE)
a<-table.element(a,'P-value',header=TRUE)
a<-table.row.end(a)
for (i in 2:(par1+1)) {
a<-table.row.start(a)
a<-table.element(a,i-1,header=TRUE)
a<-table.element(a,round(myacf[i],6))
mytstat <- myacf[i]*sqrtn
a<-table.element(a,round(mytstat,4))
a<-table.element(a,round(1-pt(abs(mytstat),lengthx),6))
a<-table.row.end(a)
}
a<-table.end(a)
table.save(a,file='mytable.tab')
a<-table.start()
a<-table.row.start(a)
a<-table.element(a,'Partial Autocorrelation Function',4,TRUE)
a<-table.row.end(a)
a<-table.row.start(a)
a<-table.element(a,'Time lag k',header=TRUE)
a<-table.element(a,hyperlink('basics.htm','PACF(k)','click here for more information about the Partial Autocorrelation Function'),header=TRUE)
a<-table.element(a,'T-STAT',header=TRUE)
a<-table.element(a,'P-value',header=TRUE)
a<-table.row.end(a)
for (i in 1:par1) {
a<-table.row.start(a)
a<-table.element(a,i,header=TRUE)
a<-table.element(a,round(mypacf[i],6))
mytstat <- mypacf[i]*sqrtn
a<-table.element(a,round(mytstat,4))
a<-table.element(a,round(1-pt(abs(mytstat),lengthx),6))
a<-table.row.end(a)
}
a<-table.end(a)
table.save(a,file='mytable1.tab')