Free Statistics

of Irreproducible Research!

Author's title

Author*Unverified author*
R Software Modulerwasp_autocorrelation.wasp
Title produced by software(Partial) Autocorrelation Function
Date of computationThu, 04 Dec 2008 12:54:00 -0700
Cite this page as followsStatistical Computations at FreeStatistics.org, Office for Research Development and Education, URL https://freestatistics.org/blog/index.php?v=date/2008/Dec/04/t12284205632q0p55nl5e5tina.htm/, Retrieved Sat, 18 May 2024 09:57:13 +0000
Statistical Computations at FreeStatistics.org, Office for Research Development and Education, URL https://freestatistics.org/blog/index.php?pk=29045, Retrieved Sat, 18 May 2024 09:57:13 +0000
QR Codes:

Original text written by user:
IsPrivate?No (this computation is public)
User-defined keywords
Estimated Impact327
Family? (F = Feedback message, R = changed R code, M = changed R Module, P = changed Parameters, D = changed Data)
F       [(Partial) Autocorrelation Function] [] [2008-12-04 19:54:00] [ba8414dd214a21fbd6c7bde748ac585f] [Current]
-   PD    [(Partial) Autocorrelation Function] [] [2008-12-09 11:12:23] [74be16979710d4c4e7c6647856088456]
Feedback Forum
2008-12-13 12:54:42 [Ken Wright] [reply
in deze vraag was het de bedoeling om patronen te herkennen, de oplossing die jij hebt gegeven is voor step 3
http://www.freestatistics.org/blog/index.php?v=date/2008/Dec/07/t1228660181v7xdlytyh1x1b99.htm
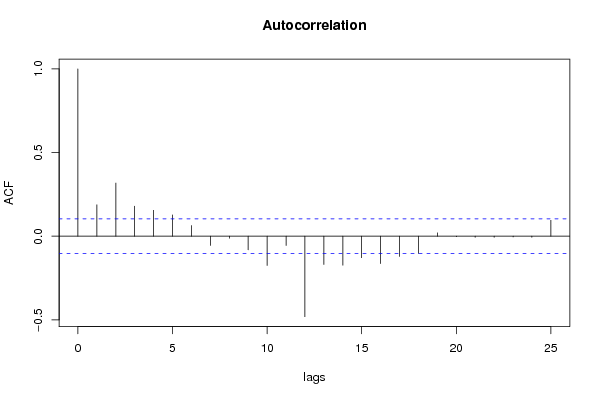
Autocorrelatie is een statistisch hulpmiddel om terugkerende patronen te kunnen identificeren. Deze geeft de bijvoorbeeld de correlatie weer van X op tijdstip t en X 2 perioden vertraagd dus X t-2. Autocorrelatie duidt er dus op dat er kan worden voorspeld op basis van het verleden. Het zal aanduiden of er niet-seizoenaal en/of seizoenaal zal moeten worden gedifferentieerd. De differentiatie zal dan proberen de tijdreeks zodanig te differentiëren zodat er geen autocorrelatie meer aanwezig is. het langzaam dalend patroon duidt op LT trend en de hogere waarde op lag 12,24,36,... duiden op seizoenaliteit
2008-12-13 12:55:52 [Ken Wright] [reply
step 3:
het langzaam dalend patroon en verhoogde waarden op lang 12;24;36 zijn eruit, er is dus goed gedifferentieerd
2008-12-13 13:00:43 [Ken Wright] [reply
step 4
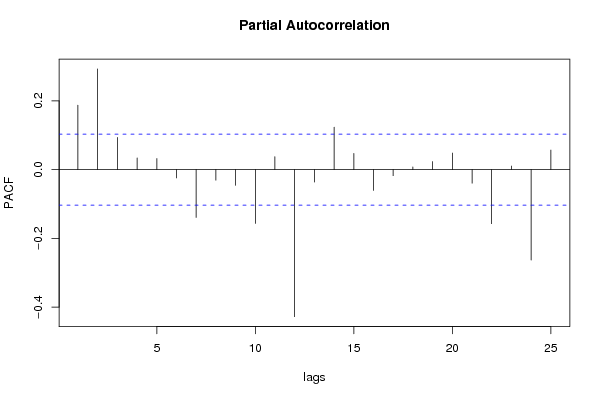
Het AR proces is herkend, maar er is ook een SMA proces aanwezig: er zit wel seizoenaliteit in de PACF. Als we enkel naar de seizoenale streepjes zien, die op lag 12, 24 en 36. Dan kan men besluiten dat er een seizoenaal MA proces aanwezig is. Om de orde te weten te komen wordt het ACF besproken. Enkel het eerste verticale streepje van de seizoenale coëfficiënten is hier significant. Het is dus een MA 1 proces --> Q = 1
2008-12-13 15:04:20 [Loïque Verhasselt] [reply
Step 2: Opnieuw vinden we de correcte output en de correcte conclusies maar we vinden geen interpretatie van de output en ook geen doorloping van de verschillende stappen. We krijgen juist de eindoplossing.
Via ACF: Wat is de ACF juist?De autocorrelatie functie geeft alle scatterplots weer van ≠ perioden vertraagd met de correlatie. We zien een typisch langzaam dalend patroon met allemaal positieve correlatiecoëfficiënten. Dit wil zeggen dat deze allemaal significant verschillen van 0! We zien niet alleen een lange termijn dalende trend maar ook op 12,24,36,… maanden die overeenkomen met lag 12,24,36 vinden we een autocorrelatie die piekt. Dit is een duidelijk beeld van seizoenaliteit.We gaan dus differentiëren, seizoenaal en niet seizoenaal: d=1,D=1 zoals de student ook gevonden heeft.Dit voeren we opnieuw in de calculator van de ACF.We zien dus duidelijk dat de trend en de seizoenaliteit verdwenen zijn. We kunnen ook een constante spreiding concluderen. Deze tijdreeks is nu stationair gemaakt.
2008-12-13 15:05:51 [Loïque Verhasselt] [reply
STEP 3: De student geeft de juiste output weer en geeft de 2 voorwaarden die moeten voldaan zijn voor stationariteit. Erg duidelijk zijn ze niet en daarom geef ik hier nog een algemene voorwaardebeschrijving.Eerste voorwaarde: de tijdreeks mag niet geïntegreerd zijn.
Dit wil zeggen dat de ACF (Auto Correlation Function) geen langzaam dalende niet - seizoenale autocorrelatiecoëfficiënten of seizoenale autocorrelatiecoëfficiënten mag bevatten.Dit impliceert eveneens dat het spectrum geen aanwijzing geeft van (sterke) cyclische golven van lage frequentie (lange periodes)of het spectrum geen (sterke) cyclische golven van seizoenale frequentie vertoont.Tweede voorwaarde: de meest waarschijnlijke verandering door toeval is constant over de tijd. Dit betekent een constante standaardfout over de ganse tijdreeks. Dit impliceert een constante spreiding. Deze conditie is nodig om gemakkelijk te kunnen differentiëren tussen veranderingen te wijten aan toeval.De eerste voorwaarde is zoals gezegd in step 3, niet voldaan. De tijdreeks vertoont nog seizoenaliteit door de cyclusgebondenheid van werkloosheid.De tweede voorwaarde is wel voldaan. We hebben door middel van de gevonden lambda - waarde in step 1 de spreiding constant gemaakt. De betrouwbare p – waarde zegt ons dat de regressie helling niet aan het toeval te wijten is, en zo dus significant is.
2008-12-13 15:06:49 [Loïque Verhasselt] [reply
STEP 4: We vinden de juiste beredenering van de student om het ACF en PACF te vergelijken met de theoretische patronen van een ARMA model. De student maakt ook de juiste conclusies voor alle parameters.
2008-12-13 20:22:47 [006ad2c49b6a7c2ad6ab685cfc1dae56] [reply
Je hebt niet de juiste processen geïdentificeerd. Dit zijn de juiste:

AR-proces:
Om een niet-seizoenaal proces te identificeren kijken we naar de eerste 4,5 coëfficiënten van de ACF (patroon). Voor de orde kijken we naar het aantal eerste coëfficiënten van de PACF dat significant is. Daaruit kunnen we concluderen dat het een AR-proces van orde 3 is. Er is geen seizoenalitiet in de ACF dus geen seizoenaal AR-proces.

MA-proces:
Er is geen MA-proces want er is een ander patroon in de PACF. De seizoenale coëfficiënten zijn allemaal negatief, dit wijst op een seizoenaal MA-proces (PACF). Voor de orde kijken we naar de ACF, alleen de eerste coëfficiënt is significant dus er is sprake van een seizoenaal MA(1)-proces.


2008-12-14 16:10:58 [Thomas Plasschaert] [reply
De grafiek van de autocorrelatie functie toont ons een dalend patroon met positieve correlatiecoefficienten, wat betekent dat deze allemaal significant verschillen van 0. De autocorrelatie functie gaat het toekomstige verloop proberen voorspellen adhv voorgaande waarnemingen. We zien niet alleen een lange termijn dalende trend maar ook een hogere waarde bij 12, 24 en 36 maanden, wat wijst op een duidelijke seizoenaliteit. Uit deze informatie kunnen we besluiten dat we zowel seizoenaal als niet-seizoenaal moeten differentieren: d=1,D=1. Wanneer we deze waarden invullen in de calculator van de autocorrelatiefunctie, zien we dat zowel de lange termijn trend en de seizoenaliteit grotendeels verdwenen zijn.


Post a new message
Dataseries X:
235.1
280.7
264.6
240.7
201.4
240.8
241.1
223.8
206.1
174.7
203.3
220.5
299.5
347.4
338.3
327.7
351.6
396.6
438.8
395.6
363.5
378.8
357
369
464.8
479.1
431.3
366.5
326.3
355.1
331.6
261.3
249
205.5
235.6
240.9
264.9
253.8
232.3
193.8
177
213.2
207.2
180.6
188.6
175.4
199
179.6
225.8
234
200.2
183.6
178.2
203.2
208.5
191.8
172.8
148
159.4
154.5
213.2
196.4
182.8
176.4
153.6
173.2
171
151.2
161.9
157.2
201.7
236.4
356.1
398.3
403.7
384.6
365.8
368.1
367.9
347
343.3
292.9
311.5
300.9
366.9
356.9
329.7
316.2
269
289.3
266.2
253.6
233.8
228.4
253.6
260.1
306.6
309.2
309.5
271
279.9
317.9
298.4
246.7
227.3
209.1
259.9
266
320.6
308.5
282.2
262.7
263.5
313.1
284.3
252.6
250.3
246.5
312.7
333.2
446.4
511.6
515.5
506.4
483.2
522.3
509.8
460.7
405.8
375
378.5
406.8
467.8
469.8
429.8
355.8
332.7
378
360.5
334.7
319.5
323.1
363.6
352.1
411.9
388.6
416.4
360.7
338
417.2
388.4
371.1
331.5
353.7
396.7
447
533.5
565.4
542.3
488.7
467.1
531.3
496.1
444
403.4
386.3
394.1
404.1
462.1
448.1
432.3
386.3
395.2
421.9
382.9
384.2
345.5
323.4
372.6
376
462.7
487
444.2
399.3
394.9
455.4
414
375.5
347
339.4
385.8
378.8
451.8
446.1
422.5
383.1
352.8
445.3
367.5
355.1
326.2
319.8
331.8
340.9
394.1
417.2
369.9
349.2
321.4
405.7
342.9
316.5
284.2
270.9
288.8
278.8
324.4
310.9
299
273
279.3
359.2
305
282.1
250.3
246.5
257.9
266.5
315.9
318.4
295.4
266.4
245.8
362.8
324.9
294.2
289.5
295.2
290.3
272
307.4
328.7
292.9
249.1
230.4
361.5
321.7
277.2
260.7
251
257.6
241.8
287.5
292.3
274.7
254.2
230
339
318.2
287
295.8
284
271
262.7
340.6
379.4
373.3
355.2
338.4
466.9
451
422
429.2
425.9
460.7
463.6
541.4
544.2
517.5
469.4
439.4
549
533
506.1
484
457
481.5
469.5
544.7
541.2
521.5
469.7
434.4
542.6
517.3
485.7
465.8
447
426.6
411.6
467.5
484.5
451.2
417.4
379.9
484.7
455
420.8
416.5
376.3
405.6
405.8
500.8
514
475.5
430.1
414.4
538
526
488.5
520.2
504.4
568.5
610.6
818
830.9
835.9
782
762.3
856.9
820.9
769.6
752.2
724.4
723.1
719.5
817.4
803.3
752.5
689
630.4
765.5
757.7
732.2
702.6
683.3
709.5
702.2
784.8
810.9
755.6
656.8
615.1
745.3
694.1
675.7
643.7
622.1
634.6
588
689.7
673.9
647.9
568.8
545.7
632.6
643.8
593.1
579.7
546
562.9
572.5


Summary of computational transaction
Raw Inputview raw input (R code)
Raw Outputview raw output of R engine
Computing time1 seconds
R Server'Gwilym Jenkins' @ 72.249.127.135

\begin{tabular}{lllllllll}
\hline
Summary of computational transaction \tabularnewline
Raw Input & view raw input (R code)  \tabularnewline
Raw Output & view raw output of R engine  \tabularnewline
Computing time & 1 seconds \tabularnewline
R Server & 'Gwilym Jenkins' @ 72.249.127.135 \tabularnewline
\hline
\end{tabular}
%Source: https://freestatistics.org/blog/index.php?pk=29045&T=0

[TABLE]
[ROW][C]Summary of computational transaction[/C][/ROW]
[ROW][C]Raw Input[/C][C]view raw input (R code) [/C][/ROW]
[ROW][C]Raw Output[/C][C]view raw output of R engine [/C][/ROW]
[ROW][C]Computing time[/C][C]1 seconds[/C][/ROW]
[ROW][C]R Server[/C][C]'Gwilym Jenkins' @ 72.249.127.135[/C][/ROW]
[/TABLE]
Source: https://freestatistics.org/blog/index.php?pk=29045&T=0

Globally Unique Identifier (entire table): ba.freestatistics.org/blog/index.php?pk=29045&T=0

As an alternative you can also use a QR Code:  

The GUIDs for individual cells are displayed in the table below:

Summary of computational transaction
Raw Inputview raw input (R code)
Raw Outputview raw output of R engine
Computing time1 seconds
R Server'Gwilym Jenkins' @ 72.249.127.135


Autocorrelation Function
Time lag kACF(k)T-STATP-value
10.1875523.55360.000215
20.3177946.02130
30.1795633.40220.000372
40.1553032.94260.001733
50.1275962.41760.008061
60.063711.20710.114087
7-0.054701-1.03640.150347
8-0.011735-0.22240.412083
9-0.080833-1.53160.063255
10-0.174708-3.31020.000513
11-0.055263-1.04710.147883
12-0.480698-9.10790
13-0.168514-3.19290.000767
14-0.172913-3.27620.000577
15-0.128287-2.43070.007779
16-0.163167-3.09160.001073
17-0.121097-2.29450.01117
18-0.103099-1.95340.025772
190.0201280.38140.351578
20-0.002775-0.05260.479049
21-0.006426-0.12170.451583
22-0.006358-0.12050.45209
23-0.004364-0.08270.467075
24-0.006343-0.12020.452205
250.0949111.79830.036484

\begin{tabular}{lllllllll}
\hline
Autocorrelation Function \tabularnewline
Time lag k & ACF(k) & T-STAT & P-value \tabularnewline
1 & 0.187552 & 3.5536 & 0.000215 \tabularnewline
2 & 0.317794 & 6.0213 & 0 \tabularnewline
3 & 0.179563 & 3.4022 & 0.000372 \tabularnewline
4 & 0.155303 & 2.9426 & 0.001733 \tabularnewline
5 & 0.127596 & 2.4176 & 0.008061 \tabularnewline
6 & 0.06371 & 1.2071 & 0.114087 \tabularnewline
7 & -0.054701 & -1.0364 & 0.150347 \tabularnewline
8 & -0.011735 & -0.2224 & 0.412083 \tabularnewline
9 & -0.080833 & -1.5316 & 0.063255 \tabularnewline
10 & -0.174708 & -3.3102 & 0.000513 \tabularnewline
11 & -0.055263 & -1.0471 & 0.147883 \tabularnewline
12 & -0.480698 & -9.1079 & 0 \tabularnewline
13 & -0.168514 & -3.1929 & 0.000767 \tabularnewline
14 & -0.172913 & -3.2762 & 0.000577 \tabularnewline
15 & -0.128287 & -2.4307 & 0.007779 \tabularnewline
16 & -0.163167 & -3.0916 & 0.001073 \tabularnewline
17 & -0.121097 & -2.2945 & 0.01117 \tabularnewline
18 & -0.103099 & -1.9534 & 0.025772 \tabularnewline
19 & 0.020128 & 0.3814 & 0.351578 \tabularnewline
20 & -0.002775 & -0.0526 & 0.479049 \tabularnewline
21 & -0.006426 & -0.1217 & 0.451583 \tabularnewline
22 & -0.006358 & -0.1205 & 0.45209 \tabularnewline
23 & -0.004364 & -0.0827 & 0.467075 \tabularnewline
24 & -0.006343 & -0.1202 & 0.452205 \tabularnewline
25 & 0.094911 & 1.7983 & 0.036484 \tabularnewline
\hline
\end{tabular}
%Source: https://freestatistics.org/blog/index.php?pk=29045&T=1

[TABLE]
[ROW][C]Autocorrelation Function[/C][/ROW]
[ROW][C]Time lag k[/C][C]ACF(k)[/C][C]T-STAT[/C][C]P-value[/C][/ROW]
[ROW][C]1[/C][C]0.187552[/C][C]3.5536[/C][C]0.000215[/C][/ROW]
[ROW][C]2[/C][C]0.317794[/C][C]6.0213[/C][C]0[/C][/ROW]
[ROW][C]3[/C][C]0.179563[/C][C]3.4022[/C][C]0.000372[/C][/ROW]
[ROW][C]4[/C][C]0.155303[/C][C]2.9426[/C][C]0.001733[/C][/ROW]
[ROW][C]5[/C][C]0.127596[/C][C]2.4176[/C][C]0.008061[/C][/ROW]
[ROW][C]6[/C][C]0.06371[/C][C]1.2071[/C][C]0.114087[/C][/ROW]
[ROW][C]7[/C][C]-0.054701[/C][C]-1.0364[/C][C]0.150347[/C][/ROW]
[ROW][C]8[/C][C]-0.011735[/C][C]-0.2224[/C][C]0.412083[/C][/ROW]
[ROW][C]9[/C][C]-0.080833[/C][C]-1.5316[/C][C]0.063255[/C][/ROW]
[ROW][C]10[/C][C]-0.174708[/C][C]-3.3102[/C][C]0.000513[/C][/ROW]
[ROW][C]11[/C][C]-0.055263[/C][C]-1.0471[/C][C]0.147883[/C][/ROW]
[ROW][C]12[/C][C]-0.480698[/C][C]-9.1079[/C][C]0[/C][/ROW]
[ROW][C]13[/C][C]-0.168514[/C][C]-3.1929[/C][C]0.000767[/C][/ROW]
[ROW][C]14[/C][C]-0.172913[/C][C]-3.2762[/C][C]0.000577[/C][/ROW]
[ROW][C]15[/C][C]-0.128287[/C][C]-2.4307[/C][C]0.007779[/C][/ROW]
[ROW][C]16[/C][C]-0.163167[/C][C]-3.0916[/C][C]0.001073[/C][/ROW]
[ROW][C]17[/C][C]-0.121097[/C][C]-2.2945[/C][C]0.01117[/C][/ROW]
[ROW][C]18[/C][C]-0.103099[/C][C]-1.9534[/C][C]0.025772[/C][/ROW]
[ROW][C]19[/C][C]0.020128[/C][C]0.3814[/C][C]0.351578[/C][/ROW]
[ROW][C]20[/C][C]-0.002775[/C][C]-0.0526[/C][C]0.479049[/C][/ROW]
[ROW][C]21[/C][C]-0.006426[/C][C]-0.1217[/C][C]0.451583[/C][/ROW]
[ROW][C]22[/C][C]-0.006358[/C][C]-0.1205[/C][C]0.45209[/C][/ROW]
[ROW][C]23[/C][C]-0.004364[/C][C]-0.0827[/C][C]0.467075[/C][/ROW]
[ROW][C]24[/C][C]-0.006343[/C][C]-0.1202[/C][C]0.452205[/C][/ROW]
[ROW][C]25[/C][C]0.094911[/C][C]1.7983[/C][C]0.036484[/C][/ROW]
[/TABLE]
Source: https://freestatistics.org/blog/index.php?pk=29045&T=1

Globally Unique Identifier (entire table): ba.freestatistics.org/blog/index.php?pk=29045&T=1

As an alternative you can also use a QR Code:  

The GUIDs for individual cells are displayed in the table below:

Autocorrelation Function
Time lag kACF(k)T-STATP-value
10.1875523.55360.000215
20.3177946.02130
30.1795633.40220.000372
40.1553032.94260.001733
50.1275962.41760.008061
60.063711.20710.114087
7-0.054701-1.03640.150347
8-0.011735-0.22240.412083
9-0.080833-1.53160.063255
10-0.174708-3.31020.000513
11-0.055263-1.04710.147883
12-0.480698-9.10790
13-0.168514-3.19290.000767
14-0.172913-3.27620.000577
15-0.128287-2.43070.007779
16-0.163167-3.09160.001073
17-0.121097-2.29450.01117
18-0.103099-1.95340.025772
190.0201280.38140.351578
20-0.002775-0.05260.479049
21-0.006426-0.12170.451583
22-0.006358-0.12050.45209
23-0.004364-0.08270.467075
24-0.006343-0.12020.452205
250.0949111.79830.036484


Partial Autocorrelation Function
Time lag kPACF(k)T-STATP-value
10.1875523.55360.000215
20.2929225.55010
30.0935121.77180.038638
40.0339950.64410.259959
50.0322140.61040.271005
6-0.024285-0.46010.322846
7-0.139405-2.64140.004309
8-0.030697-0.58160.280592
9-0.045877-0.86930.192645
10-0.156693-2.96890.001595
110.0375910.71220.238389
12-0.427945-8.10840
13-0.036401-0.68970.245414
140.1233192.33660.010006
150.0471120.89260.186322
16-0.060609-1.14840.125789
17-0.017722-0.33580.368615
180.0078180.14810.44116
190.0233680.44280.329106
200.0479830.90910.181941
21-0.03962-0.75070.226664
22-0.157258-2.97960.001541
230.0101950.19320.42347
24-0.263321-4.98920
250.0569861.07970.140495

\begin{tabular}{lllllllll}
\hline
Partial Autocorrelation Function \tabularnewline
Time lag k & PACF(k) & T-STAT & P-value \tabularnewline
1 & 0.187552 & 3.5536 & 0.000215 \tabularnewline
2 & 0.292922 & 5.5501 & 0 \tabularnewline
3 & 0.093512 & 1.7718 & 0.038638 \tabularnewline
4 & 0.033995 & 0.6441 & 0.259959 \tabularnewline
5 & 0.032214 & 0.6104 & 0.271005 \tabularnewline
6 & -0.024285 & -0.4601 & 0.322846 \tabularnewline
7 & -0.139405 & -2.6414 & 0.004309 \tabularnewline
8 & -0.030697 & -0.5816 & 0.280592 \tabularnewline
9 & -0.045877 & -0.8693 & 0.192645 \tabularnewline
10 & -0.156693 & -2.9689 & 0.001595 \tabularnewline
11 & 0.037591 & 0.7122 & 0.238389 \tabularnewline
12 & -0.427945 & -8.1084 & 0 \tabularnewline
13 & -0.036401 & -0.6897 & 0.245414 \tabularnewline
14 & 0.123319 & 2.3366 & 0.010006 \tabularnewline
15 & 0.047112 & 0.8926 & 0.186322 \tabularnewline
16 & -0.060609 & -1.1484 & 0.125789 \tabularnewline
17 & -0.017722 & -0.3358 & 0.368615 \tabularnewline
18 & 0.007818 & 0.1481 & 0.44116 \tabularnewline
19 & 0.023368 & 0.4428 & 0.329106 \tabularnewline
20 & 0.047983 & 0.9091 & 0.181941 \tabularnewline
21 & -0.03962 & -0.7507 & 0.226664 \tabularnewline
22 & -0.157258 & -2.9796 & 0.001541 \tabularnewline
23 & 0.010195 & 0.1932 & 0.42347 \tabularnewline
24 & -0.263321 & -4.9892 & 0 \tabularnewline
25 & 0.056986 & 1.0797 & 0.140495 \tabularnewline
\hline
\end{tabular}
%Source: https://freestatistics.org/blog/index.php?pk=29045&T=2

[TABLE]
[ROW][C]Partial Autocorrelation Function[/C][/ROW]
[ROW][C]Time lag k[/C][C]PACF(k)[/C][C]T-STAT[/C][C]P-value[/C][/ROW]
[ROW][C]1[/C][C]0.187552[/C][C]3.5536[/C][C]0.000215[/C][/ROW]
[ROW][C]2[/C][C]0.292922[/C][C]5.5501[/C][C]0[/C][/ROW]
[ROW][C]3[/C][C]0.093512[/C][C]1.7718[/C][C]0.038638[/C][/ROW]
[ROW][C]4[/C][C]0.033995[/C][C]0.6441[/C][C]0.259959[/C][/ROW]
[ROW][C]5[/C][C]0.032214[/C][C]0.6104[/C][C]0.271005[/C][/ROW]
[ROW][C]6[/C][C]-0.024285[/C][C]-0.4601[/C][C]0.322846[/C][/ROW]
[ROW][C]7[/C][C]-0.139405[/C][C]-2.6414[/C][C]0.004309[/C][/ROW]
[ROW][C]8[/C][C]-0.030697[/C][C]-0.5816[/C][C]0.280592[/C][/ROW]
[ROW][C]9[/C][C]-0.045877[/C][C]-0.8693[/C][C]0.192645[/C][/ROW]
[ROW][C]10[/C][C]-0.156693[/C][C]-2.9689[/C][C]0.001595[/C][/ROW]
[ROW][C]11[/C][C]0.037591[/C][C]0.7122[/C][C]0.238389[/C][/ROW]
[ROW][C]12[/C][C]-0.427945[/C][C]-8.1084[/C][C]0[/C][/ROW]
[ROW][C]13[/C][C]-0.036401[/C][C]-0.6897[/C][C]0.245414[/C][/ROW]
[ROW][C]14[/C][C]0.123319[/C][C]2.3366[/C][C]0.010006[/C][/ROW]
[ROW][C]15[/C][C]0.047112[/C][C]0.8926[/C][C]0.186322[/C][/ROW]
[ROW][C]16[/C][C]-0.060609[/C][C]-1.1484[/C][C]0.125789[/C][/ROW]
[ROW][C]17[/C][C]-0.017722[/C][C]-0.3358[/C][C]0.368615[/C][/ROW]
[ROW][C]18[/C][C]0.007818[/C][C]0.1481[/C][C]0.44116[/C][/ROW]
[ROW][C]19[/C][C]0.023368[/C][C]0.4428[/C][C]0.329106[/C][/ROW]
[ROW][C]20[/C][C]0.047983[/C][C]0.9091[/C][C]0.181941[/C][/ROW]
[ROW][C]21[/C][C]-0.03962[/C][C]-0.7507[/C][C]0.226664[/C][/ROW]
[ROW][C]22[/C][C]-0.157258[/C][C]-2.9796[/C][C]0.001541[/C][/ROW]
[ROW][C]23[/C][C]0.010195[/C][C]0.1932[/C][C]0.42347[/C][/ROW]
[ROW][C]24[/C][C]-0.263321[/C][C]-4.9892[/C][C]0[/C][/ROW]
[ROW][C]25[/C][C]0.056986[/C][C]1.0797[/C][C]0.140495[/C][/ROW]
[/TABLE]
Source: https://freestatistics.org/blog/index.php?pk=29045&T=2

Globally Unique Identifier (entire table): ba.freestatistics.org/blog/index.php?pk=29045&T=2

As an alternative you can also use a QR Code:  

The GUIDs for individual cells are displayed in the table below:

Partial Autocorrelation Function
Time lag kPACF(k)T-STATP-value
10.1875523.55360.000215
20.2929225.55010
30.0935121.77180.038638
40.0339950.64410.259959
50.0322140.61040.271005
6-0.024285-0.46010.322846
7-0.139405-2.64140.004309
8-0.030697-0.58160.280592
9-0.045877-0.86930.192645
10-0.156693-2.96890.001595
110.0375910.71220.238389
12-0.427945-8.10840
13-0.036401-0.68970.245414
140.1233192.33660.010006
150.0471120.89260.186322
16-0.060609-1.14840.125789
17-0.017722-0.33580.368615
180.0078180.14810.44116
190.0233680.44280.329106
200.0479830.90910.181941
21-0.03962-0.75070.226664
22-0.157258-2.97960.001541
230.0101950.19320.42347
24-0.263321-4.98920
250.0569861.07970.140495


Parameters (Session):
par1 = Default ; par2 = 0.5 ; par3 = 1 ; par4 = 1 ; par5 = 12 ;
Parameters (R input):
par1 = Default ; par2 = 0.5 ; par3 = 1 ; par4 = 1 ; par5 = 12 ;
R code (references can be found in the software module):
if (par1 == 'Default') {
par1 = 10*log10(length(x))
} else {
par1 <- as.numeric(par1)
}
par2 <- as.numeric(par2)
par3 <- as.numeric(par3)
par4 <- as.numeric(par4)
par5 <- as.numeric(par5)
if (par2 == 0) {
x <- log(x)
} else {
x <- (x ^ par2 - 1) / par2
}
if (par3 > 0) x <- diff(x,lag=1,difference=par3)
if (par4 > 0) x <- diff(x,lag=par5,difference=par4)
bitmap(file='pic1.png')
racf <- acf(x,par1,main='Autocorrelation',xlab='lags',ylab='ACF')
dev.off()
bitmap(file='pic2.png')
rpacf <- pacf(x,par1,main='Partial Autocorrelation',xlab='lags',ylab='PACF')
dev.off()
(myacf <- c(racf$acf))
(mypacf <- c(rpacf$acf))
lengthx <- length(x)
sqrtn <- sqrt(lengthx)
load(file='createtable')
a<-table.start()
a<-table.row.start(a)
a<-table.element(a,'Autocorrelation Function',4,TRUE)
a<-table.row.end(a)
a<-table.row.start(a)
a<-table.element(a,'Time lag k',header=TRUE)
a<-table.element(a,hyperlink('basics.htm','ACF(k)','click here for more information about the Autocorrelation Function'),header=TRUE)
a<-table.element(a,'T-STAT',header=TRUE)
a<-table.element(a,'P-value',header=TRUE)
a<-table.row.end(a)
for (i in 2:(par1+1)) {
a<-table.row.start(a)
a<-table.element(a,i-1,header=TRUE)
a<-table.element(a,round(myacf[i],6))
mytstat <- myacf[i]*sqrtn
a<-table.element(a,round(mytstat,4))
a<-table.element(a,round(1-pt(abs(mytstat),lengthx),6))
a<-table.row.end(a)
}
a<-table.end(a)
table.save(a,file='mytable.tab')
a<-table.start()
a<-table.row.start(a)
a<-table.element(a,'Partial Autocorrelation Function',4,TRUE)
a<-table.row.end(a)
a<-table.row.start(a)
a<-table.element(a,'Time lag k',header=TRUE)
a<-table.element(a,hyperlink('basics.htm','PACF(k)','click here for more information about the Partial Autocorrelation Function'),header=TRUE)
a<-table.element(a,'T-STAT',header=TRUE)
a<-table.element(a,'P-value',header=TRUE)
a<-table.row.end(a)
for (i in 1:par1) {
a<-table.row.start(a)
a<-table.element(a,i,header=TRUE)
a<-table.element(a,round(mypacf[i],6))
mytstat <- mypacf[i]*sqrtn
a<-table.element(a,round(mytstat,4))
a<-table.element(a,round(1-pt(abs(mytstat),lengthx),6))
a<-table.row.end(a)
}
a<-table.end(a)
table.save(a,file='mytable1.tab')