Free Statistics

of Irreproducible Research!

Author's title

Author*The author of this computation has been verified*
R Software Modulerwasp_spectrum.wasp
Title produced by softwareSpectral Analysis
Date of computationSat, 06 Dec 2008 11:09:24 -0700
Cite this page as followsStatistical Computations at FreeStatistics.org, Office for Research Development and Education, URL https://freestatistics.org/blog/index.php?v=date/2008/Dec/06/t1228587086shkp9milzyxo9rk.htm/, Retrieved Sat, 18 May 2024 04:28:29 +0000
Statistical Computations at FreeStatistics.org, Office for Research Development and Education, URL https://freestatistics.org/blog/index.php?pk=29785, Retrieved Sat, 18 May 2024 04:28:29 +0000
QR Codes:

Original text written by user:
IsPrivate?No (this computation is public)
User-defined keywords
Estimated Impact189
Family? (F = Feedback message, R = changed R code, M = changed R Module, P = changed Parameters, D = changed Data)
-     [Univariate Data Series] [data set] [2008-12-01 19:54:57] [b98453cac15ba1066b407e146608df68]
F RMP   [Variance Reduction Matrix] [step 2] [2008-12-06 09:12:19] [9f5bfe3b95f9ec3d2ed4c0a560a9648a]
F RMPD      [Spectral Analysis] [step 2] [2008-12-06 18:09:24] [a9e6d7cd6e144e8b311d9f96a24c5a25] [Current]
F   P         [Spectral Analysis] [step 3] [2008-12-06 18:24:41] [9f5bfe3b95f9ec3d2ed4c0a560a9648a]
Feedback Forum
2008-12-13 11:24:49 [Ken Wright] [reply
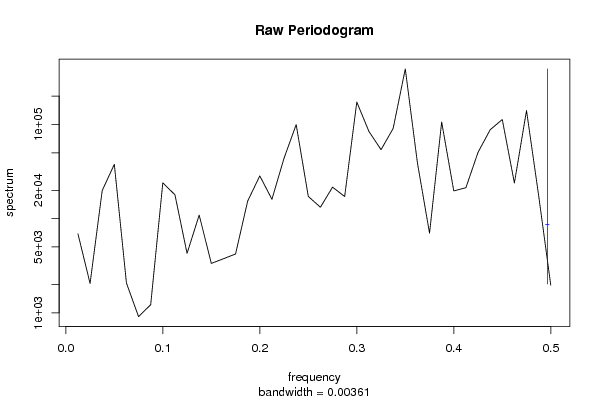
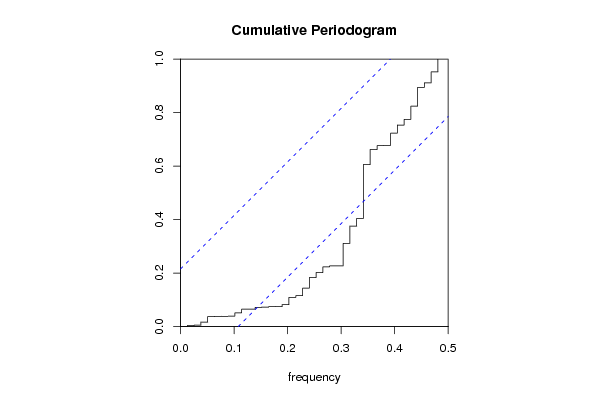
In het oorspronkelijk raw periodogram zag je een neergaande trend die duidde op LT trend en terugkerende fluctuaties die regelmatig waren, dit duidde op seizoenaliteit. Na differentiatie zijn ze beide gefilterd. Uit het cumulative periodogram is zowel de steile helling verdwenen en ook het getrapt verloop, men kan dus besluiten dat er met succes is gedifferentieerd.
2008-12-16 19:04:57 [Kevin Vermeiren] [reply
De student vermeldt terecht dat de seizoenaliteit nu ook verdwenen is. Hier had nog kunnen vermeld worden dat dit te zien is aan het feit dat er nu geen trapsgewijs verloop meer is. Verder is het juist dat de curve nog niet helemaal binnen het betrouwbaarheidsinterval ligt. Bijgevolg kunnen we dus zeggen dat er nog steeds golfbewegingen aanwezig zijn die we kunnen verklaren en patronen die we kunnen voorspellen. Hier is bijkomend onderzoek voor nodig.

Post a new message
Dataseries X:
2648.9
2669.6
3042.3
2604.2
2732.1
2621.7
2483.7
2479.3
2684.6
2834.7
2566.1
2251.2
2350
2299.8
2542.8
2530.2
2508.1
2616.8
2534.1
2181.8
2578.9
2841.9
2529.9
2103.2
2326.2
2452.6
2782.1
2727.3
2648.2
2760.7
2613
2225.4
2713.9
2923.3
2707
2473.9
2521
2531.8
3068.8
2826.9
2674.2
2966.6
2798.8
2629.6
3124.6
3115.7
3083
2863.9
2728.7
2789.4
3225.7
3148.2
2836.5
3153.5
2656.9
2834.7
3172.5
2998.8
3103.1
2735.6
2818.1
2874.4
3438.5
2949.1
3306.8
3530
3003.8
3206.4
3514.6
3522.6
3525.5
2996.2
3231.1
3030
3541.7
3113.2
3390.8
3424.2
3079.8
3123.4
3317.1
3579.9
3317.9
2668.1
3609.2
3535.2
3644.7
3925.7
3663.2
3905.3
3990
3695.8


Summary of computational transaction
Raw Inputview raw input (R code)
Raw Outputview raw output of R engine
Computing time1 seconds
R Server'George Udny Yule' @ 72.249.76.132

\begin{tabular}{lllllllll}
\hline
Summary of computational transaction \tabularnewline
Raw Input & view raw input (R code)  \tabularnewline
Raw Output & view raw output of R engine  \tabularnewline
Computing time & 1 seconds \tabularnewline
R Server & 'George Udny Yule' @ 72.249.76.132 \tabularnewline
\hline
\end{tabular}
%Source: https://freestatistics.org/blog/index.php?pk=29785&T=0

[TABLE]
[ROW][C]Summary of computational transaction[/C][/ROW]
[ROW][C]Raw Input[/C][C]view raw input (R code) [/C][/ROW]
[ROW][C]Raw Output[/C][C]view raw output of R engine [/C][/ROW]
[ROW][C]Computing time[/C][C]1 seconds[/C][/ROW]
[ROW][C]R Server[/C][C]'George Udny Yule' @ 72.249.76.132[/C][/ROW]
[/TABLE]
Source: https://freestatistics.org/blog/index.php?pk=29785&T=0

Globally Unique Identifier (entire table): ba.freestatistics.org/blog/index.php?pk=29785&T=0

As an alternative you can also use a QR Code:  

The GUIDs for individual cells are displayed in the table below:

Summary of computational transaction
Raw Inputview raw input (R code)
Raw Outputview raw output of R engine
Computing time1 seconds
R Server'George Udny Yule' @ 72.249.76.132


Raw Periodogram
ParameterValue
Box-Cox transformation parameter (lambda)1
Degree of non-seasonal differencing (d)1
Degree of seasonal differencing (D)1
Seasonal Period (s)12
Frequency (Period)Spectrum
0.0125 (80)6904.942229
0.025 (40)2049.565157
0.0375 (26.6667)19837.738555
0.05 (20)37748.436318
0.0625 (16)2069.230138
0.075 (13.3333)910.7753
0.0875 (11.4286)1219.626454
0.1 (10)23952.622586
0.1125 (8.8889)17925.357787
0.125 (8)4274.659268
0.1375 (7.2727)10921.158868
0.15 (6.6667)3346.442445
0.1625 (6.1538)3749.576331
0.175 (5.7143)4214.014693
0.1875 (5.3333)15369.118272
0.2 (5)28443.832963
0.2125 (4.7059)16031.497607
0.225 (4.4444)43866.540988
0.2375 (4.2105)99538.467447
0.25 (4)17202.618183
0.2625 (3.8095)13208.521755
0.275 (3.6364)21587.161292
0.2875 (3.4783)17163.694266
0.3 (3.3333)172779.201773
0.3125 (3.2)84365.075792
0.325 (3.0769)53932.677535
0.3375 (2.963)90672.950321
0.35 (2.8571)388037.887187
0.3625 (2.7586)39119.032137
0.375 (2.6667)7001.567741
0.3875 (2.5806)106017.230036
0.4 (2.5)19682.098373
0.4125 (2.4242)21289.819735
0.425 (2.3529)50547.926431
0.4375 (2.2857)87682.4406
0.45 (2.2222)112849.923164
0.4625 (2.1622)23895.125455
0.475 (2.1053)140500.574941
0.4875 (2.0513)17602.44987
0.5 (2)1968.060796

\begin{tabular}{lllllllll}
\hline
Raw Periodogram \tabularnewline
Parameter & Value \tabularnewline
Box-Cox transformation parameter (lambda) & 1 \tabularnewline
Degree of non-seasonal differencing (d) & 1 \tabularnewline
Degree of seasonal differencing (D) & 1 \tabularnewline
Seasonal Period (s) & 12 \tabularnewline
Frequency (Period) & Spectrum \tabularnewline
0.0125 (80) & 6904.942229 \tabularnewline
0.025 (40) & 2049.565157 \tabularnewline
0.0375 (26.6667) & 19837.738555 \tabularnewline
0.05 (20) & 37748.436318 \tabularnewline
0.0625 (16) & 2069.230138 \tabularnewline
0.075 (13.3333) & 910.7753 \tabularnewline
0.0875 (11.4286) & 1219.626454 \tabularnewline
0.1 (10) & 23952.622586 \tabularnewline
0.1125 (8.8889) & 17925.357787 \tabularnewline
0.125 (8) & 4274.659268 \tabularnewline
0.1375 (7.2727) & 10921.158868 \tabularnewline
0.15 (6.6667) & 3346.442445 \tabularnewline
0.1625 (6.1538) & 3749.576331 \tabularnewline
0.175 (5.7143) & 4214.014693 \tabularnewline
0.1875 (5.3333) & 15369.118272 \tabularnewline
0.2 (5) & 28443.832963 \tabularnewline
0.2125 (4.7059) & 16031.497607 \tabularnewline
0.225 (4.4444) & 43866.540988 \tabularnewline
0.2375 (4.2105) & 99538.467447 \tabularnewline
0.25 (4) & 17202.618183 \tabularnewline
0.2625 (3.8095) & 13208.521755 \tabularnewline
0.275 (3.6364) & 21587.161292 \tabularnewline
0.2875 (3.4783) & 17163.694266 \tabularnewline
0.3 (3.3333) & 172779.201773 \tabularnewline
0.3125 (3.2) & 84365.075792 \tabularnewline
0.325 (3.0769) & 53932.677535 \tabularnewline
0.3375 (2.963) & 90672.950321 \tabularnewline
0.35 (2.8571) & 388037.887187 \tabularnewline
0.3625 (2.7586) & 39119.032137 \tabularnewline
0.375 (2.6667) & 7001.567741 \tabularnewline
0.3875 (2.5806) & 106017.230036 \tabularnewline
0.4 (2.5) & 19682.098373 \tabularnewline
0.4125 (2.4242) & 21289.819735 \tabularnewline
0.425 (2.3529) & 50547.926431 \tabularnewline
0.4375 (2.2857) & 87682.4406 \tabularnewline
0.45 (2.2222) & 112849.923164 \tabularnewline
0.4625 (2.1622) & 23895.125455 \tabularnewline
0.475 (2.1053) & 140500.574941 \tabularnewline
0.4875 (2.0513) & 17602.44987 \tabularnewline
0.5 (2) & 1968.060796 \tabularnewline
\hline
\end{tabular}
%Source: https://freestatistics.org/blog/index.php?pk=29785&T=1

[TABLE]
[ROW][C]Raw Periodogram[/C][/ROW]
[ROW][C]Parameter[/C][C]Value[/C][/ROW]
[ROW][C]Box-Cox transformation parameter (lambda)[/C][C]1[/C][/ROW]
[ROW][C]Degree of non-seasonal differencing (d)[/C][C]1[/C][/ROW]
[ROW][C]Degree of seasonal differencing (D)[/C][C]1[/C][/ROW]
[ROW][C]Seasonal Period (s)[/C][C]12[/C][/ROW]
[ROW][C]Frequency (Period)[/C][C]Spectrum[/C][/ROW]
[ROW][C]0.0125 (80)[/C][C]6904.942229[/C][/ROW]
[ROW][C]0.025 (40)[/C][C]2049.565157[/C][/ROW]
[ROW][C]0.0375 (26.6667)[/C][C]19837.738555[/C][/ROW]
[ROW][C]0.05 (20)[/C][C]37748.436318[/C][/ROW]
[ROW][C]0.0625 (16)[/C][C]2069.230138[/C][/ROW]
[ROW][C]0.075 (13.3333)[/C][C]910.7753[/C][/ROW]
[ROW][C]0.0875 (11.4286)[/C][C]1219.626454[/C][/ROW]
[ROW][C]0.1 (10)[/C][C]23952.622586[/C][/ROW]
[ROW][C]0.1125 (8.8889)[/C][C]17925.357787[/C][/ROW]
[ROW][C]0.125 (8)[/C][C]4274.659268[/C][/ROW]
[ROW][C]0.1375 (7.2727)[/C][C]10921.158868[/C][/ROW]
[ROW][C]0.15 (6.6667)[/C][C]3346.442445[/C][/ROW]
[ROW][C]0.1625 (6.1538)[/C][C]3749.576331[/C][/ROW]
[ROW][C]0.175 (5.7143)[/C][C]4214.014693[/C][/ROW]
[ROW][C]0.1875 (5.3333)[/C][C]15369.118272[/C][/ROW]
[ROW][C]0.2 (5)[/C][C]28443.832963[/C][/ROW]
[ROW][C]0.2125 (4.7059)[/C][C]16031.497607[/C][/ROW]
[ROW][C]0.225 (4.4444)[/C][C]43866.540988[/C][/ROW]
[ROW][C]0.2375 (4.2105)[/C][C]99538.467447[/C][/ROW]
[ROW][C]0.25 (4)[/C][C]17202.618183[/C][/ROW]
[ROW][C]0.2625 (3.8095)[/C][C]13208.521755[/C][/ROW]
[ROW][C]0.275 (3.6364)[/C][C]21587.161292[/C][/ROW]
[ROW][C]0.2875 (3.4783)[/C][C]17163.694266[/C][/ROW]
[ROW][C]0.3 (3.3333)[/C][C]172779.201773[/C][/ROW]
[ROW][C]0.3125 (3.2)[/C][C]84365.075792[/C][/ROW]
[ROW][C]0.325 (3.0769)[/C][C]53932.677535[/C][/ROW]
[ROW][C]0.3375 (2.963)[/C][C]90672.950321[/C][/ROW]
[ROW][C]0.35 (2.8571)[/C][C]388037.887187[/C][/ROW]
[ROW][C]0.3625 (2.7586)[/C][C]39119.032137[/C][/ROW]
[ROW][C]0.375 (2.6667)[/C][C]7001.567741[/C][/ROW]
[ROW][C]0.3875 (2.5806)[/C][C]106017.230036[/C][/ROW]
[ROW][C]0.4 (2.5)[/C][C]19682.098373[/C][/ROW]
[ROW][C]0.4125 (2.4242)[/C][C]21289.819735[/C][/ROW]
[ROW][C]0.425 (2.3529)[/C][C]50547.926431[/C][/ROW]
[ROW][C]0.4375 (2.2857)[/C][C]87682.4406[/C][/ROW]
[ROW][C]0.45 (2.2222)[/C][C]112849.923164[/C][/ROW]
[ROW][C]0.4625 (2.1622)[/C][C]23895.125455[/C][/ROW]
[ROW][C]0.475 (2.1053)[/C][C]140500.574941[/C][/ROW]
[ROW][C]0.4875 (2.0513)[/C][C]17602.44987[/C][/ROW]
[ROW][C]0.5 (2)[/C][C]1968.060796[/C][/ROW]
[/TABLE]
Source: https://freestatistics.org/blog/index.php?pk=29785&T=1

Globally Unique Identifier (entire table): ba.freestatistics.org/blog/index.php?pk=29785&T=1

As an alternative you can also use a QR Code:  

The GUIDs for individual cells are displayed in the table below:

Raw Periodogram
ParameterValue
Box-Cox transformation parameter (lambda)1
Degree of non-seasonal differencing (d)1
Degree of seasonal differencing (D)1
Seasonal Period (s)12
Frequency (Period)Spectrum
0.0125 (80)6904.942229
0.025 (40)2049.565157
0.0375 (26.6667)19837.738555
0.05 (20)37748.436318
0.0625 (16)2069.230138
0.075 (13.3333)910.7753
0.0875 (11.4286)1219.626454
0.1 (10)23952.622586
0.1125 (8.8889)17925.357787
0.125 (8)4274.659268
0.1375 (7.2727)10921.158868
0.15 (6.6667)3346.442445
0.1625 (6.1538)3749.576331
0.175 (5.7143)4214.014693
0.1875 (5.3333)15369.118272
0.2 (5)28443.832963
0.2125 (4.7059)16031.497607
0.225 (4.4444)43866.540988
0.2375 (4.2105)99538.467447
0.25 (4)17202.618183
0.2625 (3.8095)13208.521755
0.275 (3.6364)21587.161292
0.2875 (3.4783)17163.694266
0.3 (3.3333)172779.201773
0.3125 (3.2)84365.075792
0.325 (3.0769)53932.677535
0.3375 (2.963)90672.950321
0.35 (2.8571)388037.887187
0.3625 (2.7586)39119.032137
0.375 (2.6667)7001.567741
0.3875 (2.5806)106017.230036
0.4 (2.5)19682.098373
0.4125 (2.4242)21289.819735
0.425 (2.3529)50547.926431
0.4375 (2.2857)87682.4406
0.45 (2.2222)112849.923164
0.4625 (2.1622)23895.125455
0.475 (2.1053)140500.574941
0.4875 (2.0513)17602.44987
0.5 (2)1968.060796


Parameters (Session):
par1 = 1 ; par2 = 1 ; par3 = 1 ; par4 = 12 ;
Parameters (R input):
par1 = 1 ; par2 = 1 ; par3 = 1 ; par4 = 12 ;
R code (references can be found in the software module):
par1 <- as.numeric(par1)
par2 <- as.numeric(par2)
par3 <- as.numeric(par3)
par4 <- as.numeric(par4)
if (par1 == 0) {
x <- log(x)
} else {
x <- (x ^ par1 - 1) / par1
}
if (par2 > 0) x <- diff(x,lag=1,difference=par2)
if (par3 > 0) x <- diff(x,lag=par4,difference=par3)
bitmap(file='test1.png')
r <- spectrum(x,main='Raw Periodogram')
dev.off()
bitmap(file='test2.png')
cpgram(x,main='Cumulative Periodogram')
dev.off()
load(file='createtable')
a<-table.start()
a<-table.row.start(a)
a<-table.element(a,'Raw Periodogram',2,TRUE)
a<-table.row.end(a)
a<-table.row.start(a)
a<-table.element(a,'Parameter',header=TRUE)
a<-table.element(a,'Value',header=TRUE)
a<-table.row.end(a)
a<-table.row.start(a)
a<-table.element(a,'Box-Cox transformation parameter (lambda)',header=TRUE)
a<-table.element(a,par1)
a<-table.row.end(a)
a<-table.row.start(a)
a<-table.element(a,'Degree of non-seasonal differencing (d)',header=TRUE)
a<-table.element(a,par2)
a<-table.row.end(a)
a<-table.row.start(a)
a<-table.element(a,'Degree of seasonal differencing (D)',header=TRUE)
a<-table.element(a,par3)
a<-table.row.end(a)
a<-table.row.start(a)
a<-table.element(a,'Seasonal Period (s)',header=TRUE)
a<-table.element(a,par4)
a<-table.row.end(a)
a<-table.row.start(a)
a<-table.element(a,'Frequency (Period)',header=TRUE)
a<-table.element(a,'Spectrum',header=TRUE)
a<-table.row.end(a)
for (i in 1:length(r$freq)) {
a<-table.row.start(a)
mylab <- round(r$freq[i],4)
mylab <- paste(mylab,' (',sep='')
mylab <- paste(mylab,round(1/r$freq[i],4),sep='')
mylab <- paste(mylab,')',sep='')
a<-table.element(a,mylab,header=TRUE)
a<-table.element(a,round(r$spec[i],6))
a<-table.row.end(a)
}
a<-table.end(a)
table.save(a,file='mytable.tab')