Free Statistics

of Irreproducible Research!

Author's title

Author*The author of this computation has been verified*
R Software Modulerwasp_autocorrelation.wasp
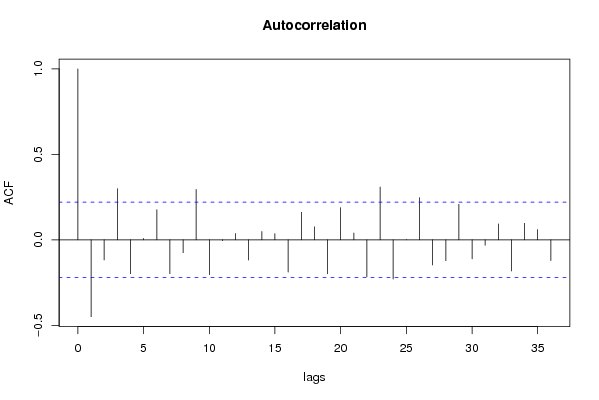
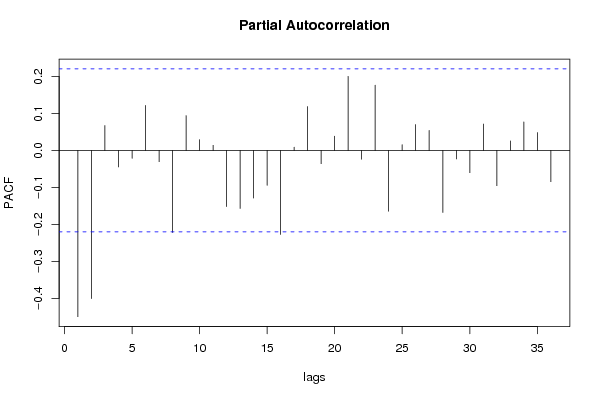
Title produced by software(Partial) Autocorrelation Function
Date of computationSat, 06 Dec 2008 11:22:51 -0700
Cite this page as followsStatistical Computations at FreeStatistics.org, Office for Research Development and Education, URL https://freestatistics.org/blog/index.php?v=date/2008/Dec/06/t1228587810i1c62cpt2g8dhh2.htm/, Retrieved Sat, 18 May 2024 05:51:22 +0000
Statistical Computations at FreeStatistics.org, Office for Research Development and Education, URL https://freestatistics.org/blog/index.php?pk=29794, Retrieved Sat, 18 May 2024 05:51:22 +0000
QR Codes:

Original text written by user:
IsPrivate?No (this computation is public)
User-defined keywords
Estimated Impact202
Family? (F = Feedback message, R = changed R code, M = changed R Module, P = changed Parameters, D = changed Data)
-     [Univariate Data Series] [data set] [2008-12-01 19:54:57] [b98453cac15ba1066b407e146608df68]
F RMP   [Variance Reduction Matrix] [step 2] [2008-12-06 09:12:19] [9f5bfe3b95f9ec3d2ed4c0a560a9648a]
F RMPD    [(Partial) Autocorrelation Function] [step 2] [2008-12-06 18:17:03] [9f5bfe3b95f9ec3d2ed4c0a560a9648a]
F   P         [(Partial) Autocorrelation Function] [step 3] [2008-12-06 18:22:51] [a9e6d7cd6e144e8b311d9f96a24c5a25] [Current]
Feedback Forum
2008-12-13 11:26:44 [Ken Wright] [reply
volledig correct, seizoenaliteit en niet seizoenaliteit zijn volledig verdwenen: het langzaam dalende trend is weg een ook de hangmattenstructuur is weg
2008-12-16 19:11:16 [Kevin Vermeiren] [reply
Het klopt dat de lambda waarde op -0.1 ingesteld moet worden en d=1 en D=1. De student geeft hier een goede conclusie maar wel een zeer beperkte. Er is nu duidelijk geen patroon te herkennen in de autocorrelatie coëfficiënten en alsook niet in de seizoenale autocorrelatie coëfficiënten. Bijgevolg is de transformatie met lambda op -0.5 en de differentiatie met d=1 en D=1 voldoende.

Post a new message
Dataseries X:
2648.9
2669.6
3042.3
2604.2
2732.1
2621.7
2483.7
2479.3
2684.6
2834.7
2566.1
2251.2
2350
2299.8
2542.8
2530.2
2508.1
2616.8
2534.1
2181.8
2578.9
2841.9
2529.9
2103.2
2326.2
2452.6
2782.1
2727.3
2648.2
2760.7
2613
2225.4
2713.9
2923.3
2707
2473.9
2521
2531.8
3068.8
2826.9
2674.2
2966.6
2798.8
2629.6
3124.6
3115.7
3083
2863.9
2728.7
2789.4
3225.7
3148.2
2836.5
3153.5
2656.9
2834.7
3172.5
2998.8
3103.1
2735.6
2818.1
2874.4
3438.5
2949.1
3306.8
3530
3003.8
3206.4
3514.6
3522.6
3525.5
2996.2
3231.1
3030
3541.7
3113.2
3390.8
3424.2
3079.8
3123.4
3317.1
3579.9
3317.9
2668.1
3609.2
3535.2
3644.7
3925.7
3663.2
3905.3
3990
3695.8


Summary of computational transaction
Raw Inputview raw input (R code)
Raw Outputview raw output of R engine
Computing time1 seconds
R Server'Gwilym Jenkins' @ 72.249.127.135

\begin{tabular}{lllllllll}
\hline
Summary of computational transaction \tabularnewline
Raw Input & view raw input (R code)  \tabularnewline
Raw Output & view raw output of R engine  \tabularnewline
Computing time & 1 seconds \tabularnewline
R Server & 'Gwilym Jenkins' @ 72.249.127.135 \tabularnewline
\hline
\end{tabular}
%Source: https://freestatistics.org/blog/index.php?pk=29794&T=0

[TABLE]
[ROW][C]Summary of computational transaction[/C][/ROW]
[ROW][C]Raw Input[/C][C]view raw input (R code) [/C][/ROW]
[ROW][C]Raw Output[/C][C]view raw output of R engine [/C][/ROW]
[ROW][C]Computing time[/C][C]1 seconds[/C][/ROW]
[ROW][C]R Server[/C][C]'Gwilym Jenkins' @ 72.249.127.135[/C][/ROW]
[/TABLE]
Source: https://freestatistics.org/blog/index.php?pk=29794&T=0

Globally Unique Identifier (entire table): ba.freestatistics.org/blog/index.php?pk=29794&T=0

As an alternative you can also use a QR Code:  

The GUIDs for individual cells are displayed in the table below:

Summary of computational transaction
Raw Inputview raw input (R code)
Raw Outputview raw output of R engine
Computing time1 seconds
R Server'Gwilym Jenkins' @ 72.249.127.135


Autocorrelation Function
Time lag kACF(k)T-STATP-value
1-0.449656-3.99667.2e-05
2-0.117433-1.04380.149888
30.2992912.66020.004727
4-0.198313-1.76260.040914
50.0079890.0710.471784
60.1762991.5670.060558
7-0.198396-1.76340.040851
8-0.075577-0.67170.251854
90.2946942.61930.00528
10-0.203844-1.81180.036908
11-0.00504-0.04480.482191
120.0367140.32630.372521
13-0.118145-1.05010.148439
140.0479950.42660.33542
150.0357560.31780.375737
16-0.188857-1.67860.048591
170.1607931.42920.07845
180.0762840.6780.249867
19-0.199247-1.77090.040213
200.1883471.67410.049036
210.0392270.34870.364139
22-0.216762-1.92660.028812
230.3087462.74420.003752
24-0.229651-2.04120.022286
250.0007430.00660.497374
260.2467132.19280.015631
27-0.147259-1.30890.097187
28-0.122509-1.08890.139758
290.2075751.8450.034395
30-0.110852-0.98530.163749
31-0.031765-0.28230.389212
320.092850.82530.205853
33-0.181861-1.61640.054996
340.0966210.85880.196529
350.0602150.53520.297007
36-0.121311-1.07820.142106

\begin{tabular}{lllllllll}
\hline
Autocorrelation Function \tabularnewline
Time lag k & ACF(k) & T-STAT & P-value \tabularnewline
1 & -0.449656 & -3.9966 & 7.2e-05 \tabularnewline
2 & -0.117433 & -1.0438 & 0.149888 \tabularnewline
3 & 0.299291 & 2.6602 & 0.004727 \tabularnewline
4 & -0.198313 & -1.7626 & 0.040914 \tabularnewline
5 & 0.007989 & 0.071 & 0.471784 \tabularnewline
6 & 0.176299 & 1.567 & 0.060558 \tabularnewline
7 & -0.198396 & -1.7634 & 0.040851 \tabularnewline
8 & -0.075577 & -0.6717 & 0.251854 \tabularnewline
9 & 0.294694 & 2.6193 & 0.00528 \tabularnewline
10 & -0.203844 & -1.8118 & 0.036908 \tabularnewline
11 & -0.00504 & -0.0448 & 0.482191 \tabularnewline
12 & 0.036714 & 0.3263 & 0.372521 \tabularnewline
13 & -0.118145 & -1.0501 & 0.148439 \tabularnewline
14 & 0.047995 & 0.4266 & 0.33542 \tabularnewline
15 & 0.035756 & 0.3178 & 0.375737 \tabularnewline
16 & -0.188857 & -1.6786 & 0.048591 \tabularnewline
17 & 0.160793 & 1.4292 & 0.07845 \tabularnewline
18 & 0.076284 & 0.678 & 0.249867 \tabularnewline
19 & -0.199247 & -1.7709 & 0.040213 \tabularnewline
20 & 0.188347 & 1.6741 & 0.049036 \tabularnewline
21 & 0.039227 & 0.3487 & 0.364139 \tabularnewline
22 & -0.216762 & -1.9266 & 0.028812 \tabularnewline
23 & 0.308746 & 2.7442 & 0.003752 \tabularnewline
24 & -0.229651 & -2.0412 & 0.022286 \tabularnewline
25 & 0.000743 & 0.0066 & 0.497374 \tabularnewline
26 & 0.246713 & 2.1928 & 0.015631 \tabularnewline
27 & -0.147259 & -1.3089 & 0.097187 \tabularnewline
28 & -0.122509 & -1.0889 & 0.139758 \tabularnewline
29 & 0.207575 & 1.845 & 0.034395 \tabularnewline
30 & -0.110852 & -0.9853 & 0.163749 \tabularnewline
31 & -0.031765 & -0.2823 & 0.389212 \tabularnewline
32 & 0.09285 & 0.8253 & 0.205853 \tabularnewline
33 & -0.181861 & -1.6164 & 0.054996 \tabularnewline
34 & 0.096621 & 0.8588 & 0.196529 \tabularnewline
35 & 0.060215 & 0.5352 & 0.297007 \tabularnewline
36 & -0.121311 & -1.0782 & 0.142106 \tabularnewline
\hline
\end{tabular}
%Source: https://freestatistics.org/blog/index.php?pk=29794&T=1

[TABLE]
[ROW][C]Autocorrelation Function[/C][/ROW]
[ROW][C]Time lag k[/C][C]ACF(k)[/C][C]T-STAT[/C][C]P-value[/C][/ROW]
[ROW][C]1[/C][C]-0.449656[/C][C]-3.9966[/C][C]7.2e-05[/C][/ROW]
[ROW][C]2[/C][C]-0.117433[/C][C]-1.0438[/C][C]0.149888[/C][/ROW]
[ROW][C]3[/C][C]0.299291[/C][C]2.6602[/C][C]0.004727[/C][/ROW]
[ROW][C]4[/C][C]-0.198313[/C][C]-1.7626[/C][C]0.040914[/C][/ROW]
[ROW][C]5[/C][C]0.007989[/C][C]0.071[/C][C]0.471784[/C][/ROW]
[ROW][C]6[/C][C]0.176299[/C][C]1.567[/C][C]0.060558[/C][/ROW]
[ROW][C]7[/C][C]-0.198396[/C][C]-1.7634[/C][C]0.040851[/C][/ROW]
[ROW][C]8[/C][C]-0.075577[/C][C]-0.6717[/C][C]0.251854[/C][/ROW]
[ROW][C]9[/C][C]0.294694[/C][C]2.6193[/C][C]0.00528[/C][/ROW]
[ROW][C]10[/C][C]-0.203844[/C][C]-1.8118[/C][C]0.036908[/C][/ROW]
[ROW][C]11[/C][C]-0.00504[/C][C]-0.0448[/C][C]0.482191[/C][/ROW]
[ROW][C]12[/C][C]0.036714[/C][C]0.3263[/C][C]0.372521[/C][/ROW]
[ROW][C]13[/C][C]-0.118145[/C][C]-1.0501[/C][C]0.148439[/C][/ROW]
[ROW][C]14[/C][C]0.047995[/C][C]0.4266[/C][C]0.33542[/C][/ROW]
[ROW][C]15[/C][C]0.035756[/C][C]0.3178[/C][C]0.375737[/C][/ROW]
[ROW][C]16[/C][C]-0.188857[/C][C]-1.6786[/C][C]0.048591[/C][/ROW]
[ROW][C]17[/C][C]0.160793[/C][C]1.4292[/C][C]0.07845[/C][/ROW]
[ROW][C]18[/C][C]0.076284[/C][C]0.678[/C][C]0.249867[/C][/ROW]
[ROW][C]19[/C][C]-0.199247[/C][C]-1.7709[/C][C]0.040213[/C][/ROW]
[ROW][C]20[/C][C]0.188347[/C][C]1.6741[/C][C]0.049036[/C][/ROW]
[ROW][C]21[/C][C]0.039227[/C][C]0.3487[/C][C]0.364139[/C][/ROW]
[ROW][C]22[/C][C]-0.216762[/C][C]-1.9266[/C][C]0.028812[/C][/ROW]
[ROW][C]23[/C][C]0.308746[/C][C]2.7442[/C][C]0.003752[/C][/ROW]
[ROW][C]24[/C][C]-0.229651[/C][C]-2.0412[/C][C]0.022286[/C][/ROW]
[ROW][C]25[/C][C]0.000743[/C][C]0.0066[/C][C]0.497374[/C][/ROW]
[ROW][C]26[/C][C]0.246713[/C][C]2.1928[/C][C]0.015631[/C][/ROW]
[ROW][C]27[/C][C]-0.147259[/C][C]-1.3089[/C][C]0.097187[/C][/ROW]
[ROW][C]28[/C][C]-0.122509[/C][C]-1.0889[/C][C]0.139758[/C][/ROW]
[ROW][C]29[/C][C]0.207575[/C][C]1.845[/C][C]0.034395[/C][/ROW]
[ROW][C]30[/C][C]-0.110852[/C][C]-0.9853[/C][C]0.163749[/C][/ROW]
[ROW][C]31[/C][C]-0.031765[/C][C]-0.2823[/C][C]0.389212[/C][/ROW]
[ROW][C]32[/C][C]0.09285[/C][C]0.8253[/C][C]0.205853[/C][/ROW]
[ROW][C]33[/C][C]-0.181861[/C][C]-1.6164[/C][C]0.054996[/C][/ROW]
[ROW][C]34[/C][C]0.096621[/C][C]0.8588[/C][C]0.196529[/C][/ROW]
[ROW][C]35[/C][C]0.060215[/C][C]0.5352[/C][C]0.297007[/C][/ROW]
[ROW][C]36[/C][C]-0.121311[/C][C]-1.0782[/C][C]0.142106[/C][/ROW]
[/TABLE]
Source: https://freestatistics.org/blog/index.php?pk=29794&T=1

Globally Unique Identifier (entire table): ba.freestatistics.org/blog/index.php?pk=29794&T=1

As an alternative you can also use a QR Code:  

The GUIDs for individual cells are displayed in the table below:

Autocorrelation Function
Time lag kACF(k)T-STATP-value
1-0.449656-3.99667.2e-05
2-0.117433-1.04380.149888
30.2992912.66020.004727
4-0.198313-1.76260.040914
50.0079890.0710.471784
60.1762991.5670.060558
7-0.198396-1.76340.040851
8-0.075577-0.67170.251854
90.2946942.61930.00528
10-0.203844-1.81180.036908
11-0.00504-0.04480.482191
120.0367140.32630.372521
13-0.118145-1.05010.148439
140.0479950.42660.33542
150.0357560.31780.375737
16-0.188857-1.67860.048591
170.1607931.42920.07845
180.0762840.6780.249867
19-0.199247-1.77090.040213
200.1883471.67410.049036
210.0392270.34870.364139
22-0.216762-1.92660.028812
230.3087462.74420.003752
24-0.229651-2.04120.022286
250.0007430.00660.497374
260.2467132.19280.015631
27-0.147259-1.30890.097187
28-0.122509-1.08890.139758
290.2075751.8450.034395
30-0.110852-0.98530.163749
31-0.031765-0.28230.389212
320.092850.82530.205853
33-0.181861-1.61640.054996
340.0966210.85880.196529
350.0602150.53520.297007
36-0.121311-1.07820.142106


Partial Autocorrelation Function
Time lag kPACF(k)T-STATP-value
1-0.449656-3.99667.2e-05
2-0.400626-3.56080.000315
30.067470.59970.275216
4-0.044439-0.3950.346961
5-0.021353-0.18980.424981
60.1217611.08220.14122
7-0.030465-0.27080.393633
8-0.221987-1.97310.025993
90.0942350.83760.202397
100.0290950.25860.398309
110.0138340.1230.451227
12-0.151818-1.34940.090534
13-0.156863-1.39420.083579
14-0.128828-1.1450.127823
15-0.094335-0.83850.202149
16-0.227133-2.01880.02345
170.0089060.07920.468553
180.1189041.05680.146903
19-0.035894-0.3190.375271
200.0385850.34290.366274
210.2004311.78150.03934
22-0.023748-0.21110.416686
230.176611.56970.060236
24-0.164434-1.46150.07392
250.0154960.13770.445401
260.0700550.62270.267651
270.0541760.48150.315738
28-0.167703-1.49060.070028
29-0.022933-0.20380.419505
30-0.060265-0.53570.296852
310.0713420.63410.263924
32-0.095222-0.84630.199957
330.0258160.22950.409554
340.0771890.68610.247338
350.0482710.4290.334529
36-0.084375-0.74990.227759

\begin{tabular}{lllllllll}
\hline
Partial Autocorrelation Function \tabularnewline
Time lag k & PACF(k) & T-STAT & P-value \tabularnewline
1 & -0.449656 & -3.9966 & 7.2e-05 \tabularnewline
2 & -0.400626 & -3.5608 & 0.000315 \tabularnewline
3 & 0.06747 & 0.5997 & 0.275216 \tabularnewline
4 & -0.044439 & -0.395 & 0.346961 \tabularnewline
5 & -0.021353 & -0.1898 & 0.424981 \tabularnewline
6 & 0.121761 & 1.0822 & 0.14122 \tabularnewline
7 & -0.030465 & -0.2708 & 0.393633 \tabularnewline
8 & -0.221987 & -1.9731 & 0.025993 \tabularnewline
9 & 0.094235 & 0.8376 & 0.202397 \tabularnewline
10 & 0.029095 & 0.2586 & 0.398309 \tabularnewline
11 & 0.013834 & 0.123 & 0.451227 \tabularnewline
12 & -0.151818 & -1.3494 & 0.090534 \tabularnewline
13 & -0.156863 & -1.3942 & 0.083579 \tabularnewline
14 & -0.128828 & -1.145 & 0.127823 \tabularnewline
15 & -0.094335 & -0.8385 & 0.202149 \tabularnewline
16 & -0.227133 & -2.0188 & 0.02345 \tabularnewline
17 & 0.008906 & 0.0792 & 0.468553 \tabularnewline
18 & 0.118904 & 1.0568 & 0.146903 \tabularnewline
19 & -0.035894 & -0.319 & 0.375271 \tabularnewline
20 & 0.038585 & 0.3429 & 0.366274 \tabularnewline
21 & 0.200431 & 1.7815 & 0.03934 \tabularnewline
22 & -0.023748 & -0.2111 & 0.416686 \tabularnewline
23 & 0.17661 & 1.5697 & 0.060236 \tabularnewline
24 & -0.164434 & -1.4615 & 0.07392 \tabularnewline
25 & 0.015496 & 0.1377 & 0.445401 \tabularnewline
26 & 0.070055 & 0.6227 & 0.267651 \tabularnewline
27 & 0.054176 & 0.4815 & 0.315738 \tabularnewline
28 & -0.167703 & -1.4906 & 0.070028 \tabularnewline
29 & -0.022933 & -0.2038 & 0.419505 \tabularnewline
30 & -0.060265 & -0.5357 & 0.296852 \tabularnewline
31 & 0.071342 & 0.6341 & 0.263924 \tabularnewline
32 & -0.095222 & -0.8463 & 0.199957 \tabularnewline
33 & 0.025816 & 0.2295 & 0.409554 \tabularnewline
34 & 0.077189 & 0.6861 & 0.247338 \tabularnewline
35 & 0.048271 & 0.429 & 0.334529 \tabularnewline
36 & -0.084375 & -0.7499 & 0.227759 \tabularnewline
\hline
\end{tabular}
%Source: https://freestatistics.org/blog/index.php?pk=29794&T=2

[TABLE]
[ROW][C]Partial Autocorrelation Function[/C][/ROW]
[ROW][C]Time lag k[/C][C]PACF(k)[/C][C]T-STAT[/C][C]P-value[/C][/ROW]
[ROW][C]1[/C][C]-0.449656[/C][C]-3.9966[/C][C]7.2e-05[/C][/ROW]
[ROW][C]2[/C][C]-0.400626[/C][C]-3.5608[/C][C]0.000315[/C][/ROW]
[ROW][C]3[/C][C]0.06747[/C][C]0.5997[/C][C]0.275216[/C][/ROW]
[ROW][C]4[/C][C]-0.044439[/C][C]-0.395[/C][C]0.346961[/C][/ROW]
[ROW][C]5[/C][C]-0.021353[/C][C]-0.1898[/C][C]0.424981[/C][/ROW]
[ROW][C]6[/C][C]0.121761[/C][C]1.0822[/C][C]0.14122[/C][/ROW]
[ROW][C]7[/C][C]-0.030465[/C][C]-0.2708[/C][C]0.393633[/C][/ROW]
[ROW][C]8[/C][C]-0.221987[/C][C]-1.9731[/C][C]0.025993[/C][/ROW]
[ROW][C]9[/C][C]0.094235[/C][C]0.8376[/C][C]0.202397[/C][/ROW]
[ROW][C]10[/C][C]0.029095[/C][C]0.2586[/C][C]0.398309[/C][/ROW]
[ROW][C]11[/C][C]0.013834[/C][C]0.123[/C][C]0.451227[/C][/ROW]
[ROW][C]12[/C][C]-0.151818[/C][C]-1.3494[/C][C]0.090534[/C][/ROW]
[ROW][C]13[/C][C]-0.156863[/C][C]-1.3942[/C][C]0.083579[/C][/ROW]
[ROW][C]14[/C][C]-0.128828[/C][C]-1.145[/C][C]0.127823[/C][/ROW]
[ROW][C]15[/C][C]-0.094335[/C][C]-0.8385[/C][C]0.202149[/C][/ROW]
[ROW][C]16[/C][C]-0.227133[/C][C]-2.0188[/C][C]0.02345[/C][/ROW]
[ROW][C]17[/C][C]0.008906[/C][C]0.0792[/C][C]0.468553[/C][/ROW]
[ROW][C]18[/C][C]0.118904[/C][C]1.0568[/C][C]0.146903[/C][/ROW]
[ROW][C]19[/C][C]-0.035894[/C][C]-0.319[/C][C]0.375271[/C][/ROW]
[ROW][C]20[/C][C]0.038585[/C][C]0.3429[/C][C]0.366274[/C][/ROW]
[ROW][C]21[/C][C]0.200431[/C][C]1.7815[/C][C]0.03934[/C][/ROW]
[ROW][C]22[/C][C]-0.023748[/C][C]-0.2111[/C][C]0.416686[/C][/ROW]
[ROW][C]23[/C][C]0.17661[/C][C]1.5697[/C][C]0.060236[/C][/ROW]
[ROW][C]24[/C][C]-0.164434[/C][C]-1.4615[/C][C]0.07392[/C][/ROW]
[ROW][C]25[/C][C]0.015496[/C][C]0.1377[/C][C]0.445401[/C][/ROW]
[ROW][C]26[/C][C]0.070055[/C][C]0.6227[/C][C]0.267651[/C][/ROW]
[ROW][C]27[/C][C]0.054176[/C][C]0.4815[/C][C]0.315738[/C][/ROW]
[ROW][C]28[/C][C]-0.167703[/C][C]-1.4906[/C][C]0.070028[/C][/ROW]
[ROW][C]29[/C][C]-0.022933[/C][C]-0.2038[/C][C]0.419505[/C][/ROW]
[ROW][C]30[/C][C]-0.060265[/C][C]-0.5357[/C][C]0.296852[/C][/ROW]
[ROW][C]31[/C][C]0.071342[/C][C]0.6341[/C][C]0.263924[/C][/ROW]
[ROW][C]32[/C][C]-0.095222[/C][C]-0.8463[/C][C]0.199957[/C][/ROW]
[ROW][C]33[/C][C]0.025816[/C][C]0.2295[/C][C]0.409554[/C][/ROW]
[ROW][C]34[/C][C]0.077189[/C][C]0.6861[/C][C]0.247338[/C][/ROW]
[ROW][C]35[/C][C]0.048271[/C][C]0.429[/C][C]0.334529[/C][/ROW]
[ROW][C]36[/C][C]-0.084375[/C][C]-0.7499[/C][C]0.227759[/C][/ROW]
[/TABLE]
Source: https://freestatistics.org/blog/index.php?pk=29794&T=2

Globally Unique Identifier (entire table): ba.freestatistics.org/blog/index.php?pk=29794&T=2

As an alternative you can also use a QR Code:  

The GUIDs for individual cells are displayed in the table below:

Partial Autocorrelation Function
Time lag kPACF(k)T-STATP-value
1-0.449656-3.99667.2e-05
2-0.400626-3.56080.000315
30.067470.59970.275216
4-0.044439-0.3950.346961
5-0.021353-0.18980.424981
60.1217611.08220.14122
7-0.030465-0.27080.393633
8-0.221987-1.97310.025993
90.0942350.83760.202397
100.0290950.25860.398309
110.0138340.1230.451227
12-0.151818-1.34940.090534
13-0.156863-1.39420.083579
14-0.128828-1.1450.127823
15-0.094335-0.83850.202149
16-0.227133-2.01880.02345
170.0089060.07920.468553
180.1189041.05680.146903
19-0.035894-0.3190.375271
200.0385850.34290.366274
210.2004311.78150.03934
22-0.023748-0.21110.416686
230.176611.56970.060236
24-0.164434-1.46150.07392
250.0154960.13770.445401
260.0700550.62270.267651
270.0541760.48150.315738
28-0.167703-1.49060.070028
29-0.022933-0.20380.419505
30-0.060265-0.53570.296852
310.0713420.63410.263924
32-0.095222-0.84630.199957
330.0258160.22950.409554
340.0771890.68610.247338
350.0482710.4290.334529
36-0.084375-0.74990.227759


Parameters (Session):
par1 = 36 ; par2 = -0.1 ; par3 = 1 ; par4 = 1 ; par5 = 12 ;
Parameters (R input):
par1 = 36 ; par2 = -0.1 ; par3 = 1 ; par4 = 1 ; par5 = 12 ;
R code (references can be found in the software module):
if (par1 == 'Default') {
par1 = 10*log10(length(x))
} else {
par1 <- as.numeric(par1)
}
par2 <- as.numeric(par2)
par3 <- as.numeric(par3)
par4 <- as.numeric(par4)
par5 <- as.numeric(par5)
if (par2 == 0) {
x <- log(x)
} else {
x <- (x ^ par2 - 1) / par2
}
if (par3 > 0) x <- diff(x,lag=1,difference=par3)
if (par4 > 0) x <- diff(x,lag=par5,difference=par4)
bitmap(file='pic1.png')
racf <- acf(x,par1,main='Autocorrelation',xlab='lags',ylab='ACF')
dev.off()
bitmap(file='pic2.png')
rpacf <- pacf(x,par1,main='Partial Autocorrelation',xlab='lags',ylab='PACF')
dev.off()
(myacf <- c(racf$acf))
(mypacf <- c(rpacf$acf))
lengthx <- length(x)
sqrtn <- sqrt(lengthx)
load(file='createtable')
a<-table.start()
a<-table.row.start(a)
a<-table.element(a,'Autocorrelation Function',4,TRUE)
a<-table.row.end(a)
a<-table.row.start(a)
a<-table.element(a,'Time lag k',header=TRUE)
a<-table.element(a,hyperlink('basics.htm','ACF(k)','click here for more information about the Autocorrelation Function'),header=TRUE)
a<-table.element(a,'T-STAT',header=TRUE)
a<-table.element(a,'P-value',header=TRUE)
a<-table.row.end(a)
for (i in 2:(par1+1)) {
a<-table.row.start(a)
a<-table.element(a,i-1,header=TRUE)
a<-table.element(a,round(myacf[i],6))
mytstat <- myacf[i]*sqrtn
a<-table.element(a,round(mytstat,4))
a<-table.element(a,round(1-pt(abs(mytstat),lengthx),6))
a<-table.row.end(a)
}
a<-table.end(a)
table.save(a,file='mytable.tab')
a<-table.start()
a<-table.row.start(a)
a<-table.element(a,'Partial Autocorrelation Function',4,TRUE)
a<-table.row.end(a)
a<-table.row.start(a)
a<-table.element(a,'Time lag k',header=TRUE)
a<-table.element(a,hyperlink('basics.htm','PACF(k)','click here for more information about the Partial Autocorrelation Function'),header=TRUE)
a<-table.element(a,'T-STAT',header=TRUE)
a<-table.element(a,'P-value',header=TRUE)
a<-table.row.end(a)
for (i in 1:par1) {
a<-table.row.start(a)
a<-table.element(a,i,header=TRUE)
a<-table.element(a,round(mypacf[i],6))
mytstat <- mypacf[i]*sqrtn
a<-table.element(a,round(mytstat,4))
a<-table.element(a,round(1-pt(abs(mytstat),lengthx),6))
a<-table.row.end(a)
}
a<-table.end(a)
table.save(a,file='mytable1.tab')