Free Statistics

of Irreproducible Research!

Author's title

Author*The author of this computation has been verified*
R Software Modulerwasp_autocorrelation.wasp
Title produced by software(Partial) Autocorrelation Function
Date of computationSun, 07 Dec 2008 09:15:37 -0700
Cite this page as followsStatistical Computations at FreeStatistics.org, Office for Research Development and Education, URL https://freestatistics.org/blog/index.php?v=date/2008/Dec/07/t122866660001xr9dz78x7xodf.htm/, Retrieved Sat, 18 May 2024 08:57:22 +0000
Statistical Computations at FreeStatistics.org, Office for Research Development and Education, URL https://freestatistics.org/blog/index.php?pk=30136, Retrieved Sat, 18 May 2024 08:57:22 +0000
QR Codes:

Original text written by user:
IsPrivate?No (this computation is public)
User-defined keywords
Estimated Impact175
Family? (F = Feedback message, R = changed R code, M = changed R Module, P = changed Parameters, D = changed Data)
-     [Univariate Data Series] [data set] [2008-12-01 19:54:57] [b98453cac15ba1066b407e146608df68]
F RMPD    [(Partial) Autocorrelation Function] [workshop8, step2,...] [2008-12-07 16:15:37] [a16dfd7e948381d8b6391003c5d09447] [Current]
Feedback Forum
2008-12-15 18:46:26 [Peter Van Doninck] [reply
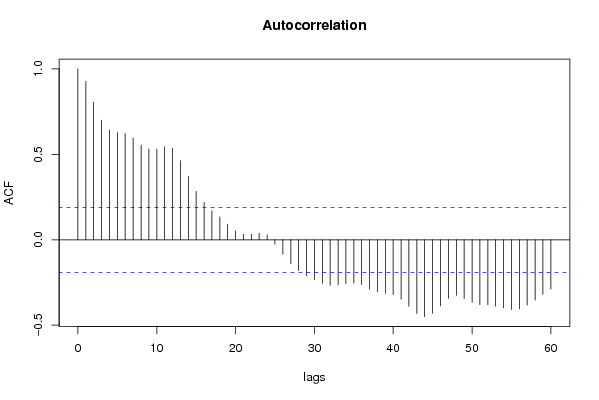
Het klopt dat wanneer er nog niet gedifferentieerd is, dat er een dalend patroon waar te nemen is op lange termijn. Van seizoenaliteit kan er sprake zijn. Het valt op dat de seizoenaliteit eerst positief en significant is, nadien niet significant, en vervolgens negatief en significant. Dit dient verder onderzocht te worden nadat we niet seizoenaal gedifferentieerd hebben.
2008-12-15 19:26:57 [Lana Van Wesemael] [reply
In de autocorrelatiefuncitie merken we inderdaad een dalende lange termijn trend op. Er is ook sprake van seizoenaliteit want zoals de studente aangeeft is er pieken te zien op lag 12. Het zal dus nodig zijn om zowel seizoenaal als gewoon te differentiëren om de tijdreeks stationair te maken.

Post a new message
Dataseries X:
7.5
7.2
6.9
6.7
6.4
6.3
6.8
7.3
7.1
7.1
6.8
6.5
6.3
6.1
6.1
6.3
6.3
6
6.2
6.4
6.8
7.5
7.5
7.6
7.6
7.4
7.3
7.1
6.9
6.8
7.5
7.6
7.8
8
8.1
8.2
8.3
8.2
8
7.9
7.6
7.6
8.2
8.3
8.4
8.4
8.4
8.6
8.9
8.8
8.3
7.5
7.2
7.5
8.8
9.3
9.3
8.7
8.2
8.3
8.5
8.6
8.6
8.2
8.1
8
8.6
8.7
8.8
8.5
8.4
8.5
8.7
8.7
8.6
8.5
8.3
8.1
8.2
8.1
8.1
7.9
7.9
7.9
8
8
7.9
8
7.7
7.2
7.5
7.3
7
7
7
7.2
7.3
7.1
6.8
6.6
6.2
6.2
6.8
6.9
6.8
6.7


Summary of computational transaction
Raw Inputview raw input (R code)
Raw Outputview raw output of R engine
Computing time2 seconds
R Server'Sir Ronald Aylmer Fisher' @ 193.190.124.24

\begin{tabular}{lllllllll}
\hline
Summary of computational transaction \tabularnewline
Raw Input & view raw input (R code)  \tabularnewline
Raw Output & view raw output of R engine  \tabularnewline
Computing time & 2 seconds \tabularnewline
R Server & 'Sir Ronald Aylmer Fisher' @ 193.190.124.24 \tabularnewline
\hline
\end{tabular}
%Source: https://freestatistics.org/blog/index.php?pk=30136&T=0

[TABLE]
[ROW][C]Summary of computational transaction[/C][/ROW]
[ROW][C]Raw Input[/C][C]view raw input (R code) [/C][/ROW]
[ROW][C]Raw Output[/C][C]view raw output of R engine [/C][/ROW]
[ROW][C]Computing time[/C][C]2 seconds[/C][/ROW]
[ROW][C]R Server[/C][C]'Sir Ronald Aylmer Fisher' @ 193.190.124.24[/C][/ROW]
[/TABLE]
Source: https://freestatistics.org/blog/index.php?pk=30136&T=0

Globally Unique Identifier (entire table): ba.freestatistics.org/blog/index.php?pk=30136&T=0

As an alternative you can also use a QR Code:  

The GUIDs for individual cells are displayed in the table below:

Summary of computational transaction
Raw Inputview raw input (R code)
Raw Outputview raw output of R engine
Computing time2 seconds
R Server'Sir Ronald Aylmer Fisher' @ 193.190.124.24


Autocorrelation Function
Time lag kACF(k)T-STATP-value
10.9274189.54840
20.8059198.29740
30.7000097.2070
40.6432556.62270
50.6284556.47030
60.6224456.40850
70.5939916.11550
80.5544085.7080
90.5310965.4680
100.53055.46180
110.5439945.60080
120.535945.51780
130.4628774.76563e-06
140.3706583.81620.000114
150.2831092.91480.002172
160.2177812.24220.013515
170.1692871.74290.042124
180.1333981.37340.086261
190.0910050.93690.175457
200.0519240.53460.297026
210.033110.34090.366933
220.0326430.33610.368738
230.0391160.40270.343981
240.0282540.29090.385849
25-0.025896-0.26660.395141
26-0.085315-0.87840.190864
27-0.140358-1.44510.075694
28-0.180201-1.85530.033167
29-0.210332-2.16550.016296
30-0.234303-2.41230.008785
31-0.254802-2.62330.004995
32-0.266539-2.74420.003563
33-0.263355-2.71140.003909
34-0.256392-2.63970.004775
35-0.253597-2.61090.005169
36-0.261197-2.68920.004161
37-0.289085-2.97630.001807
38-0.303939-3.12920.001132
39-0.312783-3.22030.00085
40-0.320563-3.30040.000658
41-0.347478-3.57750.000262
42-0.38831-3.99795.9e-05
43-0.431158-4.4391.1e-05
44-0.449894-4.63195e-06
45-0.429291-4.41981.2e-05
46-0.387082-3.98536.2e-05
47-0.342954-3.53090.000307
48-0.325132-3.34740.000565
49-0.343605-3.53763e-04
50-0.366447-3.77280.000133
51-0.378797-3.98.5e-05
52-0.379817-3.91058.1e-05
53-0.387563-3.99026.1e-05
54-0.397444-4.09194.2e-05
55-0.40772-4.19772.8e-05
56-0.404121-4.16073.2e-05
57-0.381538-3.92827.6e-05
58-0.352736-3.63160.000218
59-0.318396-3.27810.000707
60-0.28808-2.9660.001864

\begin{tabular}{lllllllll}
\hline
Autocorrelation Function \tabularnewline
Time lag k & ACF(k) & T-STAT & P-value \tabularnewline
1 & 0.927418 & 9.5484 & 0 \tabularnewline
2 & 0.805919 & 8.2974 & 0 \tabularnewline
3 & 0.700009 & 7.207 & 0 \tabularnewline
4 & 0.643255 & 6.6227 & 0 \tabularnewline
5 & 0.628455 & 6.4703 & 0 \tabularnewline
6 & 0.622445 & 6.4085 & 0 \tabularnewline
7 & 0.593991 & 6.1155 & 0 \tabularnewline
8 & 0.554408 & 5.708 & 0 \tabularnewline
9 & 0.531096 & 5.468 & 0 \tabularnewline
10 & 0.5305 & 5.4618 & 0 \tabularnewline
11 & 0.543994 & 5.6008 & 0 \tabularnewline
12 & 0.53594 & 5.5178 & 0 \tabularnewline
13 & 0.462877 & 4.7656 & 3e-06 \tabularnewline
14 & 0.370658 & 3.8162 & 0.000114 \tabularnewline
15 & 0.283109 & 2.9148 & 0.002172 \tabularnewline
16 & 0.217781 & 2.2422 & 0.013515 \tabularnewline
17 & 0.169287 & 1.7429 & 0.042124 \tabularnewline
18 & 0.133398 & 1.3734 & 0.086261 \tabularnewline
19 & 0.091005 & 0.9369 & 0.175457 \tabularnewline
20 & 0.051924 & 0.5346 & 0.297026 \tabularnewline
21 & 0.03311 & 0.3409 & 0.366933 \tabularnewline
22 & 0.032643 & 0.3361 & 0.368738 \tabularnewline
23 & 0.039116 & 0.4027 & 0.343981 \tabularnewline
24 & 0.028254 & 0.2909 & 0.385849 \tabularnewline
25 & -0.025896 & -0.2666 & 0.395141 \tabularnewline
26 & -0.085315 & -0.8784 & 0.190864 \tabularnewline
27 & -0.140358 & -1.4451 & 0.075694 \tabularnewline
28 & -0.180201 & -1.8553 & 0.033167 \tabularnewline
29 & -0.210332 & -2.1655 & 0.016296 \tabularnewline
30 & -0.234303 & -2.4123 & 0.008785 \tabularnewline
31 & -0.254802 & -2.6233 & 0.004995 \tabularnewline
32 & -0.266539 & -2.7442 & 0.003563 \tabularnewline
33 & -0.263355 & -2.7114 & 0.003909 \tabularnewline
34 & -0.256392 & -2.6397 & 0.004775 \tabularnewline
35 & -0.253597 & -2.6109 & 0.005169 \tabularnewline
36 & -0.261197 & -2.6892 & 0.004161 \tabularnewline
37 & -0.289085 & -2.9763 & 0.001807 \tabularnewline
38 & -0.303939 & -3.1292 & 0.001132 \tabularnewline
39 & -0.312783 & -3.2203 & 0.00085 \tabularnewline
40 & -0.320563 & -3.3004 & 0.000658 \tabularnewline
41 & -0.347478 & -3.5775 & 0.000262 \tabularnewline
42 & -0.38831 & -3.9979 & 5.9e-05 \tabularnewline
43 & -0.431158 & -4.439 & 1.1e-05 \tabularnewline
44 & -0.449894 & -4.6319 & 5e-06 \tabularnewline
45 & -0.429291 & -4.4198 & 1.2e-05 \tabularnewline
46 & -0.387082 & -3.9853 & 6.2e-05 \tabularnewline
47 & -0.342954 & -3.5309 & 0.000307 \tabularnewline
48 & -0.325132 & -3.3474 & 0.000565 \tabularnewline
49 & -0.343605 & -3.5376 & 3e-04 \tabularnewline
50 & -0.366447 & -3.7728 & 0.000133 \tabularnewline
51 & -0.378797 & -3.9 & 8.5e-05 \tabularnewline
52 & -0.379817 & -3.9105 & 8.1e-05 \tabularnewline
53 & -0.387563 & -3.9902 & 6.1e-05 \tabularnewline
54 & -0.397444 & -4.0919 & 4.2e-05 \tabularnewline
55 & -0.40772 & -4.1977 & 2.8e-05 \tabularnewline
56 & -0.404121 & -4.1607 & 3.2e-05 \tabularnewline
57 & -0.381538 & -3.9282 & 7.6e-05 \tabularnewline
58 & -0.352736 & -3.6316 & 0.000218 \tabularnewline
59 & -0.318396 & -3.2781 & 0.000707 \tabularnewline
60 & -0.28808 & -2.966 & 0.001864 \tabularnewline
\hline
\end{tabular}
%Source: https://freestatistics.org/blog/index.php?pk=30136&T=1

[TABLE]
[ROW][C]Autocorrelation Function[/C][/ROW]
[ROW][C]Time lag k[/C][C]ACF(k)[/C][C]T-STAT[/C][C]P-value[/C][/ROW]
[ROW][C]1[/C][C]0.927418[/C][C]9.5484[/C][C]0[/C][/ROW]
[ROW][C]2[/C][C]0.805919[/C][C]8.2974[/C][C]0[/C][/ROW]
[ROW][C]3[/C][C]0.700009[/C][C]7.207[/C][C]0[/C][/ROW]
[ROW][C]4[/C][C]0.643255[/C][C]6.6227[/C][C]0[/C][/ROW]
[ROW][C]5[/C][C]0.628455[/C][C]6.4703[/C][C]0[/C][/ROW]
[ROW][C]6[/C][C]0.622445[/C][C]6.4085[/C][C]0[/C][/ROW]
[ROW][C]7[/C][C]0.593991[/C][C]6.1155[/C][C]0[/C][/ROW]
[ROW][C]8[/C][C]0.554408[/C][C]5.708[/C][C]0[/C][/ROW]
[ROW][C]9[/C][C]0.531096[/C][C]5.468[/C][C]0[/C][/ROW]
[ROW][C]10[/C][C]0.5305[/C][C]5.4618[/C][C]0[/C][/ROW]
[ROW][C]11[/C][C]0.543994[/C][C]5.6008[/C][C]0[/C][/ROW]
[ROW][C]12[/C][C]0.53594[/C][C]5.5178[/C][C]0[/C][/ROW]
[ROW][C]13[/C][C]0.462877[/C][C]4.7656[/C][C]3e-06[/C][/ROW]
[ROW][C]14[/C][C]0.370658[/C][C]3.8162[/C][C]0.000114[/C][/ROW]
[ROW][C]15[/C][C]0.283109[/C][C]2.9148[/C][C]0.002172[/C][/ROW]
[ROW][C]16[/C][C]0.217781[/C][C]2.2422[/C][C]0.013515[/C][/ROW]
[ROW][C]17[/C][C]0.169287[/C][C]1.7429[/C][C]0.042124[/C][/ROW]
[ROW][C]18[/C][C]0.133398[/C][C]1.3734[/C][C]0.086261[/C][/ROW]
[ROW][C]19[/C][C]0.091005[/C][C]0.9369[/C][C]0.175457[/C][/ROW]
[ROW][C]20[/C][C]0.051924[/C][C]0.5346[/C][C]0.297026[/C][/ROW]
[ROW][C]21[/C][C]0.03311[/C][C]0.3409[/C][C]0.366933[/C][/ROW]
[ROW][C]22[/C][C]0.032643[/C][C]0.3361[/C][C]0.368738[/C][/ROW]
[ROW][C]23[/C][C]0.039116[/C][C]0.4027[/C][C]0.343981[/C][/ROW]
[ROW][C]24[/C][C]0.028254[/C][C]0.2909[/C][C]0.385849[/C][/ROW]
[ROW][C]25[/C][C]-0.025896[/C][C]-0.2666[/C][C]0.395141[/C][/ROW]
[ROW][C]26[/C][C]-0.085315[/C][C]-0.8784[/C][C]0.190864[/C][/ROW]
[ROW][C]27[/C][C]-0.140358[/C][C]-1.4451[/C][C]0.075694[/C][/ROW]
[ROW][C]28[/C][C]-0.180201[/C][C]-1.8553[/C][C]0.033167[/C][/ROW]
[ROW][C]29[/C][C]-0.210332[/C][C]-2.1655[/C][C]0.016296[/C][/ROW]
[ROW][C]30[/C][C]-0.234303[/C][C]-2.4123[/C][C]0.008785[/C][/ROW]
[ROW][C]31[/C][C]-0.254802[/C][C]-2.6233[/C][C]0.004995[/C][/ROW]
[ROW][C]32[/C][C]-0.266539[/C][C]-2.7442[/C][C]0.003563[/C][/ROW]
[ROW][C]33[/C][C]-0.263355[/C][C]-2.7114[/C][C]0.003909[/C][/ROW]
[ROW][C]34[/C][C]-0.256392[/C][C]-2.6397[/C][C]0.004775[/C][/ROW]
[ROW][C]35[/C][C]-0.253597[/C][C]-2.6109[/C][C]0.005169[/C][/ROW]
[ROW][C]36[/C][C]-0.261197[/C][C]-2.6892[/C][C]0.004161[/C][/ROW]
[ROW][C]37[/C][C]-0.289085[/C][C]-2.9763[/C][C]0.001807[/C][/ROW]
[ROW][C]38[/C][C]-0.303939[/C][C]-3.1292[/C][C]0.001132[/C][/ROW]
[ROW][C]39[/C][C]-0.312783[/C][C]-3.2203[/C][C]0.00085[/C][/ROW]
[ROW][C]40[/C][C]-0.320563[/C][C]-3.3004[/C][C]0.000658[/C][/ROW]
[ROW][C]41[/C][C]-0.347478[/C][C]-3.5775[/C][C]0.000262[/C][/ROW]
[ROW][C]42[/C][C]-0.38831[/C][C]-3.9979[/C][C]5.9e-05[/C][/ROW]
[ROW][C]43[/C][C]-0.431158[/C][C]-4.439[/C][C]1.1e-05[/C][/ROW]
[ROW][C]44[/C][C]-0.449894[/C][C]-4.6319[/C][C]5e-06[/C][/ROW]
[ROW][C]45[/C][C]-0.429291[/C][C]-4.4198[/C][C]1.2e-05[/C][/ROW]
[ROW][C]46[/C][C]-0.387082[/C][C]-3.9853[/C][C]6.2e-05[/C][/ROW]
[ROW][C]47[/C][C]-0.342954[/C][C]-3.5309[/C][C]0.000307[/C][/ROW]
[ROW][C]48[/C][C]-0.325132[/C][C]-3.3474[/C][C]0.000565[/C][/ROW]
[ROW][C]49[/C][C]-0.343605[/C][C]-3.5376[/C][C]3e-04[/C][/ROW]
[ROW][C]50[/C][C]-0.366447[/C][C]-3.7728[/C][C]0.000133[/C][/ROW]
[ROW][C]51[/C][C]-0.378797[/C][C]-3.9[/C][C]8.5e-05[/C][/ROW]
[ROW][C]52[/C][C]-0.379817[/C][C]-3.9105[/C][C]8.1e-05[/C][/ROW]
[ROW][C]53[/C][C]-0.387563[/C][C]-3.9902[/C][C]6.1e-05[/C][/ROW]
[ROW][C]54[/C][C]-0.397444[/C][C]-4.0919[/C][C]4.2e-05[/C][/ROW]
[ROW][C]55[/C][C]-0.40772[/C][C]-4.1977[/C][C]2.8e-05[/C][/ROW]
[ROW][C]56[/C][C]-0.404121[/C][C]-4.1607[/C][C]3.2e-05[/C][/ROW]
[ROW][C]57[/C][C]-0.381538[/C][C]-3.9282[/C][C]7.6e-05[/C][/ROW]
[ROW][C]58[/C][C]-0.352736[/C][C]-3.6316[/C][C]0.000218[/C][/ROW]
[ROW][C]59[/C][C]-0.318396[/C][C]-3.2781[/C][C]0.000707[/C][/ROW]
[ROW][C]60[/C][C]-0.28808[/C][C]-2.966[/C][C]0.001864[/C][/ROW]
[/TABLE]
Source: https://freestatistics.org/blog/index.php?pk=30136&T=1

Globally Unique Identifier (entire table): ba.freestatistics.org/blog/index.php?pk=30136&T=1

As an alternative you can also use a QR Code:  

The GUIDs for individual cells are displayed in the table below:

Autocorrelation Function
Time lag kACF(k)T-STATP-value
10.9274189.54840
20.8059198.29740
30.7000097.2070
40.6432556.62270
50.6284556.47030
60.6224456.40850
70.5939916.11550
80.5544085.7080
90.5310965.4680
100.53055.46180
110.5439945.60080
120.535945.51780
130.4628774.76563e-06
140.3706583.81620.000114
150.2831092.91480.002172
160.2177812.24220.013515
170.1692871.74290.042124
180.1333981.37340.086261
190.0910050.93690.175457
200.0519240.53460.297026
210.033110.34090.366933
220.0326430.33610.368738
230.0391160.40270.343981
240.0282540.29090.385849
25-0.025896-0.26660.395141
26-0.085315-0.87840.190864
27-0.140358-1.44510.075694
28-0.180201-1.85530.033167
29-0.210332-2.16550.016296
30-0.234303-2.41230.008785
31-0.254802-2.62330.004995
32-0.266539-2.74420.003563
33-0.263355-2.71140.003909
34-0.256392-2.63970.004775
35-0.253597-2.61090.005169
36-0.261197-2.68920.004161
37-0.289085-2.97630.001807
38-0.303939-3.12920.001132
39-0.312783-3.22030.00085
40-0.320563-3.30040.000658
41-0.347478-3.57750.000262
42-0.38831-3.99795.9e-05
43-0.431158-4.4391.1e-05
44-0.449894-4.63195e-06
45-0.429291-4.41981.2e-05
46-0.387082-3.98536.2e-05
47-0.342954-3.53090.000307
48-0.325132-3.34740.000565
49-0.343605-3.53763e-04
50-0.366447-3.77280.000133
51-0.378797-3.98.5e-05
52-0.379817-3.91058.1e-05
53-0.387563-3.99026.1e-05
54-0.397444-4.09194.2e-05
55-0.40772-4.19772.8e-05
56-0.404121-4.16073.2e-05
57-0.381538-3.92827.6e-05
58-0.352736-3.63160.000218
59-0.318396-3.27810.000707
60-0.28808-2.9660.001864


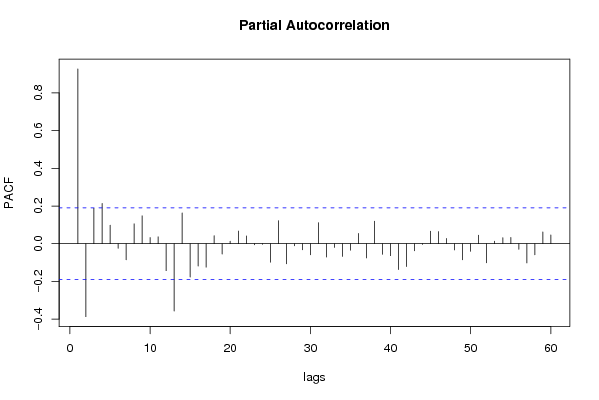
Partial Autocorrelation Function
Time lag kPACF(k)T-STATP-value
10.9274189.54840
2-0.387331-3.98786.1e-05
30.1875531.9310.028078
40.2130462.19340.01523
50.0981291.01030.157325
6-0.024789-0.25520.399526
7-0.08559-0.88120.190101
80.1054221.08540.140108
90.1475961.51960.065795
100.032230.33180.370339
110.0363750.37450.354388
12-0.143104-1.47330.071811
13-0.357446-3.68010.000184
140.1626181.67430.048515
15-0.176873-1.8210.035713
16-0.118636-1.22140.112316
17-0.124486-1.28170.101379
180.0427090.43970.330518
19-0.054972-0.5660.286304
200.0126580.13030.448277
210.0667550.68730.246702
220.0404240.41620.339057
23-0.006124-0.06310.474921
24-0.002838-0.02920.488371
25-0.098121-1.01020.157347
260.1217931.25390.106311
27-0.107154-1.10320.136214
28-0.011377-0.11710.453489
29-0.03212-0.33070.370762
30-0.058687-0.60420.273493
310.1112271.14520.127363
32-0.070582-0.72670.23451
33-0.01967-0.20250.41995
34-0.067592-0.69590.244007
35-0.034484-0.3550.361635
360.0537770.55370.290487
37-0.075545-0.77780.219215
380.1191991.22720.111228
39-0.0561-0.57760.282385
40-0.063461-0.65340.257466
41-0.136939-1.40990.080753
42-0.121769-1.25370.106357
43-0.03766-0.38770.349494
44-0.003789-0.0390.484479
450.0662350.68190.248386
460.0642230.66120.254954
470.0275060.28320.38879
48-0.033094-0.34070.366994
49-0.085338-0.87860.190801
50-0.03993-0.41110.340913
510.0450450.46380.321883
52-0.101037-1.04020.150298
530.0131450.13530.4463
540.0314070.32340.373531
550.032910.33880.367704
56-0.029775-0.30650.379894
57-0.101987-1.050.148049
58-0.059119-0.60870.272025
590.0625110.64360.260614
600.0464720.47850.316654

\begin{tabular}{lllllllll}
\hline
Partial Autocorrelation Function \tabularnewline
Time lag k & PACF(k) & T-STAT & P-value \tabularnewline
1 & 0.927418 & 9.5484 & 0 \tabularnewline
2 & -0.387331 & -3.9878 & 6.1e-05 \tabularnewline
3 & 0.187553 & 1.931 & 0.028078 \tabularnewline
4 & 0.213046 & 2.1934 & 0.01523 \tabularnewline
5 & 0.098129 & 1.0103 & 0.157325 \tabularnewline
6 & -0.024789 & -0.2552 & 0.399526 \tabularnewline
7 & -0.08559 & -0.8812 & 0.190101 \tabularnewline
8 & 0.105422 & 1.0854 & 0.140108 \tabularnewline
9 & 0.147596 & 1.5196 & 0.065795 \tabularnewline
10 & 0.03223 & 0.3318 & 0.370339 \tabularnewline
11 & 0.036375 & 0.3745 & 0.354388 \tabularnewline
12 & -0.143104 & -1.4733 & 0.071811 \tabularnewline
13 & -0.357446 & -3.6801 & 0.000184 \tabularnewline
14 & 0.162618 & 1.6743 & 0.048515 \tabularnewline
15 & -0.176873 & -1.821 & 0.035713 \tabularnewline
16 & -0.118636 & -1.2214 & 0.112316 \tabularnewline
17 & -0.124486 & -1.2817 & 0.101379 \tabularnewline
18 & 0.042709 & 0.4397 & 0.330518 \tabularnewline
19 & -0.054972 & -0.566 & 0.286304 \tabularnewline
20 & 0.012658 & 0.1303 & 0.448277 \tabularnewline
21 & 0.066755 & 0.6873 & 0.246702 \tabularnewline
22 & 0.040424 & 0.4162 & 0.339057 \tabularnewline
23 & -0.006124 & -0.0631 & 0.474921 \tabularnewline
24 & -0.002838 & -0.0292 & 0.488371 \tabularnewline
25 & -0.098121 & -1.0102 & 0.157347 \tabularnewline
26 & 0.121793 & 1.2539 & 0.106311 \tabularnewline
27 & -0.107154 & -1.1032 & 0.136214 \tabularnewline
28 & -0.011377 & -0.1171 & 0.453489 \tabularnewline
29 & -0.03212 & -0.3307 & 0.370762 \tabularnewline
30 & -0.058687 & -0.6042 & 0.273493 \tabularnewline
31 & 0.111227 & 1.1452 & 0.127363 \tabularnewline
32 & -0.070582 & -0.7267 & 0.23451 \tabularnewline
33 & -0.01967 & -0.2025 & 0.41995 \tabularnewline
34 & -0.067592 & -0.6959 & 0.244007 \tabularnewline
35 & -0.034484 & -0.355 & 0.361635 \tabularnewline
36 & 0.053777 & 0.5537 & 0.290487 \tabularnewline
37 & -0.075545 & -0.7778 & 0.219215 \tabularnewline
38 & 0.119199 & 1.2272 & 0.111228 \tabularnewline
39 & -0.0561 & -0.5776 & 0.282385 \tabularnewline
40 & -0.063461 & -0.6534 & 0.257466 \tabularnewline
41 & -0.136939 & -1.4099 & 0.080753 \tabularnewline
42 & -0.121769 & -1.2537 & 0.106357 \tabularnewline
43 & -0.03766 & -0.3877 & 0.349494 \tabularnewline
44 & -0.003789 & -0.039 & 0.484479 \tabularnewline
45 & 0.066235 & 0.6819 & 0.248386 \tabularnewline
46 & 0.064223 & 0.6612 & 0.254954 \tabularnewline
47 & 0.027506 & 0.2832 & 0.38879 \tabularnewline
48 & -0.033094 & -0.3407 & 0.366994 \tabularnewline
49 & -0.085338 & -0.8786 & 0.190801 \tabularnewline
50 & -0.03993 & -0.4111 & 0.340913 \tabularnewline
51 & 0.045045 & 0.4638 & 0.321883 \tabularnewline
52 & -0.101037 & -1.0402 & 0.150298 \tabularnewline
53 & 0.013145 & 0.1353 & 0.4463 \tabularnewline
54 & 0.031407 & 0.3234 & 0.373531 \tabularnewline
55 & 0.03291 & 0.3388 & 0.367704 \tabularnewline
56 & -0.029775 & -0.3065 & 0.379894 \tabularnewline
57 & -0.101987 & -1.05 & 0.148049 \tabularnewline
58 & -0.059119 & -0.6087 & 0.272025 \tabularnewline
59 & 0.062511 & 0.6436 & 0.260614 \tabularnewline
60 & 0.046472 & 0.4785 & 0.316654 \tabularnewline
\hline
\end{tabular}
%Source: https://freestatistics.org/blog/index.php?pk=30136&T=2

[TABLE]
[ROW][C]Partial Autocorrelation Function[/C][/ROW]
[ROW][C]Time lag k[/C][C]PACF(k)[/C][C]T-STAT[/C][C]P-value[/C][/ROW]
[ROW][C]1[/C][C]0.927418[/C][C]9.5484[/C][C]0[/C][/ROW]
[ROW][C]2[/C][C]-0.387331[/C][C]-3.9878[/C][C]6.1e-05[/C][/ROW]
[ROW][C]3[/C][C]0.187553[/C][C]1.931[/C][C]0.028078[/C][/ROW]
[ROW][C]4[/C][C]0.213046[/C][C]2.1934[/C][C]0.01523[/C][/ROW]
[ROW][C]5[/C][C]0.098129[/C][C]1.0103[/C][C]0.157325[/C][/ROW]
[ROW][C]6[/C][C]-0.024789[/C][C]-0.2552[/C][C]0.399526[/C][/ROW]
[ROW][C]7[/C][C]-0.08559[/C][C]-0.8812[/C][C]0.190101[/C][/ROW]
[ROW][C]8[/C][C]0.105422[/C][C]1.0854[/C][C]0.140108[/C][/ROW]
[ROW][C]9[/C][C]0.147596[/C][C]1.5196[/C][C]0.065795[/C][/ROW]
[ROW][C]10[/C][C]0.03223[/C][C]0.3318[/C][C]0.370339[/C][/ROW]
[ROW][C]11[/C][C]0.036375[/C][C]0.3745[/C][C]0.354388[/C][/ROW]
[ROW][C]12[/C][C]-0.143104[/C][C]-1.4733[/C][C]0.071811[/C][/ROW]
[ROW][C]13[/C][C]-0.357446[/C][C]-3.6801[/C][C]0.000184[/C][/ROW]
[ROW][C]14[/C][C]0.162618[/C][C]1.6743[/C][C]0.048515[/C][/ROW]
[ROW][C]15[/C][C]-0.176873[/C][C]-1.821[/C][C]0.035713[/C][/ROW]
[ROW][C]16[/C][C]-0.118636[/C][C]-1.2214[/C][C]0.112316[/C][/ROW]
[ROW][C]17[/C][C]-0.124486[/C][C]-1.2817[/C][C]0.101379[/C][/ROW]
[ROW][C]18[/C][C]0.042709[/C][C]0.4397[/C][C]0.330518[/C][/ROW]
[ROW][C]19[/C][C]-0.054972[/C][C]-0.566[/C][C]0.286304[/C][/ROW]
[ROW][C]20[/C][C]0.012658[/C][C]0.1303[/C][C]0.448277[/C][/ROW]
[ROW][C]21[/C][C]0.066755[/C][C]0.6873[/C][C]0.246702[/C][/ROW]
[ROW][C]22[/C][C]0.040424[/C][C]0.4162[/C][C]0.339057[/C][/ROW]
[ROW][C]23[/C][C]-0.006124[/C][C]-0.0631[/C][C]0.474921[/C][/ROW]
[ROW][C]24[/C][C]-0.002838[/C][C]-0.0292[/C][C]0.488371[/C][/ROW]
[ROW][C]25[/C][C]-0.098121[/C][C]-1.0102[/C][C]0.157347[/C][/ROW]
[ROW][C]26[/C][C]0.121793[/C][C]1.2539[/C][C]0.106311[/C][/ROW]
[ROW][C]27[/C][C]-0.107154[/C][C]-1.1032[/C][C]0.136214[/C][/ROW]
[ROW][C]28[/C][C]-0.011377[/C][C]-0.1171[/C][C]0.453489[/C][/ROW]
[ROW][C]29[/C][C]-0.03212[/C][C]-0.3307[/C][C]0.370762[/C][/ROW]
[ROW][C]30[/C][C]-0.058687[/C][C]-0.6042[/C][C]0.273493[/C][/ROW]
[ROW][C]31[/C][C]0.111227[/C][C]1.1452[/C][C]0.127363[/C][/ROW]
[ROW][C]32[/C][C]-0.070582[/C][C]-0.7267[/C][C]0.23451[/C][/ROW]
[ROW][C]33[/C][C]-0.01967[/C][C]-0.2025[/C][C]0.41995[/C][/ROW]
[ROW][C]34[/C][C]-0.067592[/C][C]-0.6959[/C][C]0.244007[/C][/ROW]
[ROW][C]35[/C][C]-0.034484[/C][C]-0.355[/C][C]0.361635[/C][/ROW]
[ROW][C]36[/C][C]0.053777[/C][C]0.5537[/C][C]0.290487[/C][/ROW]
[ROW][C]37[/C][C]-0.075545[/C][C]-0.7778[/C][C]0.219215[/C][/ROW]
[ROW][C]38[/C][C]0.119199[/C][C]1.2272[/C][C]0.111228[/C][/ROW]
[ROW][C]39[/C][C]-0.0561[/C][C]-0.5776[/C][C]0.282385[/C][/ROW]
[ROW][C]40[/C][C]-0.063461[/C][C]-0.6534[/C][C]0.257466[/C][/ROW]
[ROW][C]41[/C][C]-0.136939[/C][C]-1.4099[/C][C]0.080753[/C][/ROW]
[ROW][C]42[/C][C]-0.121769[/C][C]-1.2537[/C][C]0.106357[/C][/ROW]
[ROW][C]43[/C][C]-0.03766[/C][C]-0.3877[/C][C]0.349494[/C][/ROW]
[ROW][C]44[/C][C]-0.003789[/C][C]-0.039[/C][C]0.484479[/C][/ROW]
[ROW][C]45[/C][C]0.066235[/C][C]0.6819[/C][C]0.248386[/C][/ROW]
[ROW][C]46[/C][C]0.064223[/C][C]0.6612[/C][C]0.254954[/C][/ROW]
[ROW][C]47[/C][C]0.027506[/C][C]0.2832[/C][C]0.38879[/C][/ROW]
[ROW][C]48[/C][C]-0.033094[/C][C]-0.3407[/C][C]0.366994[/C][/ROW]
[ROW][C]49[/C][C]-0.085338[/C][C]-0.8786[/C][C]0.190801[/C][/ROW]
[ROW][C]50[/C][C]-0.03993[/C][C]-0.4111[/C][C]0.340913[/C][/ROW]
[ROW][C]51[/C][C]0.045045[/C][C]0.4638[/C][C]0.321883[/C][/ROW]
[ROW][C]52[/C][C]-0.101037[/C][C]-1.0402[/C][C]0.150298[/C][/ROW]
[ROW][C]53[/C][C]0.013145[/C][C]0.1353[/C][C]0.4463[/C][/ROW]
[ROW][C]54[/C][C]0.031407[/C][C]0.3234[/C][C]0.373531[/C][/ROW]
[ROW][C]55[/C][C]0.03291[/C][C]0.3388[/C][C]0.367704[/C][/ROW]
[ROW][C]56[/C][C]-0.029775[/C][C]-0.3065[/C][C]0.379894[/C][/ROW]
[ROW][C]57[/C][C]-0.101987[/C][C]-1.05[/C][C]0.148049[/C][/ROW]
[ROW][C]58[/C][C]-0.059119[/C][C]-0.6087[/C][C]0.272025[/C][/ROW]
[ROW][C]59[/C][C]0.062511[/C][C]0.6436[/C][C]0.260614[/C][/ROW]
[ROW][C]60[/C][C]0.046472[/C][C]0.4785[/C][C]0.316654[/C][/ROW]
[/TABLE]
Source: https://freestatistics.org/blog/index.php?pk=30136&T=2

Globally Unique Identifier (entire table): ba.freestatistics.org/blog/index.php?pk=30136&T=2

As an alternative you can also use a QR Code:  

The GUIDs for individual cells are displayed in the table below:

Partial Autocorrelation Function
Time lag kPACF(k)T-STATP-value
10.9274189.54840
2-0.387331-3.98786.1e-05
30.1875531.9310.028078
40.2130462.19340.01523
50.0981291.01030.157325
6-0.024789-0.25520.399526
7-0.08559-0.88120.190101
80.1054221.08540.140108
90.1475961.51960.065795
100.032230.33180.370339
110.0363750.37450.354388
12-0.143104-1.47330.071811
13-0.357446-3.68010.000184
140.1626181.67430.048515
15-0.176873-1.8210.035713
16-0.118636-1.22140.112316
17-0.124486-1.28170.101379
180.0427090.43970.330518
19-0.054972-0.5660.286304
200.0126580.13030.448277
210.0667550.68730.246702
220.0404240.41620.339057
23-0.006124-0.06310.474921
24-0.002838-0.02920.488371
25-0.098121-1.01020.157347
260.1217931.25390.106311
27-0.107154-1.10320.136214
28-0.011377-0.11710.453489
29-0.03212-0.33070.370762
30-0.058687-0.60420.273493
310.1112271.14520.127363
32-0.070582-0.72670.23451
33-0.01967-0.20250.41995
34-0.067592-0.69590.244007
35-0.034484-0.3550.361635
360.0537770.55370.290487
37-0.075545-0.77780.219215
380.1191991.22720.111228
39-0.0561-0.57760.282385
40-0.063461-0.65340.257466
41-0.136939-1.40990.080753
42-0.121769-1.25370.106357
43-0.03766-0.38770.349494
44-0.003789-0.0390.484479
450.0662350.68190.248386
460.0642230.66120.254954
470.0275060.28320.38879
48-0.033094-0.34070.366994
49-0.085338-0.87860.190801
50-0.03993-0.41110.340913
510.0450450.46380.321883
52-0.101037-1.04020.150298
530.0131450.13530.4463
540.0314070.32340.373531
550.032910.33880.367704
56-0.029775-0.30650.379894
57-0.101987-1.050.148049
58-0.059119-0.60870.272025
590.0625110.64360.260614
600.0464720.47850.316654


Parameters (Session):
par1 = 60 ; par2 = 1 ; par3 = 0 ; par4 = 0 ; par5 = 12 ;
Parameters (R input):
par1 = 60 ; par2 = 1 ; par3 = 0 ; par4 = 0 ; par5 = 12 ;
R code (references can be found in the software module):
if (par1 == 'Default') {
par1 = 10*log10(length(x))
} else {
par1 <- as.numeric(par1)
}
par2 <- as.numeric(par2)
par3 <- as.numeric(par3)
par4 <- as.numeric(par4)
par5 <- as.numeric(par5)
if (par2 == 0) {
x <- log(x)
} else {
x <- (x ^ par2 - 1) / par2
}
if (par3 > 0) x <- diff(x,lag=1,difference=par3)
if (par4 > 0) x <- diff(x,lag=par5,difference=par4)
bitmap(file='pic1.png')
racf <- acf(x,par1,main='Autocorrelation',xlab='lags',ylab='ACF')
dev.off()
bitmap(file='pic2.png')
rpacf <- pacf(x,par1,main='Partial Autocorrelation',xlab='lags',ylab='PACF')
dev.off()
(myacf <- c(racf$acf))
(mypacf <- c(rpacf$acf))
lengthx <- length(x)
sqrtn <- sqrt(lengthx)
load(file='createtable')
a<-table.start()
a<-table.row.start(a)
a<-table.element(a,'Autocorrelation Function',4,TRUE)
a<-table.row.end(a)
a<-table.row.start(a)
a<-table.element(a,'Time lag k',header=TRUE)
a<-table.element(a,hyperlink('basics.htm','ACF(k)','click here for more information about the Autocorrelation Function'),header=TRUE)
a<-table.element(a,'T-STAT',header=TRUE)
a<-table.element(a,'P-value',header=TRUE)
a<-table.row.end(a)
for (i in 2:(par1+1)) {
a<-table.row.start(a)
a<-table.element(a,i-1,header=TRUE)
a<-table.element(a,round(myacf[i],6))
mytstat <- myacf[i]*sqrtn
a<-table.element(a,round(mytstat,4))
a<-table.element(a,round(1-pt(abs(mytstat),lengthx),6))
a<-table.row.end(a)
}
a<-table.end(a)
table.save(a,file='mytable.tab')
a<-table.start()
a<-table.row.start(a)
a<-table.element(a,'Partial Autocorrelation Function',4,TRUE)
a<-table.row.end(a)
a<-table.row.start(a)
a<-table.element(a,'Time lag k',header=TRUE)
a<-table.element(a,hyperlink('basics.htm','PACF(k)','click here for more information about the Partial Autocorrelation Function'),header=TRUE)
a<-table.element(a,'T-STAT',header=TRUE)
a<-table.element(a,'P-value',header=TRUE)
a<-table.row.end(a)
for (i in 1:par1) {
a<-table.row.start(a)
a<-table.element(a,i,header=TRUE)
a<-table.element(a,round(mypacf[i],6))
mytstat <- mypacf[i]*sqrtn
a<-table.element(a,round(mytstat,4))
a<-table.element(a,round(1-pt(abs(mytstat),lengthx),6))
a<-table.row.end(a)
}
a<-table.end(a)
table.save(a,file='mytable1.tab')