Free Statistics

of Irreproducible Research!

Author's title

Author*The author of this computation has been verified*
R Software Modulerwasp_autocorrelation.wasp
Title produced by software(Partial) Autocorrelation Function
Date of computationSun, 07 Dec 2008 09:22:50 -0700
Cite this page as followsStatistical Computations at FreeStatistics.org, Office for Research Development and Education, URL https://freestatistics.org/blog/index.php?v=date/2008/Dec/07/t1228667029n6gwqkh6yhym26h.htm/, Retrieved Sat, 18 May 2024 12:39:17 +0000
Statistical Computations at FreeStatistics.org, Office for Research Development and Education, URL https://freestatistics.org/blog/index.php?pk=30140, Retrieved Sat, 18 May 2024 12:39:17 +0000
QR Codes:

Original text written by user:
IsPrivate?No (this computation is public)
User-defined keywords
Estimated Impact179
Family? (F = Feedback message, R = changed R code, M = changed R Module, P = changed Parameters, D = changed Data)
-     [Univariate Data Series] [data set] [2008-12-01 19:54:57] [b98453cac15ba1066b407e146608df68]
F RMPD    [(Partial) Autocorrelation Function] [workshop8, step2,...] [2008-12-07 16:22:50] [a16dfd7e948381d8b6391003c5d09447] [Current]
Feedback Forum
2008-12-15 18:56:00 [Peter Van Doninck] [reply
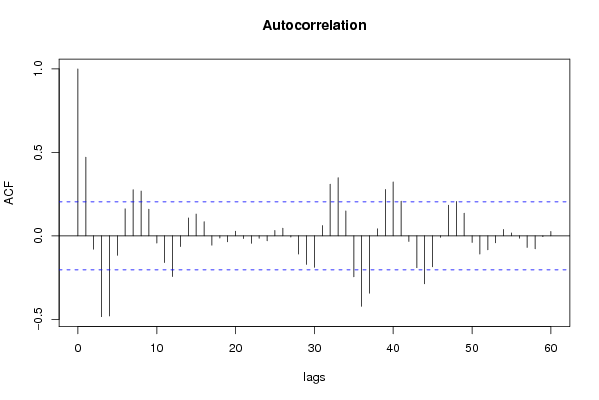
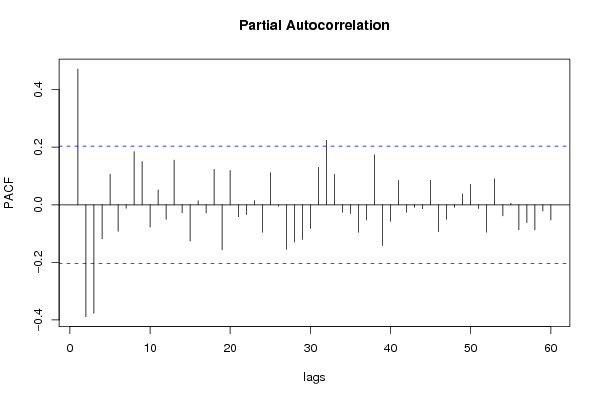
Persoonlijk zou ik, rekenening houdende met de getrimde variantie bij VRM, niet seizoenaal differentiëren. Enkel lag 12 en 24 zijn significant verschillend van nul, de anderen niet meer. Daarom denk ik dat seizoenaal differentiëren nutteloos hier is.

Post a new message
Dataseries X:
7.5
7.2
6.9
6.7
6.4
6.3
6.8
7.3
7.1
7.1
6.8
6.5
6.3
6.1
6.1
6.3
6.3
6
6.2
6.4
6.8
7.5
7.5
7.6
7.6
7.4
7.3
7.1
6.9
6.8
7.5
7.6
7.8
8
8.1
8.2
8.3
8.2
8
7.9
7.6
7.6
8.2
8.3
8.4
8.4
8.4
8.6
8.9
8.8
8.3
7.5
7.2
7.5
8.8
9.3
9.3
8.7
8.2
8.3
8.5
8.6
8.6
8.2
8.1
8
8.6
8.7
8.8
8.5
8.4
8.5
8.7
8.7
8.6
8.5
8.3
8.1
8.2
8.1
8.1
7.9
7.9
7.9
8
8
7.9
8
7.7
7.2
7.5
7.3
7
7
7
7.2
7.3
7.1
6.8
6.6
6.2
6.2
6.8
6.9
6.8
6.7


Summary of computational transaction
Raw Inputview raw input (R code)
Raw Outputview raw output of R engine
Computing time2 seconds
R Server'Sir Ronald Aylmer Fisher' @ 193.190.124.24

\begin{tabular}{lllllllll}
\hline
Summary of computational transaction \tabularnewline
Raw Input & view raw input (R code)  \tabularnewline
Raw Output & view raw output of R engine  \tabularnewline
Computing time & 2 seconds \tabularnewline
R Server & 'Sir Ronald Aylmer Fisher' @ 193.190.124.24 \tabularnewline
\hline
\end{tabular}
%Source: https://freestatistics.org/blog/index.php?pk=30140&T=0

[TABLE]
[ROW][C]Summary of computational transaction[/C][/ROW]
[ROW][C]Raw Input[/C][C]view raw input (R code) [/C][/ROW]
[ROW][C]Raw Output[/C][C]view raw output of R engine [/C][/ROW]
[ROW][C]Computing time[/C][C]2 seconds[/C][/ROW]
[ROW][C]R Server[/C][C]'Sir Ronald Aylmer Fisher' @ 193.190.124.24[/C][/ROW]
[/TABLE]
Source: https://freestatistics.org/blog/index.php?pk=30140&T=0

Globally Unique Identifier (entire table): ba.freestatistics.org/blog/index.php?pk=30140&T=0

As an alternative you can also use a QR Code:  

The GUIDs for individual cells are displayed in the table below:

Summary of computational transaction
Raw Inputview raw input (R code)
Raw Outputview raw output of R engine
Computing time2 seconds
R Server'Sir Ronald Aylmer Fisher' @ 193.190.124.24


Autocorrelation Function
Time lag kACF(k)T-STATP-value
10.4715054.5478e-06
2-0.079734-0.76890.221941
3-0.483994-4.66755e-06
4-0.479357-4.62276e-06
5-0.116715-1.12560.131625
60.1619441.56170.060874
70.2767432.66880.004491
80.2681442.58590.005633
90.1596881.540.063481
10-0.042511-0.410.341389
11-0.159931-1.54230.063196
12-0.244093-2.3540.01034
13-0.063365-0.61110.271322
140.107521.03690.151239
150.1302521.25610.106112
160.0847930.81770.207805
17-0.055581-0.5360.296619
18-0.013539-0.13060.448201
19-0.0355-0.34230.366432
200.0278630.26870.394379
21-0.015628-0.15070.440266
22-0.044207-0.42630.335433
23-0.014479-0.13960.444626
24-0.029822-0.28760.38715
250.0327440.31580.37644
260.0454660.43850.331036
27-0.006611-0.06380.47465
28-0.108659-1.04790.148707
29-0.170999-1.64910.051256
30-0.188142-1.81440.036422
310.0615310.59340.277181
320.3092782.98260.001825
330.3478443.35450.000576
340.1490381.43730.076999
35-0.245588-2.36840.009968
36-0.42144-4.06425e-05
37-0.343166-3.30940.000666
380.042220.40720.342414
390.2784482.68530.004291
400.3230043.11490.001223
410.2073011.99910.024256
42-0.033098-0.31920.375149
43-0.19052-1.83730.034679
44-0.287416-2.77170.003367
45-0.185351-1.78750.03856
46-0.008225-0.07930.468476
470.1836871.77140.039883
480.2062941.98940.024796
490.1356611.30830.097003
50-0.039144-0.37750.353336
51-0.108269-1.04410.149572
52-0.083777-0.80790.2106
53-0.041065-0.3960.3465
540.0385490.37180.355461
550.0176770.17050.432503
56-0.01375-0.13260.4474
57-0.06922-0.66750.253044
58-0.077567-0.7480.228165
59-0.004739-0.04570.481825
600.0262870.25350.400219

\begin{tabular}{lllllllll}
\hline
Autocorrelation Function \tabularnewline
Time lag k & ACF(k) & T-STAT & P-value \tabularnewline
1 & 0.471505 & 4.547 & 8e-06 \tabularnewline
2 & -0.079734 & -0.7689 & 0.221941 \tabularnewline
3 & -0.483994 & -4.6675 & 5e-06 \tabularnewline
4 & -0.479357 & -4.6227 & 6e-06 \tabularnewline
5 & -0.116715 & -1.1256 & 0.131625 \tabularnewline
6 & 0.161944 & 1.5617 & 0.060874 \tabularnewline
7 & 0.276743 & 2.6688 & 0.004491 \tabularnewline
8 & 0.268144 & 2.5859 & 0.005633 \tabularnewline
9 & 0.159688 & 1.54 & 0.063481 \tabularnewline
10 & -0.042511 & -0.41 & 0.341389 \tabularnewline
11 & -0.159931 & -1.5423 & 0.063196 \tabularnewline
12 & -0.244093 & -2.354 & 0.01034 \tabularnewline
13 & -0.063365 & -0.6111 & 0.271322 \tabularnewline
14 & 0.10752 & 1.0369 & 0.151239 \tabularnewline
15 & 0.130252 & 1.2561 & 0.106112 \tabularnewline
16 & 0.084793 & 0.8177 & 0.207805 \tabularnewline
17 & -0.055581 & -0.536 & 0.296619 \tabularnewline
18 & -0.013539 & -0.1306 & 0.448201 \tabularnewline
19 & -0.0355 & -0.3423 & 0.366432 \tabularnewline
20 & 0.027863 & 0.2687 & 0.394379 \tabularnewline
21 & -0.015628 & -0.1507 & 0.440266 \tabularnewline
22 & -0.044207 & -0.4263 & 0.335433 \tabularnewline
23 & -0.014479 & -0.1396 & 0.444626 \tabularnewline
24 & -0.029822 & -0.2876 & 0.38715 \tabularnewline
25 & 0.032744 & 0.3158 & 0.37644 \tabularnewline
26 & 0.045466 & 0.4385 & 0.331036 \tabularnewline
27 & -0.006611 & -0.0638 & 0.47465 \tabularnewline
28 & -0.108659 & -1.0479 & 0.148707 \tabularnewline
29 & -0.170999 & -1.6491 & 0.051256 \tabularnewline
30 & -0.188142 & -1.8144 & 0.036422 \tabularnewline
31 & 0.061531 & 0.5934 & 0.277181 \tabularnewline
32 & 0.309278 & 2.9826 & 0.001825 \tabularnewline
33 & 0.347844 & 3.3545 & 0.000576 \tabularnewline
34 & 0.149038 & 1.4373 & 0.076999 \tabularnewline
35 & -0.245588 & -2.3684 & 0.009968 \tabularnewline
36 & -0.42144 & -4.0642 & 5e-05 \tabularnewline
37 & -0.343166 & -3.3094 & 0.000666 \tabularnewline
38 & 0.04222 & 0.4072 & 0.342414 \tabularnewline
39 & 0.278448 & 2.6853 & 0.004291 \tabularnewline
40 & 0.323004 & 3.1149 & 0.001223 \tabularnewline
41 & 0.207301 & 1.9991 & 0.024256 \tabularnewline
42 & -0.033098 & -0.3192 & 0.375149 \tabularnewline
43 & -0.19052 & -1.8373 & 0.034679 \tabularnewline
44 & -0.287416 & -2.7717 & 0.003367 \tabularnewline
45 & -0.185351 & -1.7875 & 0.03856 \tabularnewline
46 & -0.008225 & -0.0793 & 0.468476 \tabularnewline
47 & 0.183687 & 1.7714 & 0.039883 \tabularnewline
48 & 0.206294 & 1.9894 & 0.024796 \tabularnewline
49 & 0.135661 & 1.3083 & 0.097003 \tabularnewline
50 & -0.039144 & -0.3775 & 0.353336 \tabularnewline
51 & -0.108269 & -1.0441 & 0.149572 \tabularnewline
52 & -0.083777 & -0.8079 & 0.2106 \tabularnewline
53 & -0.041065 & -0.396 & 0.3465 \tabularnewline
54 & 0.038549 & 0.3718 & 0.355461 \tabularnewline
55 & 0.017677 & 0.1705 & 0.432503 \tabularnewline
56 & -0.01375 & -0.1326 & 0.4474 \tabularnewline
57 & -0.06922 & -0.6675 & 0.253044 \tabularnewline
58 & -0.077567 & -0.748 & 0.228165 \tabularnewline
59 & -0.004739 & -0.0457 & 0.481825 \tabularnewline
60 & 0.026287 & 0.2535 & 0.400219 \tabularnewline
\hline
\end{tabular}
%Source: https://freestatistics.org/blog/index.php?pk=30140&T=1

[TABLE]
[ROW][C]Autocorrelation Function[/C][/ROW]
[ROW][C]Time lag k[/C][C]ACF(k)[/C][C]T-STAT[/C][C]P-value[/C][/ROW]
[ROW][C]1[/C][C]0.471505[/C][C]4.547[/C][C]8e-06[/C][/ROW]
[ROW][C]2[/C][C]-0.079734[/C][C]-0.7689[/C][C]0.221941[/C][/ROW]
[ROW][C]3[/C][C]-0.483994[/C][C]-4.6675[/C][C]5e-06[/C][/ROW]
[ROW][C]4[/C][C]-0.479357[/C][C]-4.6227[/C][C]6e-06[/C][/ROW]
[ROW][C]5[/C][C]-0.116715[/C][C]-1.1256[/C][C]0.131625[/C][/ROW]
[ROW][C]6[/C][C]0.161944[/C][C]1.5617[/C][C]0.060874[/C][/ROW]
[ROW][C]7[/C][C]0.276743[/C][C]2.6688[/C][C]0.004491[/C][/ROW]
[ROW][C]8[/C][C]0.268144[/C][C]2.5859[/C][C]0.005633[/C][/ROW]
[ROW][C]9[/C][C]0.159688[/C][C]1.54[/C][C]0.063481[/C][/ROW]
[ROW][C]10[/C][C]-0.042511[/C][C]-0.41[/C][C]0.341389[/C][/ROW]
[ROW][C]11[/C][C]-0.159931[/C][C]-1.5423[/C][C]0.063196[/C][/ROW]
[ROW][C]12[/C][C]-0.244093[/C][C]-2.354[/C][C]0.01034[/C][/ROW]
[ROW][C]13[/C][C]-0.063365[/C][C]-0.6111[/C][C]0.271322[/C][/ROW]
[ROW][C]14[/C][C]0.10752[/C][C]1.0369[/C][C]0.151239[/C][/ROW]
[ROW][C]15[/C][C]0.130252[/C][C]1.2561[/C][C]0.106112[/C][/ROW]
[ROW][C]16[/C][C]0.084793[/C][C]0.8177[/C][C]0.207805[/C][/ROW]
[ROW][C]17[/C][C]-0.055581[/C][C]-0.536[/C][C]0.296619[/C][/ROW]
[ROW][C]18[/C][C]-0.013539[/C][C]-0.1306[/C][C]0.448201[/C][/ROW]
[ROW][C]19[/C][C]-0.0355[/C][C]-0.3423[/C][C]0.366432[/C][/ROW]
[ROW][C]20[/C][C]0.027863[/C][C]0.2687[/C][C]0.394379[/C][/ROW]
[ROW][C]21[/C][C]-0.015628[/C][C]-0.1507[/C][C]0.440266[/C][/ROW]
[ROW][C]22[/C][C]-0.044207[/C][C]-0.4263[/C][C]0.335433[/C][/ROW]
[ROW][C]23[/C][C]-0.014479[/C][C]-0.1396[/C][C]0.444626[/C][/ROW]
[ROW][C]24[/C][C]-0.029822[/C][C]-0.2876[/C][C]0.38715[/C][/ROW]
[ROW][C]25[/C][C]0.032744[/C][C]0.3158[/C][C]0.37644[/C][/ROW]
[ROW][C]26[/C][C]0.045466[/C][C]0.4385[/C][C]0.331036[/C][/ROW]
[ROW][C]27[/C][C]-0.006611[/C][C]-0.0638[/C][C]0.47465[/C][/ROW]
[ROW][C]28[/C][C]-0.108659[/C][C]-1.0479[/C][C]0.148707[/C][/ROW]
[ROW][C]29[/C][C]-0.170999[/C][C]-1.6491[/C][C]0.051256[/C][/ROW]
[ROW][C]30[/C][C]-0.188142[/C][C]-1.8144[/C][C]0.036422[/C][/ROW]
[ROW][C]31[/C][C]0.061531[/C][C]0.5934[/C][C]0.277181[/C][/ROW]
[ROW][C]32[/C][C]0.309278[/C][C]2.9826[/C][C]0.001825[/C][/ROW]
[ROW][C]33[/C][C]0.347844[/C][C]3.3545[/C][C]0.000576[/C][/ROW]
[ROW][C]34[/C][C]0.149038[/C][C]1.4373[/C][C]0.076999[/C][/ROW]
[ROW][C]35[/C][C]-0.245588[/C][C]-2.3684[/C][C]0.009968[/C][/ROW]
[ROW][C]36[/C][C]-0.42144[/C][C]-4.0642[/C][C]5e-05[/C][/ROW]
[ROW][C]37[/C][C]-0.343166[/C][C]-3.3094[/C][C]0.000666[/C][/ROW]
[ROW][C]38[/C][C]0.04222[/C][C]0.4072[/C][C]0.342414[/C][/ROW]
[ROW][C]39[/C][C]0.278448[/C][C]2.6853[/C][C]0.004291[/C][/ROW]
[ROW][C]40[/C][C]0.323004[/C][C]3.1149[/C][C]0.001223[/C][/ROW]
[ROW][C]41[/C][C]0.207301[/C][C]1.9991[/C][C]0.024256[/C][/ROW]
[ROW][C]42[/C][C]-0.033098[/C][C]-0.3192[/C][C]0.375149[/C][/ROW]
[ROW][C]43[/C][C]-0.19052[/C][C]-1.8373[/C][C]0.034679[/C][/ROW]
[ROW][C]44[/C][C]-0.287416[/C][C]-2.7717[/C][C]0.003367[/C][/ROW]
[ROW][C]45[/C][C]-0.185351[/C][C]-1.7875[/C][C]0.03856[/C][/ROW]
[ROW][C]46[/C][C]-0.008225[/C][C]-0.0793[/C][C]0.468476[/C][/ROW]
[ROW][C]47[/C][C]0.183687[/C][C]1.7714[/C][C]0.039883[/C][/ROW]
[ROW][C]48[/C][C]0.206294[/C][C]1.9894[/C][C]0.024796[/C][/ROW]
[ROW][C]49[/C][C]0.135661[/C][C]1.3083[/C][C]0.097003[/C][/ROW]
[ROW][C]50[/C][C]-0.039144[/C][C]-0.3775[/C][C]0.353336[/C][/ROW]
[ROW][C]51[/C][C]-0.108269[/C][C]-1.0441[/C][C]0.149572[/C][/ROW]
[ROW][C]52[/C][C]-0.083777[/C][C]-0.8079[/C][C]0.2106[/C][/ROW]
[ROW][C]53[/C][C]-0.041065[/C][C]-0.396[/C][C]0.3465[/C][/ROW]
[ROW][C]54[/C][C]0.038549[/C][C]0.3718[/C][C]0.355461[/C][/ROW]
[ROW][C]55[/C][C]0.017677[/C][C]0.1705[/C][C]0.432503[/C][/ROW]
[ROW][C]56[/C][C]-0.01375[/C][C]-0.1326[/C][C]0.4474[/C][/ROW]
[ROW][C]57[/C][C]-0.06922[/C][C]-0.6675[/C][C]0.253044[/C][/ROW]
[ROW][C]58[/C][C]-0.077567[/C][C]-0.748[/C][C]0.228165[/C][/ROW]
[ROW][C]59[/C][C]-0.004739[/C][C]-0.0457[/C][C]0.481825[/C][/ROW]
[ROW][C]60[/C][C]0.026287[/C][C]0.2535[/C][C]0.400219[/C][/ROW]
[/TABLE]
Source: https://freestatistics.org/blog/index.php?pk=30140&T=1

Globally Unique Identifier (entire table): ba.freestatistics.org/blog/index.php?pk=30140&T=1

As an alternative you can also use a QR Code:  

The GUIDs for individual cells are displayed in the table below:

Autocorrelation Function
Time lag kACF(k)T-STATP-value
10.4715054.5478e-06
2-0.079734-0.76890.221941
3-0.483994-4.66755e-06
4-0.479357-4.62276e-06
5-0.116715-1.12560.131625
60.1619441.56170.060874
70.2767432.66880.004491
80.2681442.58590.005633
90.1596881.540.063481
10-0.042511-0.410.341389
11-0.159931-1.54230.063196
12-0.244093-2.3540.01034
13-0.063365-0.61110.271322
140.107521.03690.151239
150.1302521.25610.106112
160.0847930.81770.207805
17-0.055581-0.5360.296619
18-0.013539-0.13060.448201
19-0.0355-0.34230.366432
200.0278630.26870.394379
21-0.015628-0.15070.440266
22-0.044207-0.42630.335433
23-0.014479-0.13960.444626
24-0.029822-0.28760.38715
250.0327440.31580.37644
260.0454660.43850.331036
27-0.006611-0.06380.47465
28-0.108659-1.04790.148707
29-0.170999-1.64910.051256
30-0.188142-1.81440.036422
310.0615310.59340.277181
320.3092782.98260.001825
330.3478443.35450.000576
340.1490381.43730.076999
35-0.245588-2.36840.009968
36-0.42144-4.06425e-05
37-0.343166-3.30940.000666
380.042220.40720.342414
390.2784482.68530.004291
400.3230043.11490.001223
410.2073011.99910.024256
42-0.033098-0.31920.375149
43-0.19052-1.83730.034679
44-0.287416-2.77170.003367
45-0.185351-1.78750.03856
46-0.008225-0.07930.468476
470.1836871.77140.039883
480.2062941.98940.024796
490.1356611.30830.097003
50-0.039144-0.37750.353336
51-0.108269-1.04410.149572
52-0.083777-0.80790.2106
53-0.041065-0.3960.3465
540.0385490.37180.355461
550.0176770.17050.432503
56-0.01375-0.13260.4474
57-0.06922-0.66750.253044
58-0.077567-0.7480.228165
59-0.004739-0.04570.481825
600.0262870.25350.400219


Partial Autocorrelation Function
Time lag kPACF(k)T-STATP-value
10.4715054.5478e-06
2-0.388399-3.74560.000156
3-0.376556-3.63140.000231
4-0.118342-1.14130.128348
50.1062831.0250.154021
6-0.092036-0.88760.188532
7-0.011908-0.11480.454412
80.1840031.77450.03963
90.149881.44540.075855
10-0.07731-0.74550.228911
110.0515050.49670.310289
12-0.050655-0.48850.313172
130.1551611.49630.068978
14-0.027566-0.26580.395475
15-0.125709-1.21230.114235
160.0140080.13510.446418
17-0.028693-0.27670.39131
180.1224151.18050.120401
19-0.156481-1.5090.067339
200.119061.14820.126921
21-0.042023-0.40530.343109
22-0.034126-0.32910.371411
230.0149260.14390.442927
24-0.095296-0.9190.180236
250.111361.07390.142819
26-0.00409-0.03940.484313
27-0.154625-1.49120.069653
28-0.129042-1.24440.108233
29-0.120235-1.15950.12461
30-0.082376-0.79440.214491
310.1297291.25110.107025
320.2238022.15830.016741
330.1054971.01740.155807
34-0.026228-0.25290.400438
35-0.030229-0.29150.385653
36-0.095365-0.91970.180063
37-0.052498-0.50630.306932
380.1732621.67090.049054
39-0.141284-1.36250.088167
40-0.057589-0.55540.289987
410.0840370.81040.209883
42-0.025916-0.24990.401598
43-0.008549-0.08240.467235
44-0.013746-0.13260.447411
450.0851490.82110.206831
46-0.092839-0.89530.186467
47-0.050671-0.48860.31312
48-0.008972-0.08650.465617
490.0375490.36210.359047
500.0706180.6810.248778
51-0.012597-0.12150.451785
52-0.095128-0.91740.180658
530.0899510.86750.193962
54-0.037894-0.36540.357809
550.0056480.05450.478342
56-0.086967-0.83870.2019
57-0.061593-0.5940.276984
58-0.086318-0.83240.203653
59-0.02142-0.20660.418399
60-0.05282-0.50940.305846

\begin{tabular}{lllllllll}
\hline
Partial Autocorrelation Function \tabularnewline
Time lag k & PACF(k) & T-STAT & P-value \tabularnewline
1 & 0.471505 & 4.547 & 8e-06 \tabularnewline
2 & -0.388399 & -3.7456 & 0.000156 \tabularnewline
3 & -0.376556 & -3.6314 & 0.000231 \tabularnewline
4 & -0.118342 & -1.1413 & 0.128348 \tabularnewline
5 & 0.106283 & 1.025 & 0.154021 \tabularnewline
6 & -0.092036 & -0.8876 & 0.188532 \tabularnewline
7 & -0.011908 & -0.1148 & 0.454412 \tabularnewline
8 & 0.184003 & 1.7745 & 0.03963 \tabularnewline
9 & 0.14988 & 1.4454 & 0.075855 \tabularnewline
10 & -0.07731 & -0.7455 & 0.228911 \tabularnewline
11 & 0.051505 & 0.4967 & 0.310289 \tabularnewline
12 & -0.050655 & -0.4885 & 0.313172 \tabularnewline
13 & 0.155161 & 1.4963 & 0.068978 \tabularnewline
14 & -0.027566 & -0.2658 & 0.395475 \tabularnewline
15 & -0.125709 & -1.2123 & 0.114235 \tabularnewline
16 & 0.014008 & 0.1351 & 0.446418 \tabularnewline
17 & -0.028693 & -0.2767 & 0.39131 \tabularnewline
18 & 0.122415 & 1.1805 & 0.120401 \tabularnewline
19 & -0.156481 & -1.509 & 0.067339 \tabularnewline
20 & 0.11906 & 1.1482 & 0.126921 \tabularnewline
21 & -0.042023 & -0.4053 & 0.343109 \tabularnewline
22 & -0.034126 & -0.3291 & 0.371411 \tabularnewline
23 & 0.014926 & 0.1439 & 0.442927 \tabularnewline
24 & -0.095296 & -0.919 & 0.180236 \tabularnewline
25 & 0.11136 & 1.0739 & 0.142819 \tabularnewline
26 & -0.00409 & -0.0394 & 0.484313 \tabularnewline
27 & -0.154625 & -1.4912 & 0.069653 \tabularnewline
28 & -0.129042 & -1.2444 & 0.108233 \tabularnewline
29 & -0.120235 & -1.1595 & 0.12461 \tabularnewline
30 & -0.082376 & -0.7944 & 0.214491 \tabularnewline
31 & 0.129729 & 1.2511 & 0.107025 \tabularnewline
32 & 0.223802 & 2.1583 & 0.016741 \tabularnewline
33 & 0.105497 & 1.0174 & 0.155807 \tabularnewline
34 & -0.026228 & -0.2529 & 0.400438 \tabularnewline
35 & -0.030229 & -0.2915 & 0.385653 \tabularnewline
36 & -0.095365 & -0.9197 & 0.180063 \tabularnewline
37 & -0.052498 & -0.5063 & 0.306932 \tabularnewline
38 & 0.173262 & 1.6709 & 0.049054 \tabularnewline
39 & -0.141284 & -1.3625 & 0.088167 \tabularnewline
40 & -0.057589 & -0.5554 & 0.289987 \tabularnewline
41 & 0.084037 & 0.8104 & 0.209883 \tabularnewline
42 & -0.025916 & -0.2499 & 0.401598 \tabularnewline
43 & -0.008549 & -0.0824 & 0.467235 \tabularnewline
44 & -0.013746 & -0.1326 & 0.447411 \tabularnewline
45 & 0.085149 & 0.8211 & 0.206831 \tabularnewline
46 & -0.092839 & -0.8953 & 0.186467 \tabularnewline
47 & -0.050671 & -0.4886 & 0.31312 \tabularnewline
48 & -0.008972 & -0.0865 & 0.465617 \tabularnewline
49 & 0.037549 & 0.3621 & 0.359047 \tabularnewline
50 & 0.070618 & 0.681 & 0.248778 \tabularnewline
51 & -0.012597 & -0.1215 & 0.451785 \tabularnewline
52 & -0.095128 & -0.9174 & 0.180658 \tabularnewline
53 & 0.089951 & 0.8675 & 0.193962 \tabularnewline
54 & -0.037894 & -0.3654 & 0.357809 \tabularnewline
55 & 0.005648 & 0.0545 & 0.478342 \tabularnewline
56 & -0.086967 & -0.8387 & 0.2019 \tabularnewline
57 & -0.061593 & -0.594 & 0.276984 \tabularnewline
58 & -0.086318 & -0.8324 & 0.203653 \tabularnewline
59 & -0.02142 & -0.2066 & 0.418399 \tabularnewline
60 & -0.05282 & -0.5094 & 0.305846 \tabularnewline
\hline
\end{tabular}
%Source: https://freestatistics.org/blog/index.php?pk=30140&T=2

[TABLE]
[ROW][C]Partial Autocorrelation Function[/C][/ROW]
[ROW][C]Time lag k[/C][C]PACF(k)[/C][C]T-STAT[/C][C]P-value[/C][/ROW]
[ROW][C]1[/C][C]0.471505[/C][C]4.547[/C][C]8e-06[/C][/ROW]
[ROW][C]2[/C][C]-0.388399[/C][C]-3.7456[/C][C]0.000156[/C][/ROW]
[ROW][C]3[/C][C]-0.376556[/C][C]-3.6314[/C][C]0.000231[/C][/ROW]
[ROW][C]4[/C][C]-0.118342[/C][C]-1.1413[/C][C]0.128348[/C][/ROW]
[ROW][C]5[/C][C]0.106283[/C][C]1.025[/C][C]0.154021[/C][/ROW]
[ROW][C]6[/C][C]-0.092036[/C][C]-0.8876[/C][C]0.188532[/C][/ROW]
[ROW][C]7[/C][C]-0.011908[/C][C]-0.1148[/C][C]0.454412[/C][/ROW]
[ROW][C]8[/C][C]0.184003[/C][C]1.7745[/C][C]0.03963[/C][/ROW]
[ROW][C]9[/C][C]0.14988[/C][C]1.4454[/C][C]0.075855[/C][/ROW]
[ROW][C]10[/C][C]-0.07731[/C][C]-0.7455[/C][C]0.228911[/C][/ROW]
[ROW][C]11[/C][C]0.051505[/C][C]0.4967[/C][C]0.310289[/C][/ROW]
[ROW][C]12[/C][C]-0.050655[/C][C]-0.4885[/C][C]0.313172[/C][/ROW]
[ROW][C]13[/C][C]0.155161[/C][C]1.4963[/C][C]0.068978[/C][/ROW]
[ROW][C]14[/C][C]-0.027566[/C][C]-0.2658[/C][C]0.395475[/C][/ROW]
[ROW][C]15[/C][C]-0.125709[/C][C]-1.2123[/C][C]0.114235[/C][/ROW]
[ROW][C]16[/C][C]0.014008[/C][C]0.1351[/C][C]0.446418[/C][/ROW]
[ROW][C]17[/C][C]-0.028693[/C][C]-0.2767[/C][C]0.39131[/C][/ROW]
[ROW][C]18[/C][C]0.122415[/C][C]1.1805[/C][C]0.120401[/C][/ROW]
[ROW][C]19[/C][C]-0.156481[/C][C]-1.509[/C][C]0.067339[/C][/ROW]
[ROW][C]20[/C][C]0.11906[/C][C]1.1482[/C][C]0.126921[/C][/ROW]
[ROW][C]21[/C][C]-0.042023[/C][C]-0.4053[/C][C]0.343109[/C][/ROW]
[ROW][C]22[/C][C]-0.034126[/C][C]-0.3291[/C][C]0.371411[/C][/ROW]
[ROW][C]23[/C][C]0.014926[/C][C]0.1439[/C][C]0.442927[/C][/ROW]
[ROW][C]24[/C][C]-0.095296[/C][C]-0.919[/C][C]0.180236[/C][/ROW]
[ROW][C]25[/C][C]0.11136[/C][C]1.0739[/C][C]0.142819[/C][/ROW]
[ROW][C]26[/C][C]-0.00409[/C][C]-0.0394[/C][C]0.484313[/C][/ROW]
[ROW][C]27[/C][C]-0.154625[/C][C]-1.4912[/C][C]0.069653[/C][/ROW]
[ROW][C]28[/C][C]-0.129042[/C][C]-1.2444[/C][C]0.108233[/C][/ROW]
[ROW][C]29[/C][C]-0.120235[/C][C]-1.1595[/C][C]0.12461[/C][/ROW]
[ROW][C]30[/C][C]-0.082376[/C][C]-0.7944[/C][C]0.214491[/C][/ROW]
[ROW][C]31[/C][C]0.129729[/C][C]1.2511[/C][C]0.107025[/C][/ROW]
[ROW][C]32[/C][C]0.223802[/C][C]2.1583[/C][C]0.016741[/C][/ROW]
[ROW][C]33[/C][C]0.105497[/C][C]1.0174[/C][C]0.155807[/C][/ROW]
[ROW][C]34[/C][C]-0.026228[/C][C]-0.2529[/C][C]0.400438[/C][/ROW]
[ROW][C]35[/C][C]-0.030229[/C][C]-0.2915[/C][C]0.385653[/C][/ROW]
[ROW][C]36[/C][C]-0.095365[/C][C]-0.9197[/C][C]0.180063[/C][/ROW]
[ROW][C]37[/C][C]-0.052498[/C][C]-0.5063[/C][C]0.306932[/C][/ROW]
[ROW][C]38[/C][C]0.173262[/C][C]1.6709[/C][C]0.049054[/C][/ROW]
[ROW][C]39[/C][C]-0.141284[/C][C]-1.3625[/C][C]0.088167[/C][/ROW]
[ROW][C]40[/C][C]-0.057589[/C][C]-0.5554[/C][C]0.289987[/C][/ROW]
[ROW][C]41[/C][C]0.084037[/C][C]0.8104[/C][C]0.209883[/C][/ROW]
[ROW][C]42[/C][C]-0.025916[/C][C]-0.2499[/C][C]0.401598[/C][/ROW]
[ROW][C]43[/C][C]-0.008549[/C][C]-0.0824[/C][C]0.467235[/C][/ROW]
[ROW][C]44[/C][C]-0.013746[/C][C]-0.1326[/C][C]0.447411[/C][/ROW]
[ROW][C]45[/C][C]0.085149[/C][C]0.8211[/C][C]0.206831[/C][/ROW]
[ROW][C]46[/C][C]-0.092839[/C][C]-0.8953[/C][C]0.186467[/C][/ROW]
[ROW][C]47[/C][C]-0.050671[/C][C]-0.4886[/C][C]0.31312[/C][/ROW]
[ROW][C]48[/C][C]-0.008972[/C][C]-0.0865[/C][C]0.465617[/C][/ROW]
[ROW][C]49[/C][C]0.037549[/C][C]0.3621[/C][C]0.359047[/C][/ROW]
[ROW][C]50[/C][C]0.070618[/C][C]0.681[/C][C]0.248778[/C][/ROW]
[ROW][C]51[/C][C]-0.012597[/C][C]-0.1215[/C][C]0.451785[/C][/ROW]
[ROW][C]52[/C][C]-0.095128[/C][C]-0.9174[/C][C]0.180658[/C][/ROW]
[ROW][C]53[/C][C]0.089951[/C][C]0.8675[/C][C]0.193962[/C][/ROW]
[ROW][C]54[/C][C]-0.037894[/C][C]-0.3654[/C][C]0.357809[/C][/ROW]
[ROW][C]55[/C][C]0.005648[/C][C]0.0545[/C][C]0.478342[/C][/ROW]
[ROW][C]56[/C][C]-0.086967[/C][C]-0.8387[/C][C]0.2019[/C][/ROW]
[ROW][C]57[/C][C]-0.061593[/C][C]-0.594[/C][C]0.276984[/C][/ROW]
[ROW][C]58[/C][C]-0.086318[/C][C]-0.8324[/C][C]0.203653[/C][/ROW]
[ROW][C]59[/C][C]-0.02142[/C][C]-0.2066[/C][C]0.418399[/C][/ROW]
[ROW][C]60[/C][C]-0.05282[/C][C]-0.5094[/C][C]0.305846[/C][/ROW]
[/TABLE]
Source: https://freestatistics.org/blog/index.php?pk=30140&T=2

Globally Unique Identifier (entire table): ba.freestatistics.org/blog/index.php?pk=30140&T=2

As an alternative you can also use a QR Code:  

The GUIDs for individual cells are displayed in the table below:

Partial Autocorrelation Function
Time lag kPACF(k)T-STATP-value
10.4715054.5478e-06
2-0.388399-3.74560.000156
3-0.376556-3.63140.000231
4-0.118342-1.14130.128348
50.1062831.0250.154021
6-0.092036-0.88760.188532
7-0.011908-0.11480.454412
80.1840031.77450.03963
90.149881.44540.075855
10-0.07731-0.74550.228911
110.0515050.49670.310289
12-0.050655-0.48850.313172
130.1551611.49630.068978
14-0.027566-0.26580.395475
15-0.125709-1.21230.114235
160.0140080.13510.446418
17-0.028693-0.27670.39131
180.1224151.18050.120401
19-0.156481-1.5090.067339
200.119061.14820.126921
21-0.042023-0.40530.343109
22-0.034126-0.32910.371411
230.0149260.14390.442927
24-0.095296-0.9190.180236
250.111361.07390.142819
26-0.00409-0.03940.484313
27-0.154625-1.49120.069653
28-0.129042-1.24440.108233
29-0.120235-1.15950.12461
30-0.082376-0.79440.214491
310.1297291.25110.107025
320.2238022.15830.016741
330.1054971.01740.155807
34-0.026228-0.25290.400438
35-0.030229-0.29150.385653
36-0.095365-0.91970.180063
37-0.052498-0.50630.306932
380.1732621.67090.049054
39-0.141284-1.36250.088167
40-0.057589-0.55540.289987
410.0840370.81040.209883
42-0.025916-0.24990.401598
43-0.008549-0.08240.467235
44-0.013746-0.13260.447411
450.0851490.82110.206831
46-0.092839-0.89530.186467
47-0.050671-0.48860.31312
48-0.008972-0.08650.465617
490.0375490.36210.359047
500.0706180.6810.248778
51-0.012597-0.12150.451785
52-0.095128-0.91740.180658
530.0899510.86750.193962
54-0.037894-0.36540.357809
550.0056480.05450.478342
56-0.086967-0.83870.2019
57-0.061593-0.5940.276984
58-0.086318-0.83240.203653
59-0.02142-0.20660.418399
60-0.05282-0.50940.305846


Parameters (Session):
par1 = 60 ; par2 = 1 ; par3 = 1 ; par4 = 0 ; par5 = 12 ;
Parameters (R input):
par1 = 60 ; par2 = 1 ; par3 = 1 ; par4 = 1 ; par5 = 12 ;
R code (references can be found in the software module):
if (par1 == 'Default') {
par1 = 10*log10(length(x))
} else {
par1 <- as.numeric(par1)
}
par2 <- as.numeric(par2)
par3 <- as.numeric(par3)
par4 <- as.numeric(par4)
par5 <- as.numeric(par5)
if (par2 == 0) {
x <- log(x)
} else {
x <- (x ^ par2 - 1) / par2
}
if (par3 > 0) x <- diff(x,lag=1,difference=par3)
if (par4 > 0) x <- diff(x,lag=par5,difference=par4)
bitmap(file='pic1.png')
racf <- acf(x,par1,main='Autocorrelation',xlab='lags',ylab='ACF')
dev.off()
bitmap(file='pic2.png')
rpacf <- pacf(x,par1,main='Partial Autocorrelation',xlab='lags',ylab='PACF')
dev.off()
(myacf <- c(racf$acf))
(mypacf <- c(rpacf$acf))
lengthx <- length(x)
sqrtn <- sqrt(lengthx)
load(file='createtable')
a<-table.start()
a<-table.row.start(a)
a<-table.element(a,'Autocorrelation Function',4,TRUE)
a<-table.row.end(a)
a<-table.row.start(a)
a<-table.element(a,'Time lag k',header=TRUE)
a<-table.element(a,hyperlink('basics.htm','ACF(k)','click here for more information about the Autocorrelation Function'),header=TRUE)
a<-table.element(a,'T-STAT',header=TRUE)
a<-table.element(a,'P-value',header=TRUE)
a<-table.row.end(a)
for (i in 2:(par1+1)) {
a<-table.row.start(a)
a<-table.element(a,i-1,header=TRUE)
a<-table.element(a,round(myacf[i],6))
mytstat <- myacf[i]*sqrtn
a<-table.element(a,round(mytstat,4))
a<-table.element(a,round(1-pt(abs(mytstat),lengthx),6))
a<-table.row.end(a)
}
a<-table.end(a)
table.save(a,file='mytable.tab')
a<-table.start()
a<-table.row.start(a)
a<-table.element(a,'Partial Autocorrelation Function',4,TRUE)
a<-table.row.end(a)
a<-table.row.start(a)
a<-table.element(a,'Time lag k',header=TRUE)
a<-table.element(a,hyperlink('basics.htm','PACF(k)','click here for more information about the Partial Autocorrelation Function'),header=TRUE)
a<-table.element(a,'T-STAT',header=TRUE)
a<-table.element(a,'P-value',header=TRUE)
a<-table.row.end(a)
for (i in 1:par1) {
a<-table.row.start(a)
a<-table.element(a,i,header=TRUE)
a<-table.element(a,round(mypacf[i],6))
mytstat <- mypacf[i]*sqrtn
a<-table.element(a,round(mytstat,4))
a<-table.element(a,round(1-pt(abs(mytstat),lengthx),6))
a<-table.row.end(a)
}
a<-table.end(a)
table.save(a,file='mytable1.tab')