Free Statistics

of Irreproducible Research!

Author's title

Author*Unverified author*
R Software Modulerwasp_autocorrelation.wasp
Title produced by software(Partial) Autocorrelation Function
Date of computationTue, 09 Dec 2008 03:56:43 -0700
Cite this page as followsStatistical Computations at FreeStatistics.org, Office for Research Development and Education, URL https://freestatistics.org/blog/index.php?v=date/2008/Dec/09/t12288202576j1lre8k2gjcgud.htm/, Retrieved Sat, 18 May 2024 08:21:31 +0000
Statistical Computations at FreeStatistics.org, Office for Research Development and Education, URL https://freestatistics.org/blog/index.php?pk=31283, Retrieved Sat, 18 May 2024 08:21:31 +0000
QR Codes:

Original text written by user:
IsPrivate?No (this computation is public)
User-defined keywords
Estimated Impact174
Family? (F = Feedback message, R = changed R code, M = changed R Module, P = changed Parameters, D = changed Data)
F     [Spectral Analysis] [Diff Spectral] [2008-12-06 12:07:42] [74be16979710d4c4e7c6647856088456]
F RMP   [ARIMA Backward Selection] [Arima backward] [2008-12-06 14:19:09] [74be16979710d4c4e7c6647856088456]
- RMPD    [(Partial) Autocorrelation Function] [] [2008-12-09 10:52:15] [74be16979710d4c4e7c6647856088456]
-   PD        [(Partial) Autocorrelation Function] [] [2008-12-09 10:56:43] [d41d8cd98f00b204e9800998ecf8427e] [Current]
Feedback Forum

Post a new message
Dataseries X:
5.1
4.9
5.2
5.1
4.6
3.7
3.9
3.1
2.8
2.6
2.2
1.8
1.3
1.2
1.4
1.3
1.3
1.9
1.9
2.1
2.0
1.9
1.9
1.9
1.8
1.7
1.6
1.7
1.9
1.7
1.3
2.0
2.0
2.3
2.0
1.7
2.3
2.4
2.4
2.3
2.1
2.1
2.5
2.0
1.8
1.7
1.9
2.1
1.4
1.6
1.7
1.6
1.9
1.6
1.1
1.3
1.6
1.6
1.7
1.6
1.7
1.6
1.5
1.6
1.1
1.5
1.4
1.3
0.9
1.2
0.9
1.1
1.3
1.3
1.4
1.2
1.7
2.0
3.0
3.1
3.2
2.7
2.8
3.0
2.8
3.1
3.1
3.2
3.1
2.7
2.2
2.2
2.1
2.3
2.5
2.3
2.6


Summary of computational transaction
Raw Inputview raw input (R code)
Raw Outputview raw output of R engine
Computing time0 seconds
R Server'Gwilym Jenkins' @ 72.249.127.135

\begin{tabular}{lllllllll}
\hline
Summary of computational transaction \tabularnewline
Raw Input & view raw input (R code)  \tabularnewline
Raw Output & view raw output of R engine  \tabularnewline
Computing time & 0 seconds \tabularnewline
R Server & 'Gwilym Jenkins' @ 72.249.127.135 \tabularnewline
\hline
\end{tabular}
%Source: https://freestatistics.org/blog/index.php?pk=31283&T=0

[TABLE]
[ROW][C]Summary of computational transaction[/C][/ROW]
[ROW][C]Raw Input[/C][C]view raw input (R code) [/C][/ROW]
[ROW][C]Raw Output[/C][C]view raw output of R engine [/C][/ROW]
[ROW][C]Computing time[/C][C]0 seconds[/C][/ROW]
[ROW][C]R Server[/C][C]'Gwilym Jenkins' @ 72.249.127.135[/C][/ROW]
[/TABLE]
Source: https://freestatistics.org/blog/index.php?pk=31283&T=0

Globally Unique Identifier (entire table): ba.freestatistics.org/blog/index.php?pk=31283&T=0

As an alternative you can also use a QR Code:  

The GUIDs for individual cells are displayed in the table below:

Summary of computational transaction
Raw Inputview raw input (R code)
Raw Outputview raw output of R engine
Computing time0 seconds
R Server'Gwilym Jenkins' @ 72.249.127.135


Autocorrelation Function
Time lag kACF(k)T-STATP-value
1-0.208543-2.04330.021882
20.0384820.3770.353487
3-0.033678-0.330.371069
40.0300520.29440.384526
50.0633660.62090.268081
60.0439710.43080.333779
7-0.060096-0.58880.278684
8-0.14584-1.42890.078135
90.0717290.70280.24194
10-0.059585-0.58380.280357
110.1116851.09430.138284
12-0.381994-3.74280.000155
130.0751950.73680.231534
140.1709981.67540.048552
15-0.096136-0.94190.174295
160.1034651.01370.156626
17-0.118493-1.1610.124262
18-0.0382-0.37430.35451
190.0949060.92990.17738

\begin{tabular}{lllllllll}
\hline
Autocorrelation Function \tabularnewline
Time lag k & ACF(k) & T-STAT & P-value \tabularnewline
1 & -0.208543 & -2.0433 & 0.021882 \tabularnewline
2 & 0.038482 & 0.377 & 0.353487 \tabularnewline
3 & -0.033678 & -0.33 & 0.371069 \tabularnewline
4 & 0.030052 & 0.2944 & 0.384526 \tabularnewline
5 & 0.063366 & 0.6209 & 0.268081 \tabularnewline
6 & 0.043971 & 0.4308 & 0.333779 \tabularnewline
7 & -0.060096 & -0.5888 & 0.278684 \tabularnewline
8 & -0.14584 & -1.4289 & 0.078135 \tabularnewline
9 & 0.071729 & 0.7028 & 0.24194 \tabularnewline
10 & -0.059585 & -0.5838 & 0.280357 \tabularnewline
11 & 0.111685 & 1.0943 & 0.138284 \tabularnewline
12 & -0.381994 & -3.7428 & 0.000155 \tabularnewline
13 & 0.075195 & 0.7368 & 0.231534 \tabularnewline
14 & 0.170998 & 1.6754 & 0.048552 \tabularnewline
15 & -0.096136 & -0.9419 & 0.174295 \tabularnewline
16 & 0.103465 & 1.0137 & 0.156626 \tabularnewline
17 & -0.118493 & -1.161 & 0.124262 \tabularnewline
18 & -0.0382 & -0.3743 & 0.35451 \tabularnewline
19 & 0.094906 & 0.9299 & 0.17738 \tabularnewline
\hline
\end{tabular}
%Source: https://freestatistics.org/blog/index.php?pk=31283&T=1

[TABLE]
[ROW][C]Autocorrelation Function[/C][/ROW]
[ROW][C]Time lag k[/C][C]ACF(k)[/C][C]T-STAT[/C][C]P-value[/C][/ROW]
[ROW][C]1[/C][C]-0.208543[/C][C]-2.0433[/C][C]0.021882[/C][/ROW]
[ROW][C]2[/C][C]0.038482[/C][C]0.377[/C][C]0.353487[/C][/ROW]
[ROW][C]3[/C][C]-0.033678[/C][C]-0.33[/C][C]0.371069[/C][/ROW]
[ROW][C]4[/C][C]0.030052[/C][C]0.2944[/C][C]0.384526[/C][/ROW]
[ROW][C]5[/C][C]0.063366[/C][C]0.6209[/C][C]0.268081[/C][/ROW]
[ROW][C]6[/C][C]0.043971[/C][C]0.4308[/C][C]0.333779[/C][/ROW]
[ROW][C]7[/C][C]-0.060096[/C][C]-0.5888[/C][C]0.278684[/C][/ROW]
[ROW][C]8[/C][C]-0.14584[/C][C]-1.4289[/C][C]0.078135[/C][/ROW]
[ROW][C]9[/C][C]0.071729[/C][C]0.7028[/C][C]0.24194[/C][/ROW]
[ROW][C]10[/C][C]-0.059585[/C][C]-0.5838[/C][C]0.280357[/C][/ROW]
[ROW][C]11[/C][C]0.111685[/C][C]1.0943[/C][C]0.138284[/C][/ROW]
[ROW][C]12[/C][C]-0.381994[/C][C]-3.7428[/C][C]0.000155[/C][/ROW]
[ROW][C]13[/C][C]0.075195[/C][C]0.7368[/C][C]0.231534[/C][/ROW]
[ROW][C]14[/C][C]0.170998[/C][C]1.6754[/C][C]0.048552[/C][/ROW]
[ROW][C]15[/C][C]-0.096136[/C][C]-0.9419[/C][C]0.174295[/C][/ROW]
[ROW][C]16[/C][C]0.103465[/C][C]1.0137[/C][C]0.156626[/C][/ROW]
[ROW][C]17[/C][C]-0.118493[/C][C]-1.161[/C][C]0.124262[/C][/ROW]
[ROW][C]18[/C][C]-0.0382[/C][C]-0.3743[/C][C]0.35451[/C][/ROW]
[ROW][C]19[/C][C]0.094906[/C][C]0.9299[/C][C]0.17738[/C][/ROW]
[/TABLE]
Source: https://freestatistics.org/blog/index.php?pk=31283&T=1

Globally Unique Identifier (entire table): ba.freestatistics.org/blog/index.php?pk=31283&T=1

As an alternative you can also use a QR Code:  

The GUIDs for individual cells are displayed in the table below:

Autocorrelation Function
Time lag kACF(k)T-STATP-value
1-0.208543-2.04330.021882
20.0384820.3770.353487
3-0.033678-0.330.371069
40.0300520.29440.384526
50.0633660.62090.268081
60.0439710.43080.333779
7-0.060096-0.58880.278684
8-0.14584-1.42890.078135
90.0717290.70280.24194
10-0.059585-0.58380.280357
110.1116851.09430.138284
12-0.381994-3.74280.000155
130.0751950.73680.231534
140.1709981.67540.048552
15-0.096136-0.94190.174295
160.1034651.01370.156626
17-0.118493-1.1610.124262
18-0.0382-0.37430.35451
190.0949060.92990.17738


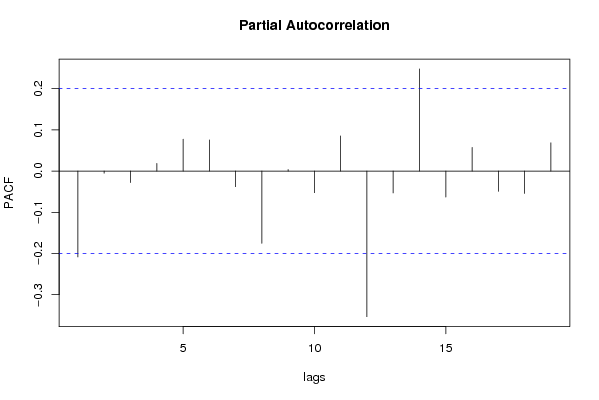
Partial Autocorrelation Function
Time lag kPACF(k)T-STATP-value
1-0.208543-2.04330.021882
2-0.005236-0.05130.479596
3-0.027918-0.27350.392515
40.0184060.18030.428631
50.0775090.75940.224729
60.0754390.73920.230809
7-0.037982-0.37210.355303
8-0.175482-1.71940.044385
90.003560.03490.486123
10-0.052491-0.51430.304111
110.0853220.8360.202622
12-0.353336-3.4620.000401
13-0.05301-0.51940.302342
140.2478722.42860.008509
15-0.063105-0.61830.268922
160.0574570.5630.287386
17-0.04905-0.48060.315952
18-0.054356-0.53260.297777
190.0686140.67230.251511

\begin{tabular}{lllllllll}
\hline
Partial Autocorrelation Function \tabularnewline
Time lag k & PACF(k) & T-STAT & P-value \tabularnewline
1 & -0.208543 & -2.0433 & 0.021882 \tabularnewline
2 & -0.005236 & -0.0513 & 0.479596 \tabularnewline
3 & -0.027918 & -0.2735 & 0.392515 \tabularnewline
4 & 0.018406 & 0.1803 & 0.428631 \tabularnewline
5 & 0.077509 & 0.7594 & 0.224729 \tabularnewline
6 & 0.075439 & 0.7392 & 0.230809 \tabularnewline
7 & -0.037982 & -0.3721 & 0.355303 \tabularnewline
8 & -0.175482 & -1.7194 & 0.044385 \tabularnewline
9 & 0.00356 & 0.0349 & 0.486123 \tabularnewline
10 & -0.052491 & -0.5143 & 0.304111 \tabularnewline
11 & 0.085322 & 0.836 & 0.202622 \tabularnewline
12 & -0.353336 & -3.462 & 0.000401 \tabularnewline
13 & -0.05301 & -0.5194 & 0.302342 \tabularnewline
14 & 0.247872 & 2.4286 & 0.008509 \tabularnewline
15 & -0.063105 & -0.6183 & 0.268922 \tabularnewline
16 & 0.057457 & 0.563 & 0.287386 \tabularnewline
17 & -0.04905 & -0.4806 & 0.315952 \tabularnewline
18 & -0.054356 & -0.5326 & 0.297777 \tabularnewline
19 & 0.068614 & 0.6723 & 0.251511 \tabularnewline
\hline
\end{tabular}
%Source: https://freestatistics.org/blog/index.php?pk=31283&T=2

[TABLE]
[ROW][C]Partial Autocorrelation Function[/C][/ROW]
[ROW][C]Time lag k[/C][C]PACF(k)[/C][C]T-STAT[/C][C]P-value[/C][/ROW]
[ROW][C]1[/C][C]-0.208543[/C][C]-2.0433[/C][C]0.021882[/C][/ROW]
[ROW][C]2[/C][C]-0.005236[/C][C]-0.0513[/C][C]0.479596[/C][/ROW]
[ROW][C]3[/C][C]-0.027918[/C][C]-0.2735[/C][C]0.392515[/C][/ROW]
[ROW][C]4[/C][C]0.018406[/C][C]0.1803[/C][C]0.428631[/C][/ROW]
[ROW][C]5[/C][C]0.077509[/C][C]0.7594[/C][C]0.224729[/C][/ROW]
[ROW][C]6[/C][C]0.075439[/C][C]0.7392[/C][C]0.230809[/C][/ROW]
[ROW][C]7[/C][C]-0.037982[/C][C]-0.3721[/C][C]0.355303[/C][/ROW]
[ROW][C]8[/C][C]-0.175482[/C][C]-1.7194[/C][C]0.044385[/C][/ROW]
[ROW][C]9[/C][C]0.00356[/C][C]0.0349[/C][C]0.486123[/C][/ROW]
[ROW][C]10[/C][C]-0.052491[/C][C]-0.5143[/C][C]0.304111[/C][/ROW]
[ROW][C]11[/C][C]0.085322[/C][C]0.836[/C][C]0.202622[/C][/ROW]
[ROW][C]12[/C][C]-0.353336[/C][C]-3.462[/C][C]0.000401[/C][/ROW]
[ROW][C]13[/C][C]-0.05301[/C][C]-0.5194[/C][C]0.302342[/C][/ROW]
[ROW][C]14[/C][C]0.247872[/C][C]2.4286[/C][C]0.008509[/C][/ROW]
[ROW][C]15[/C][C]-0.063105[/C][C]-0.6183[/C][C]0.268922[/C][/ROW]
[ROW][C]16[/C][C]0.057457[/C][C]0.563[/C][C]0.287386[/C][/ROW]
[ROW][C]17[/C][C]-0.04905[/C][C]-0.4806[/C][C]0.315952[/C][/ROW]
[ROW][C]18[/C][C]-0.054356[/C][C]-0.5326[/C][C]0.297777[/C][/ROW]
[ROW][C]19[/C][C]0.068614[/C][C]0.6723[/C][C]0.251511[/C][/ROW]
[/TABLE]
Source: https://freestatistics.org/blog/index.php?pk=31283&T=2

Globally Unique Identifier (entire table): ba.freestatistics.org/blog/index.php?pk=31283&T=2

As an alternative you can also use a QR Code:  

The GUIDs for individual cells are displayed in the table below:

Partial Autocorrelation Function
Time lag kPACF(k)T-STATP-value
1-0.208543-2.04330.021882
2-0.005236-0.05130.479596
3-0.027918-0.27350.392515
40.0184060.18030.428631
50.0775090.75940.224729
60.0754390.73920.230809
7-0.037982-0.37210.355303
8-0.175482-1.71940.044385
90.003560.03490.486123
10-0.052491-0.51430.304111
110.0853220.8360.202622
12-0.353336-3.4620.000401
13-0.05301-0.51940.302342
140.2478722.42860.008509
15-0.063105-0.61830.268922
160.0574570.5630.287386
17-0.04905-0.48060.315952
18-0.054356-0.53260.297777
190.0686140.67230.251511


Parameters (Session):
par1 = Default ; par2 = -0.5 ; par3 = 1 ; par4 = 0 ; par5 = 12 ;
Parameters (R input):
par1 = Default ; par2 = -0.5 ; par3 = 1 ; par4 = 0 ; par5 = 12 ;
R code (references can be found in the software module):
if (par1 == 'Default') {
par1 = 10*log10(length(x))
} else {
par1 <- as.numeric(par1)
}
par2 <- as.numeric(par2)
par3 <- as.numeric(par3)
par4 <- as.numeric(par4)
par5 <- as.numeric(par5)
if (par2 == 0) {
x <- log(x)
} else {
x <- (x ^ par2 - 1) / par2
}
if (par3 > 0) x <- diff(x,lag=1,difference=par3)
if (par4 > 0) x <- diff(x,lag=par5,difference=par4)
bitmap(file='pic1.png')
racf <- acf(x,par1,main='Autocorrelation',xlab='lags',ylab='ACF')
dev.off()
bitmap(file='pic2.png')
rpacf <- pacf(x,par1,main='Partial Autocorrelation',xlab='lags',ylab='PACF')
dev.off()
(myacf <- c(racf$acf))
(mypacf <- c(rpacf$acf))
lengthx <- length(x)
sqrtn <- sqrt(lengthx)
load(file='createtable')
a<-table.start()
a<-table.row.start(a)
a<-table.element(a,'Autocorrelation Function',4,TRUE)
a<-table.row.end(a)
a<-table.row.start(a)
a<-table.element(a,'Time lag k',header=TRUE)
a<-table.element(a,hyperlink('basics.htm','ACF(k)','click here for more information about the Autocorrelation Function'),header=TRUE)
a<-table.element(a,'T-STAT',header=TRUE)
a<-table.element(a,'P-value',header=TRUE)
a<-table.row.end(a)
for (i in 2:(par1+1)) {
a<-table.row.start(a)
a<-table.element(a,i-1,header=TRUE)
a<-table.element(a,round(myacf[i],6))
mytstat <- myacf[i]*sqrtn
a<-table.element(a,round(mytstat,4))
a<-table.element(a,round(1-pt(abs(mytstat),lengthx),6))
a<-table.row.end(a)
}
a<-table.end(a)
table.save(a,file='mytable.tab')
a<-table.start()
a<-table.row.start(a)
a<-table.element(a,'Partial Autocorrelation Function',4,TRUE)
a<-table.row.end(a)
a<-table.row.start(a)
a<-table.element(a,'Time lag k',header=TRUE)
a<-table.element(a,hyperlink('basics.htm','PACF(k)','click here for more information about the Partial Autocorrelation Function'),header=TRUE)
a<-table.element(a,'T-STAT',header=TRUE)
a<-table.element(a,'P-value',header=TRUE)
a<-table.row.end(a)
for (i in 1:par1) {
a<-table.row.start(a)
a<-table.element(a,i,header=TRUE)
a<-table.element(a,round(mypacf[i],6))
mytstat <- mypacf[i]*sqrtn
a<-table.element(a,round(mytstat,4))
a<-table.element(a,round(1-pt(abs(mytstat),lengthx),6))
a<-table.row.end(a)
}
a<-table.end(a)
table.save(a,file='mytable1.tab')