Free Statistics

of Irreproducible Research!

Author's title

Author*Unverified author*
R Software Modulerwasp_autocorrelation.wasp
Title produced by software(Partial) Autocorrelation Function
Date of computationTue, 09 Dec 2008 04:28:46 -0700
Cite this page as followsStatistical Computations at FreeStatistics.org, Office for Research Development and Education, URL https://freestatistics.org/blog/index.php?v=date/2008/Dec/09/t1228822201coe1kq6tq57vikn.htm/, Retrieved Sat, 18 May 2024 05:54:05 +0000
Statistical Computations at FreeStatistics.org, Office for Research Development and Education, URL https://freestatistics.org/blog/index.php?pk=31305, Retrieved Sat, 18 May 2024 05:54:05 +0000
QR Codes:

Original text written by user:
IsPrivate?No (this computation is public)
User-defined keywords
Estimated Impact166
Family? (F = Feedback message, R = changed R code, M = changed R Module, P = changed Parameters, D = changed Data)
F       [(Partial) Autocorrelation Function] [Stefan Temmerman] [2008-12-09 11:28:46] [30f7cb12a8cb61e43b87da59ece37a2f] [Current]
Feedback Forum
2008-12-15 17:10:48 [Gert-Jan Geudens] [reply
Goede conclusie.
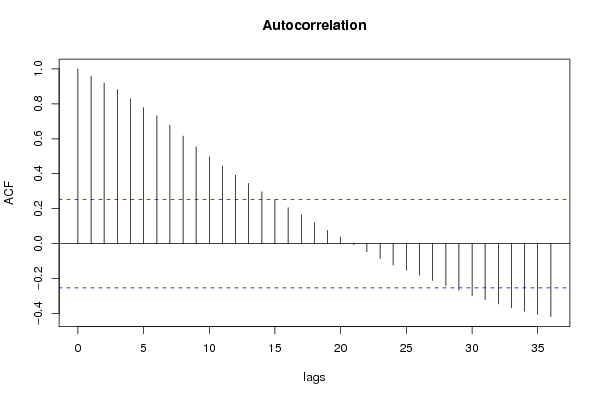
Een correlatiecoeffïenct is de weergave tussen een yt en yt met 1 periode opgeschoven. Als positieve coëfficiënten gevolgd worden door positieve en negatieve coëfficiënten door negatieve, dan is er sprake van autocorrelatie.

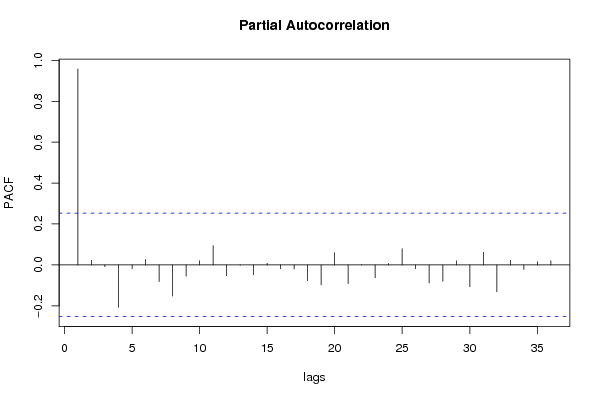
We zien hier inderdaad enkel een lineaire trend en dus moeten we enkel niet-seizonaal differentiëren.

Post a new message
Dataseries X:
10709
10662
10570
10297
10635
10872
10296
10383
10431
10574
10653
10805
10872
10625
10407
10463
10556
10646
10702
11353
11346
11451
11964
12574
13031
13812
14544
14931
14886
16005
17064
15168
16050
15839
15137
14954
15648
15305
15579
16348
15928
16171
15937
15713
15594
15683
16438
17032
17696
17745
19394
20148
20108
18584
18441
18391
19178
18079
18483
19644


Summary of computational transaction
Raw Inputview raw input (R code)
Raw Outputview raw output of R engine
Computing time1 seconds
R Server'Gwilym Jenkins' @ 72.249.127.135

\begin{tabular}{lllllllll}
\hline
Summary of computational transaction \tabularnewline
Raw Input & view raw input (R code)  \tabularnewline
Raw Output & view raw output of R engine  \tabularnewline
Computing time & 1 seconds \tabularnewline
R Server & 'Gwilym Jenkins' @ 72.249.127.135 \tabularnewline
\hline
\end{tabular}
%Source: https://freestatistics.org/blog/index.php?pk=31305&T=0

[TABLE]
[ROW][C]Summary of computational transaction[/C][/ROW]
[ROW][C]Raw Input[/C][C]view raw input (R code) [/C][/ROW]
[ROW][C]Raw Output[/C][C]view raw output of R engine [/C][/ROW]
[ROW][C]Computing time[/C][C]1 seconds[/C][/ROW]
[ROW][C]R Server[/C][C]'Gwilym Jenkins' @ 72.249.127.135[/C][/ROW]
[/TABLE]
Source: https://freestatistics.org/blog/index.php?pk=31305&T=0

Globally Unique Identifier (entire table): ba.freestatistics.org/blog/index.php?pk=31305&T=0

As an alternative you can also use a QR Code:  

The GUIDs for individual cells are displayed in the table below:

Summary of computational transaction
Raw Inputview raw input (R code)
Raw Outputview raw output of R engine
Computing time1 seconds
R Server'Gwilym Jenkins' @ 72.249.127.135


Autocorrelation Function
Time lag kACF(k)T-STATP-value
10.9579597.42030
20.9195347.12270
30.8818976.83110
40.8287986.41980
50.7778866.02550
60.731465.66590
70.6776145.24881e-06
80.615394.76686e-06
90.5544324.29463.2e-05
100.496013.84210.000148
110.4443963.44230.000528
120.3918313.03510.001776
130.3442122.66630.004921
140.2965862.29730.012552
150.2498571.93540.02883
160.2053511.59060.058473
170.1638641.26930.104621
180.1212040.93880.175789
190.0750490.58130.281599
200.0375760.29110.386004
21-0.006367-0.04930.480414
22-0.047053-0.36450.358395
23-0.085966-0.66590.254016
24-0.122857-0.95160.172547
25-0.152232-1.17920.12149
26-0.180575-1.39870.083521
27-0.210957-1.63410.053741
28-0.240842-1.86560.033498
29-0.266072-2.0610.021823
30-0.299226-2.31780.011944
31-0.320505-2.48260.007928
32-0.345766-2.67830.004767
33-0.367492-2.84660.00302
34-0.386994-2.99760.001977
35-0.405333-3.13970.001312
36-0.4185-3.24170.000971

\begin{tabular}{lllllllll}
\hline
Autocorrelation Function \tabularnewline
Time lag k & ACF(k) & T-STAT & P-value \tabularnewline
1 & 0.957959 & 7.4203 & 0 \tabularnewline
2 & 0.919534 & 7.1227 & 0 \tabularnewline
3 & 0.881897 & 6.8311 & 0 \tabularnewline
4 & 0.828798 & 6.4198 & 0 \tabularnewline
5 & 0.777886 & 6.0255 & 0 \tabularnewline
6 & 0.73146 & 5.6659 & 0 \tabularnewline
7 & 0.677614 & 5.2488 & 1e-06 \tabularnewline
8 & 0.61539 & 4.7668 & 6e-06 \tabularnewline
9 & 0.554432 & 4.2946 & 3.2e-05 \tabularnewline
10 & 0.49601 & 3.8421 & 0.000148 \tabularnewline
11 & 0.444396 & 3.4423 & 0.000528 \tabularnewline
12 & 0.391831 & 3.0351 & 0.001776 \tabularnewline
13 & 0.344212 & 2.6663 & 0.004921 \tabularnewline
14 & 0.296586 & 2.2973 & 0.012552 \tabularnewline
15 & 0.249857 & 1.9354 & 0.02883 \tabularnewline
16 & 0.205351 & 1.5906 & 0.058473 \tabularnewline
17 & 0.163864 & 1.2693 & 0.104621 \tabularnewline
18 & 0.121204 & 0.9388 & 0.175789 \tabularnewline
19 & 0.075049 & 0.5813 & 0.281599 \tabularnewline
20 & 0.037576 & 0.2911 & 0.386004 \tabularnewline
21 & -0.006367 & -0.0493 & 0.480414 \tabularnewline
22 & -0.047053 & -0.3645 & 0.358395 \tabularnewline
23 & -0.085966 & -0.6659 & 0.254016 \tabularnewline
24 & -0.122857 & -0.9516 & 0.172547 \tabularnewline
25 & -0.152232 & -1.1792 & 0.12149 \tabularnewline
26 & -0.180575 & -1.3987 & 0.083521 \tabularnewline
27 & -0.210957 & -1.6341 & 0.053741 \tabularnewline
28 & -0.240842 & -1.8656 & 0.033498 \tabularnewline
29 & -0.266072 & -2.061 & 0.021823 \tabularnewline
30 & -0.299226 & -2.3178 & 0.011944 \tabularnewline
31 & -0.320505 & -2.4826 & 0.007928 \tabularnewline
32 & -0.345766 & -2.6783 & 0.004767 \tabularnewline
33 & -0.367492 & -2.8466 & 0.00302 \tabularnewline
34 & -0.386994 & -2.9976 & 0.001977 \tabularnewline
35 & -0.405333 & -3.1397 & 0.001312 \tabularnewline
36 & -0.4185 & -3.2417 & 0.000971 \tabularnewline
\hline
\end{tabular}
%Source: https://freestatistics.org/blog/index.php?pk=31305&T=1

[TABLE]
[ROW][C]Autocorrelation Function[/C][/ROW]
[ROW][C]Time lag k[/C][C]ACF(k)[/C][C]T-STAT[/C][C]P-value[/C][/ROW]
[ROW][C]1[/C][C]0.957959[/C][C]7.4203[/C][C]0[/C][/ROW]
[ROW][C]2[/C][C]0.919534[/C][C]7.1227[/C][C]0[/C][/ROW]
[ROW][C]3[/C][C]0.881897[/C][C]6.8311[/C][C]0[/C][/ROW]
[ROW][C]4[/C][C]0.828798[/C][C]6.4198[/C][C]0[/C][/ROW]
[ROW][C]5[/C][C]0.777886[/C][C]6.0255[/C][C]0[/C][/ROW]
[ROW][C]6[/C][C]0.73146[/C][C]5.6659[/C][C]0[/C][/ROW]
[ROW][C]7[/C][C]0.677614[/C][C]5.2488[/C][C]1e-06[/C][/ROW]
[ROW][C]8[/C][C]0.61539[/C][C]4.7668[/C][C]6e-06[/C][/ROW]
[ROW][C]9[/C][C]0.554432[/C][C]4.2946[/C][C]3.2e-05[/C][/ROW]
[ROW][C]10[/C][C]0.49601[/C][C]3.8421[/C][C]0.000148[/C][/ROW]
[ROW][C]11[/C][C]0.444396[/C][C]3.4423[/C][C]0.000528[/C][/ROW]
[ROW][C]12[/C][C]0.391831[/C][C]3.0351[/C][C]0.001776[/C][/ROW]
[ROW][C]13[/C][C]0.344212[/C][C]2.6663[/C][C]0.004921[/C][/ROW]
[ROW][C]14[/C][C]0.296586[/C][C]2.2973[/C][C]0.012552[/C][/ROW]
[ROW][C]15[/C][C]0.249857[/C][C]1.9354[/C][C]0.02883[/C][/ROW]
[ROW][C]16[/C][C]0.205351[/C][C]1.5906[/C][C]0.058473[/C][/ROW]
[ROW][C]17[/C][C]0.163864[/C][C]1.2693[/C][C]0.104621[/C][/ROW]
[ROW][C]18[/C][C]0.121204[/C][C]0.9388[/C][C]0.175789[/C][/ROW]
[ROW][C]19[/C][C]0.075049[/C][C]0.5813[/C][C]0.281599[/C][/ROW]
[ROW][C]20[/C][C]0.037576[/C][C]0.2911[/C][C]0.386004[/C][/ROW]
[ROW][C]21[/C][C]-0.006367[/C][C]-0.0493[/C][C]0.480414[/C][/ROW]
[ROW][C]22[/C][C]-0.047053[/C][C]-0.3645[/C][C]0.358395[/C][/ROW]
[ROW][C]23[/C][C]-0.085966[/C][C]-0.6659[/C][C]0.254016[/C][/ROW]
[ROW][C]24[/C][C]-0.122857[/C][C]-0.9516[/C][C]0.172547[/C][/ROW]
[ROW][C]25[/C][C]-0.152232[/C][C]-1.1792[/C][C]0.12149[/C][/ROW]
[ROW][C]26[/C][C]-0.180575[/C][C]-1.3987[/C][C]0.083521[/C][/ROW]
[ROW][C]27[/C][C]-0.210957[/C][C]-1.6341[/C][C]0.053741[/C][/ROW]
[ROW][C]28[/C][C]-0.240842[/C][C]-1.8656[/C][C]0.033498[/C][/ROW]
[ROW][C]29[/C][C]-0.266072[/C][C]-2.061[/C][C]0.021823[/C][/ROW]
[ROW][C]30[/C][C]-0.299226[/C][C]-2.3178[/C][C]0.011944[/C][/ROW]
[ROW][C]31[/C][C]-0.320505[/C][C]-2.4826[/C][C]0.007928[/C][/ROW]
[ROW][C]32[/C][C]-0.345766[/C][C]-2.6783[/C][C]0.004767[/C][/ROW]
[ROW][C]33[/C][C]-0.367492[/C][C]-2.8466[/C][C]0.00302[/C][/ROW]
[ROW][C]34[/C][C]-0.386994[/C][C]-2.9976[/C][C]0.001977[/C][/ROW]
[ROW][C]35[/C][C]-0.405333[/C][C]-3.1397[/C][C]0.001312[/C][/ROW]
[ROW][C]36[/C][C]-0.4185[/C][C]-3.2417[/C][C]0.000971[/C][/ROW]
[/TABLE]
Source: https://freestatistics.org/blog/index.php?pk=31305&T=1

Globally Unique Identifier (entire table): ba.freestatistics.org/blog/index.php?pk=31305&T=1

As an alternative you can also use a QR Code:  

The GUIDs for individual cells are displayed in the table below:

Autocorrelation Function
Time lag kACF(k)T-STATP-value
10.9579597.42030
20.9195347.12270
30.8818976.83110
40.8287986.41980
50.7778866.02550
60.731465.66590
70.6776145.24881e-06
80.615394.76686e-06
90.5544324.29463.2e-05
100.496013.84210.000148
110.4443963.44230.000528
120.3918313.03510.001776
130.3442122.66630.004921
140.2965862.29730.012552
150.2498571.93540.02883
160.2053511.59060.058473
170.1638641.26930.104621
180.1212040.93880.175789
190.0750490.58130.281599
200.0375760.29110.386004
21-0.006367-0.04930.480414
22-0.047053-0.36450.358395
23-0.085966-0.66590.254016
24-0.122857-0.95160.172547
25-0.152232-1.17920.12149
26-0.180575-1.39870.083521
27-0.210957-1.63410.053741
28-0.240842-1.86560.033498
29-0.266072-2.0610.021823
30-0.299226-2.31780.011944
31-0.320505-2.48260.007928
32-0.345766-2.67830.004767
33-0.367492-2.84660.00302
34-0.386994-2.99760.001977
35-0.405333-3.13970.001312
36-0.4185-3.24170.000971


Partial Autocorrelation Function
Time lag kPACF(k)T-STATP-value
10.9579597.42030
20.0224520.17390.431261
3-0.008621-0.06680.47349
4-0.207095-1.60410.056966
5-0.01865-0.14450.442811
60.0259460.2010.420697
7-0.081454-0.63090.265237
8-0.152396-1.18050.121238
9-0.05502-0.42620.33575
100.020860.16160.436089
110.0938750.72720.234979
12-0.05255-0.40710.34271
13-0.001803-0.0140.494452
14-0.048592-0.37640.353977
150.007540.05840.47681
16-0.018959-0.14690.441868
17-0.020027-0.15510.438622
18-0.077974-0.6040.274065
19-0.097396-0.75440.226772
200.0599650.46450.321989
21-0.091225-0.70660.241266
220.0007910.00610.497566
23-0.063187-0.48940.313156
240.0073380.05680.47743
250.0791810.61330.270986
26-0.018628-0.14430.442878
27-0.088536-0.68580.247741
28-0.080109-0.62050.268631
290.0197760.15320.439384
30-0.106957-0.82850.205339
310.062120.48120.316071
32-0.131619-1.01950.156026
330.0223390.1730.431602
34-0.02232-0.17290.43166
350.0157260.12180.451727
360.0206790.16020.43664

\begin{tabular}{lllllllll}
\hline
Partial Autocorrelation Function \tabularnewline
Time lag k & PACF(k) & T-STAT & P-value \tabularnewline
1 & 0.957959 & 7.4203 & 0 \tabularnewline
2 & 0.022452 & 0.1739 & 0.431261 \tabularnewline
3 & -0.008621 & -0.0668 & 0.47349 \tabularnewline
4 & -0.207095 & -1.6041 & 0.056966 \tabularnewline
5 & -0.01865 & -0.1445 & 0.442811 \tabularnewline
6 & 0.025946 & 0.201 & 0.420697 \tabularnewline
7 & -0.081454 & -0.6309 & 0.265237 \tabularnewline
8 & -0.152396 & -1.1805 & 0.121238 \tabularnewline
9 & -0.05502 & -0.4262 & 0.33575 \tabularnewline
10 & 0.02086 & 0.1616 & 0.436089 \tabularnewline
11 & 0.093875 & 0.7272 & 0.234979 \tabularnewline
12 & -0.05255 & -0.4071 & 0.34271 \tabularnewline
13 & -0.001803 & -0.014 & 0.494452 \tabularnewline
14 & -0.048592 & -0.3764 & 0.353977 \tabularnewline
15 & 0.00754 & 0.0584 & 0.47681 \tabularnewline
16 & -0.018959 & -0.1469 & 0.441868 \tabularnewline
17 & -0.020027 & -0.1551 & 0.438622 \tabularnewline
18 & -0.077974 & -0.604 & 0.274065 \tabularnewline
19 & -0.097396 & -0.7544 & 0.226772 \tabularnewline
20 & 0.059965 & 0.4645 & 0.321989 \tabularnewline
21 & -0.091225 & -0.7066 & 0.241266 \tabularnewline
22 & 0.000791 & 0.0061 & 0.497566 \tabularnewline
23 & -0.063187 & -0.4894 & 0.313156 \tabularnewline
24 & 0.007338 & 0.0568 & 0.47743 \tabularnewline
25 & 0.079181 & 0.6133 & 0.270986 \tabularnewline
26 & -0.018628 & -0.1443 & 0.442878 \tabularnewline
27 & -0.088536 & -0.6858 & 0.247741 \tabularnewline
28 & -0.080109 & -0.6205 & 0.268631 \tabularnewline
29 & 0.019776 & 0.1532 & 0.439384 \tabularnewline
30 & -0.106957 & -0.8285 & 0.205339 \tabularnewline
31 & 0.06212 & 0.4812 & 0.316071 \tabularnewline
32 & -0.131619 & -1.0195 & 0.156026 \tabularnewline
33 & 0.022339 & 0.173 & 0.431602 \tabularnewline
34 & -0.02232 & -0.1729 & 0.43166 \tabularnewline
35 & 0.015726 & 0.1218 & 0.451727 \tabularnewline
36 & 0.020679 & 0.1602 & 0.43664 \tabularnewline
\hline
\end{tabular}
%Source: https://freestatistics.org/blog/index.php?pk=31305&T=2

[TABLE]
[ROW][C]Partial Autocorrelation Function[/C][/ROW]
[ROW][C]Time lag k[/C][C]PACF(k)[/C][C]T-STAT[/C][C]P-value[/C][/ROW]
[ROW][C]1[/C][C]0.957959[/C][C]7.4203[/C][C]0[/C][/ROW]
[ROW][C]2[/C][C]0.022452[/C][C]0.1739[/C][C]0.431261[/C][/ROW]
[ROW][C]3[/C][C]-0.008621[/C][C]-0.0668[/C][C]0.47349[/C][/ROW]
[ROW][C]4[/C][C]-0.207095[/C][C]-1.6041[/C][C]0.056966[/C][/ROW]
[ROW][C]5[/C][C]-0.01865[/C][C]-0.1445[/C][C]0.442811[/C][/ROW]
[ROW][C]6[/C][C]0.025946[/C][C]0.201[/C][C]0.420697[/C][/ROW]
[ROW][C]7[/C][C]-0.081454[/C][C]-0.6309[/C][C]0.265237[/C][/ROW]
[ROW][C]8[/C][C]-0.152396[/C][C]-1.1805[/C][C]0.121238[/C][/ROW]
[ROW][C]9[/C][C]-0.05502[/C][C]-0.4262[/C][C]0.33575[/C][/ROW]
[ROW][C]10[/C][C]0.02086[/C][C]0.1616[/C][C]0.436089[/C][/ROW]
[ROW][C]11[/C][C]0.093875[/C][C]0.7272[/C][C]0.234979[/C][/ROW]
[ROW][C]12[/C][C]-0.05255[/C][C]-0.4071[/C][C]0.34271[/C][/ROW]
[ROW][C]13[/C][C]-0.001803[/C][C]-0.014[/C][C]0.494452[/C][/ROW]
[ROW][C]14[/C][C]-0.048592[/C][C]-0.3764[/C][C]0.353977[/C][/ROW]
[ROW][C]15[/C][C]0.00754[/C][C]0.0584[/C][C]0.47681[/C][/ROW]
[ROW][C]16[/C][C]-0.018959[/C][C]-0.1469[/C][C]0.441868[/C][/ROW]
[ROW][C]17[/C][C]-0.020027[/C][C]-0.1551[/C][C]0.438622[/C][/ROW]
[ROW][C]18[/C][C]-0.077974[/C][C]-0.604[/C][C]0.274065[/C][/ROW]
[ROW][C]19[/C][C]-0.097396[/C][C]-0.7544[/C][C]0.226772[/C][/ROW]
[ROW][C]20[/C][C]0.059965[/C][C]0.4645[/C][C]0.321989[/C][/ROW]
[ROW][C]21[/C][C]-0.091225[/C][C]-0.7066[/C][C]0.241266[/C][/ROW]
[ROW][C]22[/C][C]0.000791[/C][C]0.0061[/C][C]0.497566[/C][/ROW]
[ROW][C]23[/C][C]-0.063187[/C][C]-0.4894[/C][C]0.313156[/C][/ROW]
[ROW][C]24[/C][C]0.007338[/C][C]0.0568[/C][C]0.47743[/C][/ROW]
[ROW][C]25[/C][C]0.079181[/C][C]0.6133[/C][C]0.270986[/C][/ROW]
[ROW][C]26[/C][C]-0.018628[/C][C]-0.1443[/C][C]0.442878[/C][/ROW]
[ROW][C]27[/C][C]-0.088536[/C][C]-0.6858[/C][C]0.247741[/C][/ROW]
[ROW][C]28[/C][C]-0.080109[/C][C]-0.6205[/C][C]0.268631[/C][/ROW]
[ROW][C]29[/C][C]0.019776[/C][C]0.1532[/C][C]0.439384[/C][/ROW]
[ROW][C]30[/C][C]-0.106957[/C][C]-0.8285[/C][C]0.205339[/C][/ROW]
[ROW][C]31[/C][C]0.06212[/C][C]0.4812[/C][C]0.316071[/C][/ROW]
[ROW][C]32[/C][C]-0.131619[/C][C]-1.0195[/C][C]0.156026[/C][/ROW]
[ROW][C]33[/C][C]0.022339[/C][C]0.173[/C][C]0.431602[/C][/ROW]
[ROW][C]34[/C][C]-0.02232[/C][C]-0.1729[/C][C]0.43166[/C][/ROW]
[ROW][C]35[/C][C]0.015726[/C][C]0.1218[/C][C]0.451727[/C][/ROW]
[ROW][C]36[/C][C]0.020679[/C][C]0.1602[/C][C]0.43664[/C][/ROW]
[/TABLE]
Source: https://freestatistics.org/blog/index.php?pk=31305&T=2

Globally Unique Identifier (entire table): ba.freestatistics.org/blog/index.php?pk=31305&T=2

As an alternative you can also use a QR Code:  

The GUIDs for individual cells are displayed in the table below:

Partial Autocorrelation Function
Time lag kPACF(k)T-STATP-value
10.9579597.42030
20.0224520.17390.431261
3-0.008621-0.06680.47349
4-0.207095-1.60410.056966
5-0.01865-0.14450.442811
60.0259460.2010.420697
7-0.081454-0.63090.265237
8-0.152396-1.18050.121238
9-0.05502-0.42620.33575
100.020860.16160.436089
110.0938750.72720.234979
12-0.05255-0.40710.34271
13-0.001803-0.0140.494452
14-0.048592-0.37640.353977
150.007540.05840.47681
16-0.018959-0.14690.441868
17-0.020027-0.15510.438622
18-0.077974-0.6040.274065
19-0.097396-0.75440.226772
200.0599650.46450.321989
21-0.091225-0.70660.241266
220.0007910.00610.497566
23-0.063187-0.48940.313156
240.0073380.05680.47743
250.0791810.61330.270986
26-0.018628-0.14430.442878
27-0.088536-0.68580.247741
28-0.080109-0.62050.268631
290.0197760.15320.439384
30-0.106957-0.82850.205339
310.062120.48120.316071
32-0.131619-1.01950.156026
330.0223390.1730.431602
34-0.02232-0.17290.43166
350.0157260.12180.451727
360.0206790.16020.43664


Parameters (Session):
par1 = 36 ; par2 = -0.5 ; par3 = 0 ; par4 = 0 ; par5 = 12 ;
Parameters (R input):
par1 = 36 ; par2 = -0.5 ; par3 = 0 ; par4 = 0 ; par5 = 12 ;
R code (references can be found in the software module):
if (par1 == 'Default') {
par1 = 10*log10(length(x))
} else {
par1 <- as.numeric(par1)
}
par2 <- as.numeric(par2)
par3 <- as.numeric(par3)
par4 <- as.numeric(par4)
par5 <- as.numeric(par5)
if (par2 == 0) {
x <- log(x)
} else {
x <- (x ^ par2 - 1) / par2
}
if (par3 > 0) x <- diff(x,lag=1,difference=par3)
if (par4 > 0) x <- diff(x,lag=par5,difference=par4)
bitmap(file='pic1.png')
racf <- acf(x,par1,main='Autocorrelation',xlab='lags',ylab='ACF')
dev.off()
bitmap(file='pic2.png')
rpacf <- pacf(x,par1,main='Partial Autocorrelation',xlab='lags',ylab='PACF')
dev.off()
(myacf <- c(racf$acf))
(mypacf <- c(rpacf$acf))
lengthx <- length(x)
sqrtn <- sqrt(lengthx)
load(file='createtable')
a<-table.start()
a<-table.row.start(a)
a<-table.element(a,'Autocorrelation Function',4,TRUE)
a<-table.row.end(a)
a<-table.row.start(a)
a<-table.element(a,'Time lag k',header=TRUE)
a<-table.element(a,hyperlink('basics.htm','ACF(k)','click here for more information about the Autocorrelation Function'),header=TRUE)
a<-table.element(a,'T-STAT',header=TRUE)
a<-table.element(a,'P-value',header=TRUE)
a<-table.row.end(a)
for (i in 2:(par1+1)) {
a<-table.row.start(a)
a<-table.element(a,i-1,header=TRUE)
a<-table.element(a,round(myacf[i],6))
mytstat <- myacf[i]*sqrtn
a<-table.element(a,round(mytstat,4))
a<-table.element(a,round(1-pt(abs(mytstat),lengthx),6))
a<-table.row.end(a)
}
a<-table.end(a)
table.save(a,file='mytable.tab')
a<-table.start()
a<-table.row.start(a)
a<-table.element(a,'Partial Autocorrelation Function',4,TRUE)
a<-table.row.end(a)
a<-table.row.start(a)
a<-table.element(a,'Time lag k',header=TRUE)
a<-table.element(a,hyperlink('basics.htm','PACF(k)','click here for more information about the Partial Autocorrelation Function'),header=TRUE)
a<-table.element(a,'T-STAT',header=TRUE)
a<-table.element(a,'P-value',header=TRUE)
a<-table.row.end(a)
for (i in 1:par1) {
a<-table.row.start(a)
a<-table.element(a,i,header=TRUE)
a<-table.element(a,round(mypacf[i],6))
mytstat <- mypacf[i]*sqrtn
a<-table.element(a,round(mytstat,4))
a<-table.element(a,round(1-pt(abs(mytstat),lengthx),6))
a<-table.row.end(a)
}
a<-table.end(a)
table.save(a,file='mytable1.tab')