Free Statistics

of Irreproducible Research!

Author's title

Author*Unverified author*
R Software Modulerwasp_autocorrelation.wasp
Title produced by software(Partial) Autocorrelation Function
Date of computationTue, 09 Dec 2008 17:28:55 -0700
Cite this page as followsStatistical Computations at FreeStatistics.org, Office for Research Development and Education, URL https://freestatistics.org/blog/index.php?v=date/2008/Dec/10/t1228868985ml1f4eljxqmudtt.htm/, Retrieved Sat, 18 May 2024 04:06:34 +0000
Statistical Computations at FreeStatistics.org, Office for Research Development and Education, URL https://freestatistics.org/blog/index.php?pk=31856, Retrieved Sat, 18 May 2024 04:06:34 +0000
QR Codes:

Original text written by user:
IsPrivate?No (this computation is public)
User-defined keywords
Estimated Impact206
Family? (F = Feedback message, R = changed R code, M = changed R Module, P = changed Parameters, D = changed Data)
F       [(Partial) Autocorrelation Function] [Step 2 ACF eigen ...] [2008-12-10 00:28:55] [9f72e095d5529918bf5b0810c01bf6ce] [Current]
Feedback Forum
2008-12-16 18:07:28 [Julian De Ruyter] [reply
Juiste berekening en conclusie

Post a new message
Dataseries X:
1.1372
1.1139
1.1222
1.1692
1.1702
1.2286
1.2613
1.2646
1.2262
1.1985
1.2007
1.2138
1.2266
1.2176
1.2218
1.249
1.2991
1.3408
1.3119
1.3014
1.3201
1.2938
1.2694
1.2165
1.2037
1.2292
1.2256
1.2015
1.1786
1.1856
1.2103
1.1938
1.202
1.2271
1.277
1.265
1.2684
1.2811
1.2727
1.2611
1.2881
1.3213
1.2999
1.3074
1.3242
1.3516
1.3511
1.3419
1.3716
1.3622
1.3896
1.4227
1.4684
1.457
1.4718
1.4748
1.5527
1.575
1.5557
1.5553
1.577


Summary of computational transaction
Raw Inputview raw input (R code)
Raw Outputview raw output of R engine
Computing time2 seconds
R Server'Gwilym Jenkins' @ 72.249.127.135

\begin{tabular}{lllllllll}
\hline
Summary of computational transaction \tabularnewline
Raw Input & view raw input (R code)  \tabularnewline
Raw Output & view raw output of R engine  \tabularnewline
Computing time & 2 seconds \tabularnewline
R Server & 'Gwilym Jenkins' @ 72.249.127.135 \tabularnewline
\hline
\end{tabular}
%Source: https://freestatistics.org/blog/index.php?pk=31856&T=0

[TABLE]
[ROW][C]Summary of computational transaction[/C][/ROW]
[ROW][C]Raw Input[/C][C]view raw input (R code) [/C][/ROW]
[ROW][C]Raw Output[/C][C]view raw output of R engine [/C][/ROW]
[ROW][C]Computing time[/C][C]2 seconds[/C][/ROW]
[ROW][C]R Server[/C][C]'Gwilym Jenkins' @ 72.249.127.135[/C][/ROW]
[/TABLE]
Source: https://freestatistics.org/blog/index.php?pk=31856&T=0

Globally Unique Identifier (entire table): ba.freestatistics.org/blog/index.php?pk=31856&T=0

As an alternative you can also use a QR Code:  

The GUIDs for individual cells are displayed in the table below:

Summary of computational transaction
Raw Inputview raw input (R code)
Raw Outputview raw output of R engine
Computing time2 seconds
R Server'Gwilym Jenkins' @ 72.249.127.135


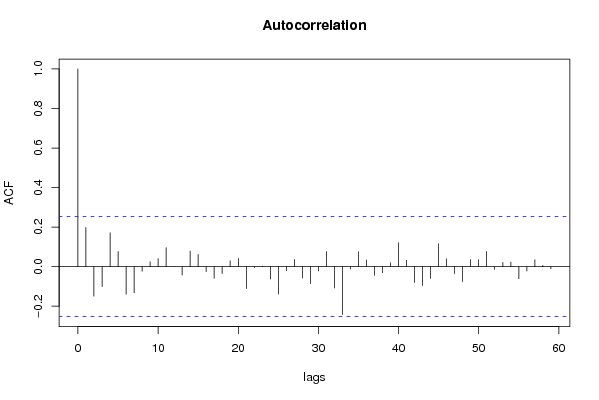
Autocorrelation Function
Time lag kACF(k)T-STATP-value
10.1975541.53020.065606
2-0.149501-1.1580.125721
3-0.100594-0.77920.219464
40.1711671.32590.094957
50.0762750.59080.27843
6-0.139726-1.08230.141722
7-0.132221-1.02420.154931
8-0.02363-0.1830.427692
90.0242580.18790.425792
100.0405060.31380.377396
110.0956430.74080.230839
120.0001119e-040.499659
13-0.042916-0.33240.370363
140.0786870.60950.272244
150.0619940.48020.316416
16-0.025025-0.19380.423477
17-0.059212-0.45870.324069
18-0.035241-0.2730.392903
190.029740.23040.409297
200.0415170.32160.37444
21-0.111108-0.86060.196432
22-0.004285-0.03320.486817
230.0021550.01670.493368
24-0.062831-0.48670.314126
25-0.138993-1.07660.142977
26-0.020801-0.16110.43627
270.0361930.28030.390088
28-0.05717-0.44280.329739
29-0.085381-0.66140.255456
30-0.021557-0.1670.433974
310.0761780.59010.278679
32-0.107776-0.83480.203563
33-0.241859-1.87340.032941
34-0.011423-0.08850.464894
350.075170.58230.281286
360.0329760.25540.399633
37-0.044881-0.34770.36466
38-0.031474-0.24380.404109
390.0201550.15610.438232
400.1212980.93960.175603
410.0328950.25480.399874
42-0.08086-0.62630.266734
43-0.095655-0.74090.230809
44-0.058842-0.45580.325095
450.1152380.89260.18781
460.0394580.30560.380468
47-0.035022-0.27130.393553
48-0.075769-0.58690.279736
490.0353610.27390.39255
500.0346650.26850.394611
510.0770820.59710.276352
52-0.01442-0.11170.455718
530.0215250.16670.43407
540.0234220.18140.428323
55-0.060747-0.47050.319835
56-0.022134-0.17140.432225
570.0345880.26790.394842
580.0062920.04870.480646
59-0.011046-0.08560.46605
60NANANA

\begin{tabular}{lllllllll}
\hline
Autocorrelation Function \tabularnewline
Time lag k & ACF(k) & T-STAT & P-value \tabularnewline
1 & 0.197554 & 1.5302 & 0.065606 \tabularnewline
2 & -0.149501 & -1.158 & 0.125721 \tabularnewline
3 & -0.100594 & -0.7792 & 0.219464 \tabularnewline
4 & 0.171167 & 1.3259 & 0.094957 \tabularnewline
5 & 0.076275 & 0.5908 & 0.27843 \tabularnewline
6 & -0.139726 & -1.0823 & 0.141722 \tabularnewline
7 & -0.132221 & -1.0242 & 0.154931 \tabularnewline
8 & -0.02363 & -0.183 & 0.427692 \tabularnewline
9 & 0.024258 & 0.1879 & 0.425792 \tabularnewline
10 & 0.040506 & 0.3138 & 0.377396 \tabularnewline
11 & 0.095643 & 0.7408 & 0.230839 \tabularnewline
12 & 0.000111 & 9e-04 & 0.499659 \tabularnewline
13 & -0.042916 & -0.3324 & 0.370363 \tabularnewline
14 & 0.078687 & 0.6095 & 0.272244 \tabularnewline
15 & 0.061994 & 0.4802 & 0.316416 \tabularnewline
16 & -0.025025 & -0.1938 & 0.423477 \tabularnewline
17 & -0.059212 & -0.4587 & 0.324069 \tabularnewline
18 & -0.035241 & -0.273 & 0.392903 \tabularnewline
19 & 0.02974 & 0.2304 & 0.409297 \tabularnewline
20 & 0.041517 & 0.3216 & 0.37444 \tabularnewline
21 & -0.111108 & -0.8606 & 0.196432 \tabularnewline
22 & -0.004285 & -0.0332 & 0.486817 \tabularnewline
23 & 0.002155 & 0.0167 & 0.493368 \tabularnewline
24 & -0.062831 & -0.4867 & 0.314126 \tabularnewline
25 & -0.138993 & -1.0766 & 0.142977 \tabularnewline
26 & -0.020801 & -0.1611 & 0.43627 \tabularnewline
27 & 0.036193 & 0.2803 & 0.390088 \tabularnewline
28 & -0.05717 & -0.4428 & 0.329739 \tabularnewline
29 & -0.085381 & -0.6614 & 0.255456 \tabularnewline
30 & -0.021557 & -0.167 & 0.433974 \tabularnewline
31 & 0.076178 & 0.5901 & 0.278679 \tabularnewline
32 & -0.107776 & -0.8348 & 0.203563 \tabularnewline
33 & -0.241859 & -1.8734 & 0.032941 \tabularnewline
34 & -0.011423 & -0.0885 & 0.464894 \tabularnewline
35 & 0.07517 & 0.5823 & 0.281286 \tabularnewline
36 & 0.032976 & 0.2554 & 0.399633 \tabularnewline
37 & -0.044881 & -0.3477 & 0.36466 \tabularnewline
38 & -0.031474 & -0.2438 & 0.404109 \tabularnewline
39 & 0.020155 & 0.1561 & 0.438232 \tabularnewline
40 & 0.121298 & 0.9396 & 0.175603 \tabularnewline
41 & 0.032895 & 0.2548 & 0.399874 \tabularnewline
42 & -0.08086 & -0.6263 & 0.266734 \tabularnewline
43 & -0.095655 & -0.7409 & 0.230809 \tabularnewline
44 & -0.058842 & -0.4558 & 0.325095 \tabularnewline
45 & 0.115238 & 0.8926 & 0.18781 \tabularnewline
46 & 0.039458 & 0.3056 & 0.380468 \tabularnewline
47 & -0.035022 & -0.2713 & 0.393553 \tabularnewline
48 & -0.075769 & -0.5869 & 0.279736 \tabularnewline
49 & 0.035361 & 0.2739 & 0.39255 \tabularnewline
50 & 0.034665 & 0.2685 & 0.394611 \tabularnewline
51 & 0.077082 & 0.5971 & 0.276352 \tabularnewline
52 & -0.01442 & -0.1117 & 0.455718 \tabularnewline
53 & 0.021525 & 0.1667 & 0.43407 \tabularnewline
54 & 0.023422 & 0.1814 & 0.428323 \tabularnewline
55 & -0.060747 & -0.4705 & 0.319835 \tabularnewline
56 & -0.022134 & -0.1714 & 0.432225 \tabularnewline
57 & 0.034588 & 0.2679 & 0.394842 \tabularnewline
58 & 0.006292 & 0.0487 & 0.480646 \tabularnewline
59 & -0.011046 & -0.0856 & 0.46605 \tabularnewline
60 & NA & NA & NA \tabularnewline
\hline
\end{tabular}
%Source: https://freestatistics.org/blog/index.php?pk=31856&T=1

[TABLE]
[ROW][C]Autocorrelation Function[/C][/ROW]
[ROW][C]Time lag k[/C][C]ACF(k)[/C][C]T-STAT[/C][C]P-value[/C][/ROW]
[ROW][C]1[/C][C]0.197554[/C][C]1.5302[/C][C]0.065606[/C][/ROW]
[ROW][C]2[/C][C]-0.149501[/C][C]-1.158[/C][C]0.125721[/C][/ROW]
[ROW][C]3[/C][C]-0.100594[/C][C]-0.7792[/C][C]0.219464[/C][/ROW]
[ROW][C]4[/C][C]0.171167[/C][C]1.3259[/C][C]0.094957[/C][/ROW]
[ROW][C]5[/C][C]0.076275[/C][C]0.5908[/C][C]0.27843[/C][/ROW]
[ROW][C]6[/C][C]-0.139726[/C][C]-1.0823[/C][C]0.141722[/C][/ROW]
[ROW][C]7[/C][C]-0.132221[/C][C]-1.0242[/C][C]0.154931[/C][/ROW]
[ROW][C]8[/C][C]-0.02363[/C][C]-0.183[/C][C]0.427692[/C][/ROW]
[ROW][C]9[/C][C]0.024258[/C][C]0.1879[/C][C]0.425792[/C][/ROW]
[ROW][C]10[/C][C]0.040506[/C][C]0.3138[/C][C]0.377396[/C][/ROW]
[ROW][C]11[/C][C]0.095643[/C][C]0.7408[/C][C]0.230839[/C][/ROW]
[ROW][C]12[/C][C]0.000111[/C][C]9e-04[/C][C]0.499659[/C][/ROW]
[ROW][C]13[/C][C]-0.042916[/C][C]-0.3324[/C][C]0.370363[/C][/ROW]
[ROW][C]14[/C][C]0.078687[/C][C]0.6095[/C][C]0.272244[/C][/ROW]
[ROW][C]15[/C][C]0.061994[/C][C]0.4802[/C][C]0.316416[/C][/ROW]
[ROW][C]16[/C][C]-0.025025[/C][C]-0.1938[/C][C]0.423477[/C][/ROW]
[ROW][C]17[/C][C]-0.059212[/C][C]-0.4587[/C][C]0.324069[/C][/ROW]
[ROW][C]18[/C][C]-0.035241[/C][C]-0.273[/C][C]0.392903[/C][/ROW]
[ROW][C]19[/C][C]0.02974[/C][C]0.2304[/C][C]0.409297[/C][/ROW]
[ROW][C]20[/C][C]0.041517[/C][C]0.3216[/C][C]0.37444[/C][/ROW]
[ROW][C]21[/C][C]-0.111108[/C][C]-0.8606[/C][C]0.196432[/C][/ROW]
[ROW][C]22[/C][C]-0.004285[/C][C]-0.0332[/C][C]0.486817[/C][/ROW]
[ROW][C]23[/C][C]0.002155[/C][C]0.0167[/C][C]0.493368[/C][/ROW]
[ROW][C]24[/C][C]-0.062831[/C][C]-0.4867[/C][C]0.314126[/C][/ROW]
[ROW][C]25[/C][C]-0.138993[/C][C]-1.0766[/C][C]0.142977[/C][/ROW]
[ROW][C]26[/C][C]-0.020801[/C][C]-0.1611[/C][C]0.43627[/C][/ROW]
[ROW][C]27[/C][C]0.036193[/C][C]0.2803[/C][C]0.390088[/C][/ROW]
[ROW][C]28[/C][C]-0.05717[/C][C]-0.4428[/C][C]0.329739[/C][/ROW]
[ROW][C]29[/C][C]-0.085381[/C][C]-0.6614[/C][C]0.255456[/C][/ROW]
[ROW][C]30[/C][C]-0.021557[/C][C]-0.167[/C][C]0.433974[/C][/ROW]
[ROW][C]31[/C][C]0.076178[/C][C]0.5901[/C][C]0.278679[/C][/ROW]
[ROW][C]32[/C][C]-0.107776[/C][C]-0.8348[/C][C]0.203563[/C][/ROW]
[ROW][C]33[/C][C]-0.241859[/C][C]-1.8734[/C][C]0.032941[/C][/ROW]
[ROW][C]34[/C][C]-0.011423[/C][C]-0.0885[/C][C]0.464894[/C][/ROW]
[ROW][C]35[/C][C]0.07517[/C][C]0.5823[/C][C]0.281286[/C][/ROW]
[ROW][C]36[/C][C]0.032976[/C][C]0.2554[/C][C]0.399633[/C][/ROW]
[ROW][C]37[/C][C]-0.044881[/C][C]-0.3477[/C][C]0.36466[/C][/ROW]
[ROW][C]38[/C][C]-0.031474[/C][C]-0.2438[/C][C]0.404109[/C][/ROW]
[ROW][C]39[/C][C]0.020155[/C][C]0.1561[/C][C]0.438232[/C][/ROW]
[ROW][C]40[/C][C]0.121298[/C][C]0.9396[/C][C]0.175603[/C][/ROW]
[ROW][C]41[/C][C]0.032895[/C][C]0.2548[/C][C]0.399874[/C][/ROW]
[ROW][C]42[/C][C]-0.08086[/C][C]-0.6263[/C][C]0.266734[/C][/ROW]
[ROW][C]43[/C][C]-0.095655[/C][C]-0.7409[/C][C]0.230809[/C][/ROW]
[ROW][C]44[/C][C]-0.058842[/C][C]-0.4558[/C][C]0.325095[/C][/ROW]
[ROW][C]45[/C][C]0.115238[/C][C]0.8926[/C][C]0.18781[/C][/ROW]
[ROW][C]46[/C][C]0.039458[/C][C]0.3056[/C][C]0.380468[/C][/ROW]
[ROW][C]47[/C][C]-0.035022[/C][C]-0.2713[/C][C]0.393553[/C][/ROW]
[ROW][C]48[/C][C]-0.075769[/C][C]-0.5869[/C][C]0.279736[/C][/ROW]
[ROW][C]49[/C][C]0.035361[/C][C]0.2739[/C][C]0.39255[/C][/ROW]
[ROW][C]50[/C][C]0.034665[/C][C]0.2685[/C][C]0.394611[/C][/ROW]
[ROW][C]51[/C][C]0.077082[/C][C]0.5971[/C][C]0.276352[/C][/ROW]
[ROW][C]52[/C][C]-0.01442[/C][C]-0.1117[/C][C]0.455718[/C][/ROW]
[ROW][C]53[/C][C]0.021525[/C][C]0.1667[/C][C]0.43407[/C][/ROW]
[ROW][C]54[/C][C]0.023422[/C][C]0.1814[/C][C]0.428323[/C][/ROW]
[ROW][C]55[/C][C]-0.060747[/C][C]-0.4705[/C][C]0.319835[/C][/ROW]
[ROW][C]56[/C][C]-0.022134[/C][C]-0.1714[/C][C]0.432225[/C][/ROW]
[ROW][C]57[/C][C]0.034588[/C][C]0.2679[/C][C]0.394842[/C][/ROW]
[ROW][C]58[/C][C]0.006292[/C][C]0.0487[/C][C]0.480646[/C][/ROW]
[ROW][C]59[/C][C]-0.011046[/C][C]-0.0856[/C][C]0.46605[/C][/ROW]
[ROW][C]60[/C][C]NA[/C][C]NA[/C][C]NA[/C][/ROW]
[/TABLE]
Source: https://freestatistics.org/blog/index.php?pk=31856&T=1

Globally Unique Identifier (entire table): ba.freestatistics.org/blog/index.php?pk=31856&T=1

As an alternative you can also use a QR Code:  

The GUIDs for individual cells are displayed in the table below:

Autocorrelation Function
Time lag kACF(k)T-STATP-value
10.1975541.53020.065606
2-0.149501-1.1580.125721
3-0.100594-0.77920.219464
40.1711671.32590.094957
50.0762750.59080.27843
6-0.139726-1.08230.141722
7-0.132221-1.02420.154931
8-0.02363-0.1830.427692
90.0242580.18790.425792
100.0405060.31380.377396
110.0956430.74080.230839
120.0001119e-040.499659
13-0.042916-0.33240.370363
140.0786870.60950.272244
150.0619940.48020.316416
16-0.025025-0.19380.423477
17-0.059212-0.45870.324069
18-0.035241-0.2730.392903
190.029740.23040.409297
200.0415170.32160.37444
21-0.111108-0.86060.196432
22-0.004285-0.03320.486817
230.0021550.01670.493368
24-0.062831-0.48670.314126
25-0.138993-1.07660.142977
26-0.020801-0.16110.43627
270.0361930.28030.390088
28-0.05717-0.44280.329739
29-0.085381-0.66140.255456
30-0.021557-0.1670.433974
310.0761780.59010.278679
32-0.107776-0.83480.203563
33-0.241859-1.87340.032941
34-0.011423-0.08850.464894
350.075170.58230.281286
360.0329760.25540.399633
37-0.044881-0.34770.36466
38-0.031474-0.24380.404109
390.0201550.15610.438232
400.1212980.93960.175603
410.0328950.25480.399874
42-0.08086-0.62630.266734
43-0.095655-0.74090.230809
44-0.058842-0.45580.325095
450.1152380.89260.18781
460.0394580.30560.380468
47-0.035022-0.27130.393553
48-0.075769-0.58690.279736
490.0353610.27390.39255
500.0346650.26850.394611
510.0770820.59710.276352
52-0.01442-0.11170.455718
530.0215250.16670.43407
540.0234220.18140.428323
55-0.060747-0.47050.319835
56-0.022134-0.17140.432225
570.0345880.26790.394842
580.0062920.04870.480646
59-0.011046-0.08560.46605
60NANANA


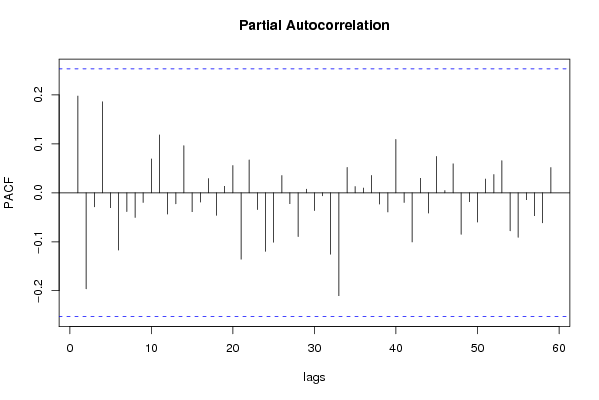
Partial Autocorrelation Function
Time lag kPACF(k)T-STATP-value
10.1975541.53020.065606
2-0.196185-1.51960.066927
3-0.028689-0.22220.412448
40.1860041.44080.077423
5-0.030386-0.23540.407363
6-0.117004-0.90630.184198
7-0.038454-0.29790.383419
8-0.050268-0.38940.349189
9-0.019564-0.15150.440027
100.0692630.53650.296796
110.118150.91520.181879
12-0.043528-0.33720.368585
13-0.022447-0.17390.431274
140.0963350.74620.229228
15-0.03872-0.29990.382635
16-0.018813-0.14570.442313
170.0289670.22440.411614
18-0.046035-0.35660.361326
190.013230.10250.459358
200.0556890.43140.333875
21-0.135573-1.05010.148933
220.0672340.52080.302213
23-0.034268-0.26540.395791
24-0.119442-0.92520.179285
25-0.100816-0.78090.218961
260.0353340.27370.392629
27-0.022295-0.17270.431734
28-0.089488-0.69320.245438
290.0073160.05670.4775
30-0.036298-0.28120.389777
31-0.006247-0.04840.480784
32-0.125461-0.97180.167522
33-0.210327-1.62920.054256
340.0518380.40150.344727
350.0127430.09870.460851
360.0097330.07540.470078
370.0354840.27490.392185
38-0.023102-0.17890.429292
39-0.039149-0.30320.381375
400.109090.8450.200732
41-0.019675-0.15240.439692
42-0.100403-0.77770.219897
430.029480.22840.410075
44-0.041303-0.31990.375065
450.0742590.57520.283651
460.0046150.03570.4858
470.0592790.45920.323883
48-0.084888-0.65750.256675
49-0.018239-0.14130.444061
50-0.059718-0.46260.322671
510.0281880.21830.41395
520.0373220.28910.386751
530.0655250.50760.306813
54-0.077707-0.60190.27475
55-0.091057-0.70530.241669
56-0.014007-0.10850.456982
57-0.0468-0.36250.359121
58-0.06134-0.47510.318208
590.0514690.39870.345774
60NANANA

\begin{tabular}{lllllllll}
\hline
Partial Autocorrelation Function \tabularnewline
Time lag k & PACF(k) & T-STAT & P-value \tabularnewline
1 & 0.197554 & 1.5302 & 0.065606 \tabularnewline
2 & -0.196185 & -1.5196 & 0.066927 \tabularnewline
3 & -0.028689 & -0.2222 & 0.412448 \tabularnewline
4 & 0.186004 & 1.4408 & 0.077423 \tabularnewline
5 & -0.030386 & -0.2354 & 0.407363 \tabularnewline
6 & -0.117004 & -0.9063 & 0.184198 \tabularnewline
7 & -0.038454 & -0.2979 & 0.383419 \tabularnewline
8 & -0.050268 & -0.3894 & 0.349189 \tabularnewline
9 & -0.019564 & -0.1515 & 0.440027 \tabularnewline
10 & 0.069263 & 0.5365 & 0.296796 \tabularnewline
11 & 0.11815 & 0.9152 & 0.181879 \tabularnewline
12 & -0.043528 & -0.3372 & 0.368585 \tabularnewline
13 & -0.022447 & -0.1739 & 0.431274 \tabularnewline
14 & 0.096335 & 0.7462 & 0.229228 \tabularnewline
15 & -0.03872 & -0.2999 & 0.382635 \tabularnewline
16 & -0.018813 & -0.1457 & 0.442313 \tabularnewline
17 & 0.028967 & 0.2244 & 0.411614 \tabularnewline
18 & -0.046035 & -0.3566 & 0.361326 \tabularnewline
19 & 0.01323 & 0.1025 & 0.459358 \tabularnewline
20 & 0.055689 & 0.4314 & 0.333875 \tabularnewline
21 & -0.135573 & -1.0501 & 0.148933 \tabularnewline
22 & 0.067234 & 0.5208 & 0.302213 \tabularnewline
23 & -0.034268 & -0.2654 & 0.395791 \tabularnewline
24 & -0.119442 & -0.9252 & 0.179285 \tabularnewline
25 & -0.100816 & -0.7809 & 0.218961 \tabularnewline
26 & 0.035334 & 0.2737 & 0.392629 \tabularnewline
27 & -0.022295 & -0.1727 & 0.431734 \tabularnewline
28 & -0.089488 & -0.6932 & 0.245438 \tabularnewline
29 & 0.007316 & 0.0567 & 0.4775 \tabularnewline
30 & -0.036298 & -0.2812 & 0.389777 \tabularnewline
31 & -0.006247 & -0.0484 & 0.480784 \tabularnewline
32 & -0.125461 & -0.9718 & 0.167522 \tabularnewline
33 & -0.210327 & -1.6292 & 0.054256 \tabularnewline
34 & 0.051838 & 0.4015 & 0.344727 \tabularnewline
35 & 0.012743 & 0.0987 & 0.460851 \tabularnewline
36 & 0.009733 & 0.0754 & 0.470078 \tabularnewline
37 & 0.035484 & 0.2749 & 0.392185 \tabularnewline
38 & -0.023102 & -0.1789 & 0.429292 \tabularnewline
39 & -0.039149 & -0.3032 & 0.381375 \tabularnewline
40 & 0.10909 & 0.845 & 0.200732 \tabularnewline
41 & -0.019675 & -0.1524 & 0.439692 \tabularnewline
42 & -0.100403 & -0.7777 & 0.219897 \tabularnewline
43 & 0.02948 & 0.2284 & 0.410075 \tabularnewline
44 & -0.041303 & -0.3199 & 0.375065 \tabularnewline
45 & 0.074259 & 0.5752 & 0.283651 \tabularnewline
46 & 0.004615 & 0.0357 & 0.4858 \tabularnewline
47 & 0.059279 & 0.4592 & 0.323883 \tabularnewline
48 & -0.084888 & -0.6575 & 0.256675 \tabularnewline
49 & -0.018239 & -0.1413 & 0.444061 \tabularnewline
50 & -0.059718 & -0.4626 & 0.322671 \tabularnewline
51 & 0.028188 & 0.2183 & 0.41395 \tabularnewline
52 & 0.037322 & 0.2891 & 0.386751 \tabularnewline
53 & 0.065525 & 0.5076 & 0.306813 \tabularnewline
54 & -0.077707 & -0.6019 & 0.27475 \tabularnewline
55 & -0.091057 & -0.7053 & 0.241669 \tabularnewline
56 & -0.014007 & -0.1085 & 0.456982 \tabularnewline
57 & -0.0468 & -0.3625 & 0.359121 \tabularnewline
58 & -0.06134 & -0.4751 & 0.318208 \tabularnewline
59 & 0.051469 & 0.3987 & 0.345774 \tabularnewline
60 & NA & NA & NA \tabularnewline
\hline
\end{tabular}
%Source: https://freestatistics.org/blog/index.php?pk=31856&T=2

[TABLE]
[ROW][C]Partial Autocorrelation Function[/C][/ROW]
[ROW][C]Time lag k[/C][C]PACF(k)[/C][C]T-STAT[/C][C]P-value[/C][/ROW]
[ROW][C]1[/C][C]0.197554[/C][C]1.5302[/C][C]0.065606[/C][/ROW]
[ROW][C]2[/C][C]-0.196185[/C][C]-1.5196[/C][C]0.066927[/C][/ROW]
[ROW][C]3[/C][C]-0.028689[/C][C]-0.2222[/C][C]0.412448[/C][/ROW]
[ROW][C]4[/C][C]0.186004[/C][C]1.4408[/C][C]0.077423[/C][/ROW]
[ROW][C]5[/C][C]-0.030386[/C][C]-0.2354[/C][C]0.407363[/C][/ROW]
[ROW][C]6[/C][C]-0.117004[/C][C]-0.9063[/C][C]0.184198[/C][/ROW]
[ROW][C]7[/C][C]-0.038454[/C][C]-0.2979[/C][C]0.383419[/C][/ROW]
[ROW][C]8[/C][C]-0.050268[/C][C]-0.3894[/C][C]0.349189[/C][/ROW]
[ROW][C]9[/C][C]-0.019564[/C][C]-0.1515[/C][C]0.440027[/C][/ROW]
[ROW][C]10[/C][C]0.069263[/C][C]0.5365[/C][C]0.296796[/C][/ROW]
[ROW][C]11[/C][C]0.11815[/C][C]0.9152[/C][C]0.181879[/C][/ROW]
[ROW][C]12[/C][C]-0.043528[/C][C]-0.3372[/C][C]0.368585[/C][/ROW]
[ROW][C]13[/C][C]-0.022447[/C][C]-0.1739[/C][C]0.431274[/C][/ROW]
[ROW][C]14[/C][C]0.096335[/C][C]0.7462[/C][C]0.229228[/C][/ROW]
[ROW][C]15[/C][C]-0.03872[/C][C]-0.2999[/C][C]0.382635[/C][/ROW]
[ROW][C]16[/C][C]-0.018813[/C][C]-0.1457[/C][C]0.442313[/C][/ROW]
[ROW][C]17[/C][C]0.028967[/C][C]0.2244[/C][C]0.411614[/C][/ROW]
[ROW][C]18[/C][C]-0.046035[/C][C]-0.3566[/C][C]0.361326[/C][/ROW]
[ROW][C]19[/C][C]0.01323[/C][C]0.1025[/C][C]0.459358[/C][/ROW]
[ROW][C]20[/C][C]0.055689[/C][C]0.4314[/C][C]0.333875[/C][/ROW]
[ROW][C]21[/C][C]-0.135573[/C][C]-1.0501[/C][C]0.148933[/C][/ROW]
[ROW][C]22[/C][C]0.067234[/C][C]0.5208[/C][C]0.302213[/C][/ROW]
[ROW][C]23[/C][C]-0.034268[/C][C]-0.2654[/C][C]0.395791[/C][/ROW]
[ROW][C]24[/C][C]-0.119442[/C][C]-0.9252[/C][C]0.179285[/C][/ROW]
[ROW][C]25[/C][C]-0.100816[/C][C]-0.7809[/C][C]0.218961[/C][/ROW]
[ROW][C]26[/C][C]0.035334[/C][C]0.2737[/C][C]0.392629[/C][/ROW]
[ROW][C]27[/C][C]-0.022295[/C][C]-0.1727[/C][C]0.431734[/C][/ROW]
[ROW][C]28[/C][C]-0.089488[/C][C]-0.6932[/C][C]0.245438[/C][/ROW]
[ROW][C]29[/C][C]0.007316[/C][C]0.0567[/C][C]0.4775[/C][/ROW]
[ROW][C]30[/C][C]-0.036298[/C][C]-0.2812[/C][C]0.389777[/C][/ROW]
[ROW][C]31[/C][C]-0.006247[/C][C]-0.0484[/C][C]0.480784[/C][/ROW]
[ROW][C]32[/C][C]-0.125461[/C][C]-0.9718[/C][C]0.167522[/C][/ROW]
[ROW][C]33[/C][C]-0.210327[/C][C]-1.6292[/C][C]0.054256[/C][/ROW]
[ROW][C]34[/C][C]0.051838[/C][C]0.4015[/C][C]0.344727[/C][/ROW]
[ROW][C]35[/C][C]0.012743[/C][C]0.0987[/C][C]0.460851[/C][/ROW]
[ROW][C]36[/C][C]0.009733[/C][C]0.0754[/C][C]0.470078[/C][/ROW]
[ROW][C]37[/C][C]0.035484[/C][C]0.2749[/C][C]0.392185[/C][/ROW]
[ROW][C]38[/C][C]-0.023102[/C][C]-0.1789[/C][C]0.429292[/C][/ROW]
[ROW][C]39[/C][C]-0.039149[/C][C]-0.3032[/C][C]0.381375[/C][/ROW]
[ROW][C]40[/C][C]0.10909[/C][C]0.845[/C][C]0.200732[/C][/ROW]
[ROW][C]41[/C][C]-0.019675[/C][C]-0.1524[/C][C]0.439692[/C][/ROW]
[ROW][C]42[/C][C]-0.100403[/C][C]-0.7777[/C][C]0.219897[/C][/ROW]
[ROW][C]43[/C][C]0.02948[/C][C]0.2284[/C][C]0.410075[/C][/ROW]
[ROW][C]44[/C][C]-0.041303[/C][C]-0.3199[/C][C]0.375065[/C][/ROW]
[ROW][C]45[/C][C]0.074259[/C][C]0.5752[/C][C]0.283651[/C][/ROW]
[ROW][C]46[/C][C]0.004615[/C][C]0.0357[/C][C]0.4858[/C][/ROW]
[ROW][C]47[/C][C]0.059279[/C][C]0.4592[/C][C]0.323883[/C][/ROW]
[ROW][C]48[/C][C]-0.084888[/C][C]-0.6575[/C][C]0.256675[/C][/ROW]
[ROW][C]49[/C][C]-0.018239[/C][C]-0.1413[/C][C]0.444061[/C][/ROW]
[ROW][C]50[/C][C]-0.059718[/C][C]-0.4626[/C][C]0.322671[/C][/ROW]
[ROW][C]51[/C][C]0.028188[/C][C]0.2183[/C][C]0.41395[/C][/ROW]
[ROW][C]52[/C][C]0.037322[/C][C]0.2891[/C][C]0.386751[/C][/ROW]
[ROW][C]53[/C][C]0.065525[/C][C]0.5076[/C][C]0.306813[/C][/ROW]
[ROW][C]54[/C][C]-0.077707[/C][C]-0.6019[/C][C]0.27475[/C][/ROW]
[ROW][C]55[/C][C]-0.091057[/C][C]-0.7053[/C][C]0.241669[/C][/ROW]
[ROW][C]56[/C][C]-0.014007[/C][C]-0.1085[/C][C]0.456982[/C][/ROW]
[ROW][C]57[/C][C]-0.0468[/C][C]-0.3625[/C][C]0.359121[/C][/ROW]
[ROW][C]58[/C][C]-0.06134[/C][C]-0.4751[/C][C]0.318208[/C][/ROW]
[ROW][C]59[/C][C]0.051469[/C][C]0.3987[/C][C]0.345774[/C][/ROW]
[ROW][C]60[/C][C]NA[/C][C]NA[/C][C]NA[/C][/ROW]
[/TABLE]
Source: https://freestatistics.org/blog/index.php?pk=31856&T=2

Globally Unique Identifier (entire table): ba.freestatistics.org/blog/index.php?pk=31856&T=2

As an alternative you can also use a QR Code:  

The GUIDs for individual cells are displayed in the table below:

Partial Autocorrelation Function
Time lag kPACF(k)T-STATP-value
10.1975541.53020.065606
2-0.196185-1.51960.066927
3-0.028689-0.22220.412448
40.1860041.44080.077423
5-0.030386-0.23540.407363
6-0.117004-0.90630.184198
7-0.038454-0.29790.383419
8-0.050268-0.38940.349189
9-0.019564-0.15150.440027
100.0692630.53650.296796
110.118150.91520.181879
12-0.043528-0.33720.368585
13-0.022447-0.17390.431274
140.0963350.74620.229228
15-0.03872-0.29990.382635
16-0.018813-0.14570.442313
170.0289670.22440.411614
18-0.046035-0.35660.361326
190.013230.10250.459358
200.0556890.43140.333875
21-0.135573-1.05010.148933
220.0672340.52080.302213
23-0.034268-0.26540.395791
24-0.119442-0.92520.179285
25-0.100816-0.78090.218961
260.0353340.27370.392629
27-0.022295-0.17270.431734
28-0.089488-0.69320.245438
290.0073160.05670.4775
30-0.036298-0.28120.389777
31-0.006247-0.04840.480784
32-0.125461-0.97180.167522
33-0.210327-1.62920.054256
340.0518380.40150.344727
350.0127430.09870.460851
360.0097330.07540.470078
370.0354840.27490.392185
38-0.023102-0.17890.429292
39-0.039149-0.30320.381375
400.109090.8450.200732
41-0.019675-0.15240.439692
42-0.100403-0.77770.219897
430.029480.22840.410075
44-0.041303-0.31990.375065
450.0742590.57520.283651
460.0046150.03570.4858
470.0592790.45920.323883
48-0.084888-0.65750.256675
49-0.018239-0.14130.444061
50-0.059718-0.46260.322671
510.0281880.21830.41395
520.0373220.28910.386751
530.0655250.50760.306813
54-0.077707-0.60190.27475
55-0.091057-0.70530.241669
56-0.014007-0.10850.456982
57-0.0468-0.36250.359121
58-0.06134-0.47510.318208
590.0514690.39870.345774
60NANANA


Parameters (Session):
par1 = 60 ; par2 = 1 ; par3 = 1 ; par4 = 0 ; par5 = 12 ;
Parameters (R input):
par1 = 60 ; par2 = 1 ; par3 = 1 ; par4 = 0 ; par5 = 12 ;
R code (references can be found in the software module):
if (par1 == 'Default') {
par1 = 10*log10(length(x))
} else {
par1 <- as.numeric(par1)
}
par2 <- as.numeric(par2)
par3 <- as.numeric(par3)
par4 <- as.numeric(par4)
par5 <- as.numeric(par5)
if (par2 == 0) {
x <- log(x)
} else {
x <- (x ^ par2 - 1) / par2
}
if (par3 > 0) x <- diff(x,lag=1,difference=par3)
if (par4 > 0) x <- diff(x,lag=par5,difference=par4)
bitmap(file='pic1.png')
racf <- acf(x,par1,main='Autocorrelation',xlab='lags',ylab='ACF')
dev.off()
bitmap(file='pic2.png')
rpacf <- pacf(x,par1,main='Partial Autocorrelation',xlab='lags',ylab='PACF')
dev.off()
(myacf <- c(racf$acf))
(mypacf <- c(rpacf$acf))
lengthx <- length(x)
sqrtn <- sqrt(lengthx)
load(file='createtable')
a<-table.start()
a<-table.row.start(a)
a<-table.element(a,'Autocorrelation Function',4,TRUE)
a<-table.row.end(a)
a<-table.row.start(a)
a<-table.element(a,'Time lag k',header=TRUE)
a<-table.element(a,hyperlink('basics.htm','ACF(k)','click here for more information about the Autocorrelation Function'),header=TRUE)
a<-table.element(a,'T-STAT',header=TRUE)
a<-table.element(a,'P-value',header=TRUE)
a<-table.row.end(a)
for (i in 2:(par1+1)) {
a<-table.row.start(a)
a<-table.element(a,i-1,header=TRUE)
a<-table.element(a,round(myacf[i],6))
mytstat <- myacf[i]*sqrtn
a<-table.element(a,round(mytstat,4))
a<-table.element(a,round(1-pt(abs(mytstat),lengthx),6))
a<-table.row.end(a)
}
a<-table.end(a)
table.save(a,file='mytable.tab')
a<-table.start()
a<-table.row.start(a)
a<-table.element(a,'Partial Autocorrelation Function',4,TRUE)
a<-table.row.end(a)
a<-table.row.start(a)
a<-table.element(a,'Time lag k',header=TRUE)
a<-table.element(a,hyperlink('basics.htm','PACF(k)','click here for more information about the Partial Autocorrelation Function'),header=TRUE)
a<-table.element(a,'T-STAT',header=TRUE)
a<-table.element(a,'P-value',header=TRUE)
a<-table.row.end(a)
for (i in 1:par1) {
a<-table.row.start(a)
a<-table.element(a,i,header=TRUE)
a<-table.element(a,round(mypacf[i],6))
mytstat <- mypacf[i]*sqrtn
a<-table.element(a,round(mytstat,4))
a<-table.element(a,round(1-pt(abs(mytstat),lengthx),6))
a<-table.row.end(a)
}
a<-table.end(a)
table.save(a,file='mytable1.tab')