Free Statistics

of Irreproducible Research!

Author's title

Author*The author of this computation has been verified*
R Software Modulerwasp_autocorrelation.wasp
Title produced by software(Partial) Autocorrelation Function
Date of computationWed, 10 Dec 2008 07:21:44 -0700
Cite this page as followsStatistical Computations at FreeStatistics.org, Office for Research Development and Education, URL https://freestatistics.org/blog/index.php?v=date/2008/Dec/10/t12289189889mujvs8oxh66p8j.htm/, Retrieved Sat, 18 May 2024 06:36:12 +0000
Statistical Computations at FreeStatistics.org, Office for Research Development and Education, URL https://freestatistics.org/blog/index.php?pk=31970, Retrieved Sat, 18 May 2024 06:36:12 +0000
QR Codes:

Original text written by user:
IsPrivate?No (this computation is public)
User-defined keywords
Estimated Impact176
Family? (F = Feedback message, R = changed R code, M = changed R Module, P = changed Parameters, D = changed Data)
-       [(Partial) Autocorrelation Function] [ACF d0D1] [2008-12-10 14:21:44] [5f3e73ccf1ddc75508eed47fa51813d3] [Current]
Feedback Forum

Post a new message
Dataseries X:
632
1270
1211
1469
2570
2765
2487
3644
2501
1629
987
1100
690
1378
1376
1736
2800
2671
2508
3590
2691
1629
1020
1224
787
1424
1232
2021
2782
2682
3284
3194
2736
1701
1089
1240
799
1163
1180
1960
2914
2658
3254
3222
2987
1604
1032
1283
774
1109
1453
1849
2800
3310
3060
3422
3448
1670
1022
1391
767
1172
1498
1623
2646
3439


Summary of computational transaction
Raw Inputview raw input (R code)
Raw Outputview raw output of R engine
Computing time2 seconds
R Server'Sir Ronald Aylmer Fisher' @ 193.190.124.24

\begin{tabular}{lllllllll}
\hline
Summary of computational transaction \tabularnewline
Raw Input & view raw input (R code)  \tabularnewline
Raw Output & view raw output of R engine  \tabularnewline
Computing time & 2 seconds \tabularnewline
R Server & 'Sir Ronald Aylmer Fisher' @ 193.190.124.24 \tabularnewline
\hline
\end{tabular}
%Source: https://freestatistics.org/blog/index.php?pk=31970&T=0

[TABLE]
[ROW][C]Summary of computational transaction[/C][/ROW]
[ROW][C]Raw Input[/C][C]view raw input (R code) [/C][/ROW]
[ROW][C]Raw Output[/C][C]view raw output of R engine [/C][/ROW]
[ROW][C]Computing time[/C][C]2 seconds[/C][/ROW]
[ROW][C]R Server[/C][C]'Sir Ronald Aylmer Fisher' @ 193.190.124.24[/C][/ROW]
[/TABLE]
Source: https://freestatistics.org/blog/index.php?pk=31970&T=0

Globally Unique Identifier (entire table): ba.freestatistics.org/blog/index.php?pk=31970&T=0

As an alternative you can also use a QR Code:  

The GUIDs for individual cells are displayed in the table below:

Summary of computational transaction
Raw Inputview raw input (R code)
Raw Outputview raw output of R engine
Computing time2 seconds
R Server'Sir Ronald Aylmer Fisher' @ 193.190.124.24


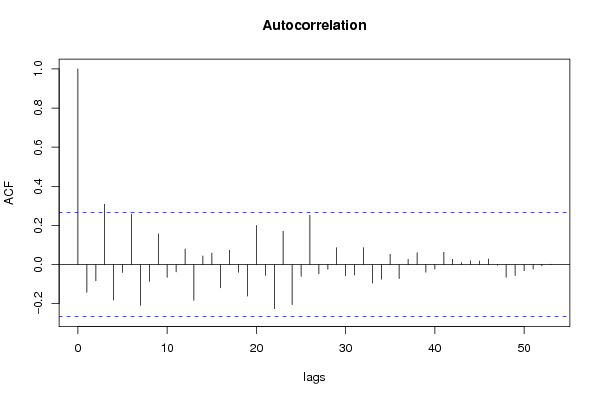
Autocorrelation Function
Time lag kACF(k)T-STATP-value
1-0.142278-1.04550.150219
2-0.083074-0.61050.272058
30.3078892.26250.013856
4-0.18202-1.33760.093322
5-0.041037-0.30160.382073
60.2570251.88870.032151
7-0.208597-1.53290.065573
8-0.086354-0.63460.264194
90.1566071.15080.127438
10-0.064947-0.47730.317552
11-0.037587-0.27620.391721
120.0792730.58250.281316
13-0.183334-1.34720.091768
140.0433370.31850.375681
150.0582470.4280.335168
16-0.119451-0.87780.191976
170.0731960.53790.296435
18-0.039977-0.29380.385031
19-0.161546-1.18710.120188
200.1994891.46590.074232
21-0.055802-0.41010.341693
22-0.225725-1.65870.051484
230.169931.24870.108576
24-0.204275-1.50110.069577
25-0.060518-0.44470.329153
260.2515081.84820.035027
27-0.047039-0.34570.36547
28-0.024891-0.18290.427777
290.0854930.62820.266247
30-0.05759-0.42320.336915
31-0.053641-0.39420.3475
320.086110.63280.264776
33-0.094607-0.69520.244951
34-0.075079-0.55170.29171
350.0518470.3810.35235
36-0.071516-0.52550.300681
370.0265690.19520.42297
380.0601450.4420.330137
39-0.03905-0.2870.387622
40-0.022908-0.16830.433471
410.0623510.45820.324328
420.0263250.19340.423668
430.009740.07160.471603
440.0189550.13930.44487
450.0177260.13030.448423
460.0278180.20440.419397
47-0.004362-0.03210.487273
48-0.065833-0.48380.315251
49-0.056282-0.41360.340407
50-0.031635-0.23250.408527
51-0.023064-0.16950.433025
52-0.007317-0.05380.47866
530.0017570.01290.494874
54NANANA
55NANANA
56NANANA
57NANANA
58NANANA
59NANANA
60NANANA

\begin{tabular}{lllllllll}
\hline
Autocorrelation Function \tabularnewline
Time lag k & ACF(k) & T-STAT & P-value \tabularnewline
1 & -0.142278 & -1.0455 & 0.150219 \tabularnewline
2 & -0.083074 & -0.6105 & 0.272058 \tabularnewline
3 & 0.307889 & 2.2625 & 0.013856 \tabularnewline
4 & -0.18202 & -1.3376 & 0.093322 \tabularnewline
5 & -0.041037 & -0.3016 & 0.382073 \tabularnewline
6 & 0.257025 & 1.8887 & 0.032151 \tabularnewline
7 & -0.208597 & -1.5329 & 0.065573 \tabularnewline
8 & -0.086354 & -0.6346 & 0.264194 \tabularnewline
9 & 0.156607 & 1.1508 & 0.127438 \tabularnewline
10 & -0.064947 & -0.4773 & 0.317552 \tabularnewline
11 & -0.037587 & -0.2762 & 0.391721 \tabularnewline
12 & 0.079273 & 0.5825 & 0.281316 \tabularnewline
13 & -0.183334 & -1.3472 & 0.091768 \tabularnewline
14 & 0.043337 & 0.3185 & 0.375681 \tabularnewline
15 & 0.058247 & 0.428 & 0.335168 \tabularnewline
16 & -0.119451 & -0.8778 & 0.191976 \tabularnewline
17 & 0.073196 & 0.5379 & 0.296435 \tabularnewline
18 & -0.039977 & -0.2938 & 0.385031 \tabularnewline
19 & -0.161546 & -1.1871 & 0.120188 \tabularnewline
20 & 0.199489 & 1.4659 & 0.074232 \tabularnewline
21 & -0.055802 & -0.4101 & 0.341693 \tabularnewline
22 & -0.225725 & -1.6587 & 0.051484 \tabularnewline
23 & 0.16993 & 1.2487 & 0.108576 \tabularnewline
24 & -0.204275 & -1.5011 & 0.069577 \tabularnewline
25 & -0.060518 & -0.4447 & 0.329153 \tabularnewline
26 & 0.251508 & 1.8482 & 0.035027 \tabularnewline
27 & -0.047039 & -0.3457 & 0.36547 \tabularnewline
28 & -0.024891 & -0.1829 & 0.427777 \tabularnewline
29 & 0.085493 & 0.6282 & 0.266247 \tabularnewline
30 & -0.05759 & -0.4232 & 0.336915 \tabularnewline
31 & -0.053641 & -0.3942 & 0.3475 \tabularnewline
32 & 0.08611 & 0.6328 & 0.264776 \tabularnewline
33 & -0.094607 & -0.6952 & 0.244951 \tabularnewline
34 & -0.075079 & -0.5517 & 0.29171 \tabularnewline
35 & 0.051847 & 0.381 & 0.35235 \tabularnewline
36 & -0.071516 & -0.5255 & 0.300681 \tabularnewline
37 & 0.026569 & 0.1952 & 0.42297 \tabularnewline
38 & 0.060145 & 0.442 & 0.330137 \tabularnewline
39 & -0.03905 & -0.287 & 0.387622 \tabularnewline
40 & -0.022908 & -0.1683 & 0.433471 \tabularnewline
41 & 0.062351 & 0.4582 & 0.324328 \tabularnewline
42 & 0.026325 & 0.1934 & 0.423668 \tabularnewline
43 & 0.00974 & 0.0716 & 0.471603 \tabularnewline
44 & 0.018955 & 0.1393 & 0.44487 \tabularnewline
45 & 0.017726 & 0.1303 & 0.448423 \tabularnewline
46 & 0.027818 & 0.2044 & 0.419397 \tabularnewline
47 & -0.004362 & -0.0321 & 0.487273 \tabularnewline
48 & -0.065833 & -0.4838 & 0.315251 \tabularnewline
49 & -0.056282 & -0.4136 & 0.340407 \tabularnewline
50 & -0.031635 & -0.2325 & 0.408527 \tabularnewline
51 & -0.023064 & -0.1695 & 0.433025 \tabularnewline
52 & -0.007317 & -0.0538 & 0.47866 \tabularnewline
53 & 0.001757 & 0.0129 & 0.494874 \tabularnewline
54 & NA & NA & NA \tabularnewline
55 & NA & NA & NA \tabularnewline
56 & NA & NA & NA \tabularnewline
57 & NA & NA & NA \tabularnewline
58 & NA & NA & NA \tabularnewline
59 & NA & NA & NA \tabularnewline
60 & NA & NA & NA \tabularnewline
\hline
\end{tabular}
%Source: https://freestatistics.org/blog/index.php?pk=31970&T=1

[TABLE]
[ROW][C]Autocorrelation Function[/C][/ROW]
[ROW][C]Time lag k[/C][C]ACF(k)[/C][C]T-STAT[/C][C]P-value[/C][/ROW]
[ROW][C]1[/C][C]-0.142278[/C][C]-1.0455[/C][C]0.150219[/C][/ROW]
[ROW][C]2[/C][C]-0.083074[/C][C]-0.6105[/C][C]0.272058[/C][/ROW]
[ROW][C]3[/C][C]0.307889[/C][C]2.2625[/C][C]0.013856[/C][/ROW]
[ROW][C]4[/C][C]-0.18202[/C][C]-1.3376[/C][C]0.093322[/C][/ROW]
[ROW][C]5[/C][C]-0.041037[/C][C]-0.3016[/C][C]0.382073[/C][/ROW]
[ROW][C]6[/C][C]0.257025[/C][C]1.8887[/C][C]0.032151[/C][/ROW]
[ROW][C]7[/C][C]-0.208597[/C][C]-1.5329[/C][C]0.065573[/C][/ROW]
[ROW][C]8[/C][C]-0.086354[/C][C]-0.6346[/C][C]0.264194[/C][/ROW]
[ROW][C]9[/C][C]0.156607[/C][C]1.1508[/C][C]0.127438[/C][/ROW]
[ROW][C]10[/C][C]-0.064947[/C][C]-0.4773[/C][C]0.317552[/C][/ROW]
[ROW][C]11[/C][C]-0.037587[/C][C]-0.2762[/C][C]0.391721[/C][/ROW]
[ROW][C]12[/C][C]0.079273[/C][C]0.5825[/C][C]0.281316[/C][/ROW]
[ROW][C]13[/C][C]-0.183334[/C][C]-1.3472[/C][C]0.091768[/C][/ROW]
[ROW][C]14[/C][C]0.043337[/C][C]0.3185[/C][C]0.375681[/C][/ROW]
[ROW][C]15[/C][C]0.058247[/C][C]0.428[/C][C]0.335168[/C][/ROW]
[ROW][C]16[/C][C]-0.119451[/C][C]-0.8778[/C][C]0.191976[/C][/ROW]
[ROW][C]17[/C][C]0.073196[/C][C]0.5379[/C][C]0.296435[/C][/ROW]
[ROW][C]18[/C][C]-0.039977[/C][C]-0.2938[/C][C]0.385031[/C][/ROW]
[ROW][C]19[/C][C]-0.161546[/C][C]-1.1871[/C][C]0.120188[/C][/ROW]
[ROW][C]20[/C][C]0.199489[/C][C]1.4659[/C][C]0.074232[/C][/ROW]
[ROW][C]21[/C][C]-0.055802[/C][C]-0.4101[/C][C]0.341693[/C][/ROW]
[ROW][C]22[/C][C]-0.225725[/C][C]-1.6587[/C][C]0.051484[/C][/ROW]
[ROW][C]23[/C][C]0.16993[/C][C]1.2487[/C][C]0.108576[/C][/ROW]
[ROW][C]24[/C][C]-0.204275[/C][C]-1.5011[/C][C]0.069577[/C][/ROW]
[ROW][C]25[/C][C]-0.060518[/C][C]-0.4447[/C][C]0.329153[/C][/ROW]
[ROW][C]26[/C][C]0.251508[/C][C]1.8482[/C][C]0.035027[/C][/ROW]
[ROW][C]27[/C][C]-0.047039[/C][C]-0.3457[/C][C]0.36547[/C][/ROW]
[ROW][C]28[/C][C]-0.024891[/C][C]-0.1829[/C][C]0.427777[/C][/ROW]
[ROW][C]29[/C][C]0.085493[/C][C]0.6282[/C][C]0.266247[/C][/ROW]
[ROW][C]30[/C][C]-0.05759[/C][C]-0.4232[/C][C]0.336915[/C][/ROW]
[ROW][C]31[/C][C]-0.053641[/C][C]-0.3942[/C][C]0.3475[/C][/ROW]
[ROW][C]32[/C][C]0.08611[/C][C]0.6328[/C][C]0.264776[/C][/ROW]
[ROW][C]33[/C][C]-0.094607[/C][C]-0.6952[/C][C]0.244951[/C][/ROW]
[ROW][C]34[/C][C]-0.075079[/C][C]-0.5517[/C][C]0.29171[/C][/ROW]
[ROW][C]35[/C][C]0.051847[/C][C]0.381[/C][C]0.35235[/C][/ROW]
[ROW][C]36[/C][C]-0.071516[/C][C]-0.5255[/C][C]0.300681[/C][/ROW]
[ROW][C]37[/C][C]0.026569[/C][C]0.1952[/C][C]0.42297[/C][/ROW]
[ROW][C]38[/C][C]0.060145[/C][C]0.442[/C][C]0.330137[/C][/ROW]
[ROW][C]39[/C][C]-0.03905[/C][C]-0.287[/C][C]0.387622[/C][/ROW]
[ROW][C]40[/C][C]-0.022908[/C][C]-0.1683[/C][C]0.433471[/C][/ROW]
[ROW][C]41[/C][C]0.062351[/C][C]0.4582[/C][C]0.324328[/C][/ROW]
[ROW][C]42[/C][C]0.026325[/C][C]0.1934[/C][C]0.423668[/C][/ROW]
[ROW][C]43[/C][C]0.00974[/C][C]0.0716[/C][C]0.471603[/C][/ROW]
[ROW][C]44[/C][C]0.018955[/C][C]0.1393[/C][C]0.44487[/C][/ROW]
[ROW][C]45[/C][C]0.017726[/C][C]0.1303[/C][C]0.448423[/C][/ROW]
[ROW][C]46[/C][C]0.027818[/C][C]0.2044[/C][C]0.419397[/C][/ROW]
[ROW][C]47[/C][C]-0.004362[/C][C]-0.0321[/C][C]0.487273[/C][/ROW]
[ROW][C]48[/C][C]-0.065833[/C][C]-0.4838[/C][C]0.315251[/C][/ROW]
[ROW][C]49[/C][C]-0.056282[/C][C]-0.4136[/C][C]0.340407[/C][/ROW]
[ROW][C]50[/C][C]-0.031635[/C][C]-0.2325[/C][C]0.408527[/C][/ROW]
[ROW][C]51[/C][C]-0.023064[/C][C]-0.1695[/C][C]0.433025[/C][/ROW]
[ROW][C]52[/C][C]-0.007317[/C][C]-0.0538[/C][C]0.47866[/C][/ROW]
[ROW][C]53[/C][C]0.001757[/C][C]0.0129[/C][C]0.494874[/C][/ROW]
[ROW][C]54[/C][C]NA[/C][C]NA[/C][C]NA[/C][/ROW]
[ROW][C]55[/C][C]NA[/C][C]NA[/C][C]NA[/C][/ROW]
[ROW][C]56[/C][C]NA[/C][C]NA[/C][C]NA[/C][/ROW]
[ROW][C]57[/C][C]NA[/C][C]NA[/C][C]NA[/C][/ROW]
[ROW][C]58[/C][C]NA[/C][C]NA[/C][C]NA[/C][/ROW]
[ROW][C]59[/C][C]NA[/C][C]NA[/C][C]NA[/C][/ROW]
[ROW][C]60[/C][C]NA[/C][C]NA[/C][C]NA[/C][/ROW]
[/TABLE]
Source: https://freestatistics.org/blog/index.php?pk=31970&T=1

Globally Unique Identifier (entire table): ba.freestatistics.org/blog/index.php?pk=31970&T=1

As an alternative you can also use a QR Code:  

The GUIDs for individual cells are displayed in the table below:

Autocorrelation Function
Time lag kACF(k)T-STATP-value
1-0.142278-1.04550.150219
2-0.083074-0.61050.272058
30.3078892.26250.013856
4-0.18202-1.33760.093322
5-0.041037-0.30160.382073
60.2570251.88870.032151
7-0.208597-1.53290.065573
8-0.086354-0.63460.264194
90.1566071.15080.127438
10-0.064947-0.47730.317552
11-0.037587-0.27620.391721
120.0792730.58250.281316
13-0.183334-1.34720.091768
140.0433370.31850.375681
150.0582470.4280.335168
16-0.119451-0.87780.191976
170.0731960.53790.296435
18-0.039977-0.29380.385031
19-0.161546-1.18710.120188
200.1994891.46590.074232
21-0.055802-0.41010.341693
22-0.225725-1.65870.051484
230.169931.24870.108576
24-0.204275-1.50110.069577
25-0.060518-0.44470.329153
260.2515081.84820.035027
27-0.047039-0.34570.36547
28-0.024891-0.18290.427777
290.0854930.62820.266247
30-0.05759-0.42320.336915
31-0.053641-0.39420.3475
320.086110.63280.264776
33-0.094607-0.69520.244951
34-0.075079-0.55170.29171
350.0518470.3810.35235
36-0.071516-0.52550.300681
370.0265690.19520.42297
380.0601450.4420.330137
39-0.03905-0.2870.387622
40-0.022908-0.16830.433471
410.0623510.45820.324328
420.0263250.19340.423668
430.009740.07160.471603
440.0189550.13930.44487
450.0177260.13030.448423
460.0278180.20440.419397
47-0.004362-0.03210.487273
48-0.065833-0.48380.315251
49-0.056282-0.41360.340407
50-0.031635-0.23250.408527
51-0.023064-0.16950.433025
52-0.007317-0.05380.47866
530.0017570.01290.494874
54NANANA
55NANANA
56NANANA
57NANANA
58NANANA
59NANANA
60NANANA


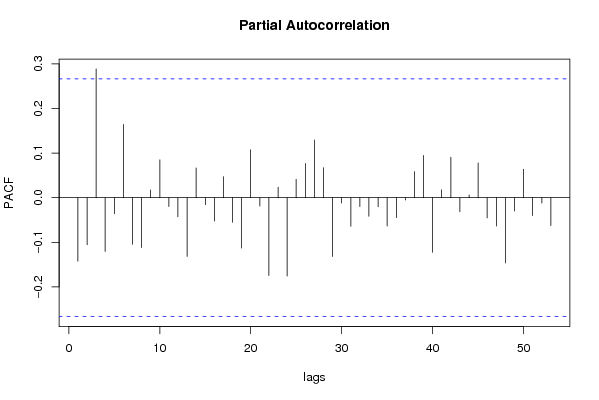
Partial Autocorrelation Function
Time lag kPACF(k)T-STATP-value
1-0.142278-1.04550.150219
2-0.105451-0.77490.220887
30.2888132.12230.019206
4-0.120339-0.88430.190226
5-0.035977-0.26440.396248
60.1644641.20860.116049
7-0.104344-0.76680.223279
8-0.111561-0.81980.207966
90.0174380.12810.449255
100.0849640.62440.267511
11-0.019774-0.14530.442504
12-0.042678-0.31360.377509
13-0.131549-0.96670.169006
140.0667680.49060.312833
15-0.015589-0.11460.454611
16-0.052383-0.38490.350899
170.0473150.34770.36471
18-0.054919-0.40360.344062
19-0.113005-0.83040.204981
200.1073580.78890.216806
21-0.018611-0.13680.445863
22-0.174645-1.28340.10242
230.023710.17420.431168
24-0.175487-1.28960.101349
250.0411830.30260.381666
260.0769640.56560.287015
270.1294560.95130.172845
280.0674140.49540.311168
29-0.131885-0.96920.168395
30-0.012074-0.08870.464815
31-0.06425-0.47210.319365
32-0.019894-0.14620.442159
33-0.041699-0.30640.380229
34-0.02018-0.14830.441331
35-0.063488-0.46650.321353
36-0.044631-0.3280.372101
37-0.005211-0.03830.484798
380.0585820.43050.334277
390.0945920.69510.244984
40-0.122479-0.90.18605
410.0176510.12970.448639
420.0907440.66680.25386
43-0.031668-0.23270.408431
440.0063850.04690.481376
450.0781190.57410.284157
46-0.045202-0.33220.370526
47-0.063438-0.46620.321483
48-0.146202-1.07440.143719
49-0.029664-0.2180.414131
500.0639250.46980.320211
51-0.039814-0.29260.385484
52-0.012042-0.08850.464908
53-0.062461-0.4590.32404
54NANANA
55NANANA
56NANANA
57NANANA
58NANANA
59NANANA
60NANANA

\begin{tabular}{lllllllll}
\hline
Partial Autocorrelation Function \tabularnewline
Time lag k & PACF(k) & T-STAT & P-value \tabularnewline
1 & -0.142278 & -1.0455 & 0.150219 \tabularnewline
2 & -0.105451 & -0.7749 & 0.220887 \tabularnewline
3 & 0.288813 & 2.1223 & 0.019206 \tabularnewline
4 & -0.120339 & -0.8843 & 0.190226 \tabularnewline
5 & -0.035977 & -0.2644 & 0.396248 \tabularnewline
6 & 0.164464 & 1.2086 & 0.116049 \tabularnewline
7 & -0.104344 & -0.7668 & 0.223279 \tabularnewline
8 & -0.111561 & -0.8198 & 0.207966 \tabularnewline
9 & 0.017438 & 0.1281 & 0.449255 \tabularnewline
10 & 0.084964 & 0.6244 & 0.267511 \tabularnewline
11 & -0.019774 & -0.1453 & 0.442504 \tabularnewline
12 & -0.042678 & -0.3136 & 0.377509 \tabularnewline
13 & -0.131549 & -0.9667 & 0.169006 \tabularnewline
14 & 0.066768 & 0.4906 & 0.312833 \tabularnewline
15 & -0.015589 & -0.1146 & 0.454611 \tabularnewline
16 & -0.052383 & -0.3849 & 0.350899 \tabularnewline
17 & 0.047315 & 0.3477 & 0.36471 \tabularnewline
18 & -0.054919 & -0.4036 & 0.344062 \tabularnewline
19 & -0.113005 & -0.8304 & 0.204981 \tabularnewline
20 & 0.107358 & 0.7889 & 0.216806 \tabularnewline
21 & -0.018611 & -0.1368 & 0.445863 \tabularnewline
22 & -0.174645 & -1.2834 & 0.10242 \tabularnewline
23 & 0.02371 & 0.1742 & 0.431168 \tabularnewline
24 & -0.175487 & -1.2896 & 0.101349 \tabularnewline
25 & 0.041183 & 0.3026 & 0.381666 \tabularnewline
26 & 0.076964 & 0.5656 & 0.287015 \tabularnewline
27 & 0.129456 & 0.9513 & 0.172845 \tabularnewline
28 & 0.067414 & 0.4954 & 0.311168 \tabularnewline
29 & -0.131885 & -0.9692 & 0.168395 \tabularnewline
30 & -0.012074 & -0.0887 & 0.464815 \tabularnewline
31 & -0.06425 & -0.4721 & 0.319365 \tabularnewline
32 & -0.019894 & -0.1462 & 0.442159 \tabularnewline
33 & -0.041699 & -0.3064 & 0.380229 \tabularnewline
34 & -0.02018 & -0.1483 & 0.441331 \tabularnewline
35 & -0.063488 & -0.4665 & 0.321353 \tabularnewline
36 & -0.044631 & -0.328 & 0.372101 \tabularnewline
37 & -0.005211 & -0.0383 & 0.484798 \tabularnewline
38 & 0.058582 & 0.4305 & 0.334277 \tabularnewline
39 & 0.094592 & 0.6951 & 0.244984 \tabularnewline
40 & -0.122479 & -0.9 & 0.18605 \tabularnewline
41 & 0.017651 & 0.1297 & 0.448639 \tabularnewline
42 & 0.090744 & 0.6668 & 0.25386 \tabularnewline
43 & -0.031668 & -0.2327 & 0.408431 \tabularnewline
44 & 0.006385 & 0.0469 & 0.481376 \tabularnewline
45 & 0.078119 & 0.5741 & 0.284157 \tabularnewline
46 & -0.045202 & -0.3322 & 0.370526 \tabularnewline
47 & -0.063438 & -0.4662 & 0.321483 \tabularnewline
48 & -0.146202 & -1.0744 & 0.143719 \tabularnewline
49 & -0.029664 & -0.218 & 0.414131 \tabularnewline
50 & 0.063925 & 0.4698 & 0.320211 \tabularnewline
51 & -0.039814 & -0.2926 & 0.385484 \tabularnewline
52 & -0.012042 & -0.0885 & 0.464908 \tabularnewline
53 & -0.062461 & -0.459 & 0.32404 \tabularnewline
54 & NA & NA & NA \tabularnewline
55 & NA & NA & NA \tabularnewline
56 & NA & NA & NA \tabularnewline
57 & NA & NA & NA \tabularnewline
58 & NA & NA & NA \tabularnewline
59 & NA & NA & NA \tabularnewline
60 & NA & NA & NA \tabularnewline
\hline
\end{tabular}
%Source: https://freestatistics.org/blog/index.php?pk=31970&T=2

[TABLE]
[ROW][C]Partial Autocorrelation Function[/C][/ROW]
[ROW][C]Time lag k[/C][C]PACF(k)[/C][C]T-STAT[/C][C]P-value[/C][/ROW]
[ROW][C]1[/C][C]-0.142278[/C][C]-1.0455[/C][C]0.150219[/C][/ROW]
[ROW][C]2[/C][C]-0.105451[/C][C]-0.7749[/C][C]0.220887[/C][/ROW]
[ROW][C]3[/C][C]0.288813[/C][C]2.1223[/C][C]0.019206[/C][/ROW]
[ROW][C]4[/C][C]-0.120339[/C][C]-0.8843[/C][C]0.190226[/C][/ROW]
[ROW][C]5[/C][C]-0.035977[/C][C]-0.2644[/C][C]0.396248[/C][/ROW]
[ROW][C]6[/C][C]0.164464[/C][C]1.2086[/C][C]0.116049[/C][/ROW]
[ROW][C]7[/C][C]-0.104344[/C][C]-0.7668[/C][C]0.223279[/C][/ROW]
[ROW][C]8[/C][C]-0.111561[/C][C]-0.8198[/C][C]0.207966[/C][/ROW]
[ROW][C]9[/C][C]0.017438[/C][C]0.1281[/C][C]0.449255[/C][/ROW]
[ROW][C]10[/C][C]0.084964[/C][C]0.6244[/C][C]0.267511[/C][/ROW]
[ROW][C]11[/C][C]-0.019774[/C][C]-0.1453[/C][C]0.442504[/C][/ROW]
[ROW][C]12[/C][C]-0.042678[/C][C]-0.3136[/C][C]0.377509[/C][/ROW]
[ROW][C]13[/C][C]-0.131549[/C][C]-0.9667[/C][C]0.169006[/C][/ROW]
[ROW][C]14[/C][C]0.066768[/C][C]0.4906[/C][C]0.312833[/C][/ROW]
[ROW][C]15[/C][C]-0.015589[/C][C]-0.1146[/C][C]0.454611[/C][/ROW]
[ROW][C]16[/C][C]-0.052383[/C][C]-0.3849[/C][C]0.350899[/C][/ROW]
[ROW][C]17[/C][C]0.047315[/C][C]0.3477[/C][C]0.36471[/C][/ROW]
[ROW][C]18[/C][C]-0.054919[/C][C]-0.4036[/C][C]0.344062[/C][/ROW]
[ROW][C]19[/C][C]-0.113005[/C][C]-0.8304[/C][C]0.204981[/C][/ROW]
[ROW][C]20[/C][C]0.107358[/C][C]0.7889[/C][C]0.216806[/C][/ROW]
[ROW][C]21[/C][C]-0.018611[/C][C]-0.1368[/C][C]0.445863[/C][/ROW]
[ROW][C]22[/C][C]-0.174645[/C][C]-1.2834[/C][C]0.10242[/C][/ROW]
[ROW][C]23[/C][C]0.02371[/C][C]0.1742[/C][C]0.431168[/C][/ROW]
[ROW][C]24[/C][C]-0.175487[/C][C]-1.2896[/C][C]0.101349[/C][/ROW]
[ROW][C]25[/C][C]0.041183[/C][C]0.3026[/C][C]0.381666[/C][/ROW]
[ROW][C]26[/C][C]0.076964[/C][C]0.5656[/C][C]0.287015[/C][/ROW]
[ROW][C]27[/C][C]0.129456[/C][C]0.9513[/C][C]0.172845[/C][/ROW]
[ROW][C]28[/C][C]0.067414[/C][C]0.4954[/C][C]0.311168[/C][/ROW]
[ROW][C]29[/C][C]-0.131885[/C][C]-0.9692[/C][C]0.168395[/C][/ROW]
[ROW][C]30[/C][C]-0.012074[/C][C]-0.0887[/C][C]0.464815[/C][/ROW]
[ROW][C]31[/C][C]-0.06425[/C][C]-0.4721[/C][C]0.319365[/C][/ROW]
[ROW][C]32[/C][C]-0.019894[/C][C]-0.1462[/C][C]0.442159[/C][/ROW]
[ROW][C]33[/C][C]-0.041699[/C][C]-0.3064[/C][C]0.380229[/C][/ROW]
[ROW][C]34[/C][C]-0.02018[/C][C]-0.1483[/C][C]0.441331[/C][/ROW]
[ROW][C]35[/C][C]-0.063488[/C][C]-0.4665[/C][C]0.321353[/C][/ROW]
[ROW][C]36[/C][C]-0.044631[/C][C]-0.328[/C][C]0.372101[/C][/ROW]
[ROW][C]37[/C][C]-0.005211[/C][C]-0.0383[/C][C]0.484798[/C][/ROW]
[ROW][C]38[/C][C]0.058582[/C][C]0.4305[/C][C]0.334277[/C][/ROW]
[ROW][C]39[/C][C]0.094592[/C][C]0.6951[/C][C]0.244984[/C][/ROW]
[ROW][C]40[/C][C]-0.122479[/C][C]-0.9[/C][C]0.18605[/C][/ROW]
[ROW][C]41[/C][C]0.017651[/C][C]0.1297[/C][C]0.448639[/C][/ROW]
[ROW][C]42[/C][C]0.090744[/C][C]0.6668[/C][C]0.25386[/C][/ROW]
[ROW][C]43[/C][C]-0.031668[/C][C]-0.2327[/C][C]0.408431[/C][/ROW]
[ROW][C]44[/C][C]0.006385[/C][C]0.0469[/C][C]0.481376[/C][/ROW]
[ROW][C]45[/C][C]0.078119[/C][C]0.5741[/C][C]0.284157[/C][/ROW]
[ROW][C]46[/C][C]-0.045202[/C][C]-0.3322[/C][C]0.370526[/C][/ROW]
[ROW][C]47[/C][C]-0.063438[/C][C]-0.4662[/C][C]0.321483[/C][/ROW]
[ROW][C]48[/C][C]-0.146202[/C][C]-1.0744[/C][C]0.143719[/C][/ROW]
[ROW][C]49[/C][C]-0.029664[/C][C]-0.218[/C][C]0.414131[/C][/ROW]
[ROW][C]50[/C][C]0.063925[/C][C]0.4698[/C][C]0.320211[/C][/ROW]
[ROW][C]51[/C][C]-0.039814[/C][C]-0.2926[/C][C]0.385484[/C][/ROW]
[ROW][C]52[/C][C]-0.012042[/C][C]-0.0885[/C][C]0.464908[/C][/ROW]
[ROW][C]53[/C][C]-0.062461[/C][C]-0.459[/C][C]0.32404[/C][/ROW]
[ROW][C]54[/C][C]NA[/C][C]NA[/C][C]NA[/C][/ROW]
[ROW][C]55[/C][C]NA[/C][C]NA[/C][C]NA[/C][/ROW]
[ROW][C]56[/C][C]NA[/C][C]NA[/C][C]NA[/C][/ROW]
[ROW][C]57[/C][C]NA[/C][C]NA[/C][C]NA[/C][/ROW]
[ROW][C]58[/C][C]NA[/C][C]NA[/C][C]NA[/C][/ROW]
[ROW][C]59[/C][C]NA[/C][C]NA[/C][C]NA[/C][/ROW]
[ROW][C]60[/C][C]NA[/C][C]NA[/C][C]NA[/C][/ROW]
[/TABLE]
Source: https://freestatistics.org/blog/index.php?pk=31970&T=2

Globally Unique Identifier (entire table): ba.freestatistics.org/blog/index.php?pk=31970&T=2

As an alternative you can also use a QR Code:  

The GUIDs for individual cells are displayed in the table below:

Partial Autocorrelation Function
Time lag kPACF(k)T-STATP-value
1-0.142278-1.04550.150219
2-0.105451-0.77490.220887
30.2888132.12230.019206
4-0.120339-0.88430.190226
5-0.035977-0.26440.396248
60.1644641.20860.116049
7-0.104344-0.76680.223279
8-0.111561-0.81980.207966
90.0174380.12810.449255
100.0849640.62440.267511
11-0.019774-0.14530.442504
12-0.042678-0.31360.377509
13-0.131549-0.96670.169006
140.0667680.49060.312833
15-0.015589-0.11460.454611
16-0.052383-0.38490.350899
170.0473150.34770.36471
18-0.054919-0.40360.344062
19-0.113005-0.83040.204981
200.1073580.78890.216806
21-0.018611-0.13680.445863
22-0.174645-1.28340.10242
230.023710.17420.431168
24-0.175487-1.28960.101349
250.0411830.30260.381666
260.0769640.56560.287015
270.1294560.95130.172845
280.0674140.49540.311168
29-0.131885-0.96920.168395
30-0.012074-0.08870.464815
31-0.06425-0.47210.319365
32-0.019894-0.14620.442159
33-0.041699-0.30640.380229
34-0.02018-0.14830.441331
35-0.063488-0.46650.321353
36-0.044631-0.3280.372101
37-0.005211-0.03830.484798
380.0585820.43050.334277
390.0945920.69510.244984
40-0.122479-0.90.18605
410.0176510.12970.448639
420.0907440.66680.25386
43-0.031668-0.23270.408431
440.0063850.04690.481376
450.0781190.57410.284157
46-0.045202-0.33220.370526
47-0.063438-0.46620.321483
48-0.146202-1.07440.143719
49-0.029664-0.2180.414131
500.0639250.46980.320211
51-0.039814-0.29260.385484
52-0.012042-0.08850.464908
53-0.062461-0.4590.32404
54NANANA
55NANANA
56NANANA
57NANANA
58NANANA
59NANANA
60NANANA


Parameters (Session):
par1 = 60 ; par2 = 0.2 ; par3 = 0 ; par4 = 1 ; par5 = 12 ;
Parameters (R input):
par1 = 60 ; par2 = 0.2 ; par3 = 0 ; par4 = 1 ; par5 = 12 ;
R code (references can be found in the software module):
if (par1 == 'Default') {
par1 = 10*log10(length(x))
} else {
par1 <- as.numeric(par1)
}
par2 <- as.numeric(par2)
par3 <- as.numeric(par3)
par4 <- as.numeric(par4)
par5 <- as.numeric(par5)
if (par2 == 0) {
x <- log(x)
} else {
x <- (x ^ par2 - 1) / par2
}
if (par3 > 0) x <- diff(x,lag=1,difference=par3)
if (par4 > 0) x <- diff(x,lag=par5,difference=par4)
bitmap(file='pic1.png')
racf <- acf(x,par1,main='Autocorrelation',xlab='lags',ylab='ACF')
dev.off()
bitmap(file='pic2.png')
rpacf <- pacf(x,par1,main='Partial Autocorrelation',xlab='lags',ylab='PACF')
dev.off()
(myacf <- c(racf$acf))
(mypacf <- c(rpacf$acf))
lengthx <- length(x)
sqrtn <- sqrt(lengthx)
load(file='createtable')
a<-table.start()
a<-table.row.start(a)
a<-table.element(a,'Autocorrelation Function',4,TRUE)
a<-table.row.end(a)
a<-table.row.start(a)
a<-table.element(a,'Time lag k',header=TRUE)
a<-table.element(a,hyperlink('basics.htm','ACF(k)','click here for more information about the Autocorrelation Function'),header=TRUE)
a<-table.element(a,'T-STAT',header=TRUE)
a<-table.element(a,'P-value',header=TRUE)
a<-table.row.end(a)
for (i in 2:(par1+1)) {
a<-table.row.start(a)
a<-table.element(a,i-1,header=TRUE)
a<-table.element(a,round(myacf[i],6))
mytstat <- myacf[i]*sqrtn
a<-table.element(a,round(mytstat,4))
a<-table.element(a,round(1-pt(abs(mytstat),lengthx),6))
a<-table.row.end(a)
}
a<-table.end(a)
table.save(a,file='mytable.tab')
a<-table.start()
a<-table.row.start(a)
a<-table.element(a,'Partial Autocorrelation Function',4,TRUE)
a<-table.row.end(a)
a<-table.row.start(a)
a<-table.element(a,'Time lag k',header=TRUE)
a<-table.element(a,hyperlink('basics.htm','PACF(k)','click here for more information about the Partial Autocorrelation Function'),header=TRUE)
a<-table.element(a,'T-STAT',header=TRUE)
a<-table.element(a,'P-value',header=TRUE)
a<-table.row.end(a)
for (i in 1:par1) {
a<-table.row.start(a)
a<-table.element(a,i,header=TRUE)
a<-table.element(a,round(mypacf[i],6))
mytstat <- mypacf[i]*sqrtn
a<-table.element(a,round(mytstat,4))
a<-table.element(a,round(1-pt(abs(mytstat),lengthx),6))
a<-table.row.end(a)
}
a<-table.end(a)
table.save(a,file='mytable1.tab')